

Key Insights
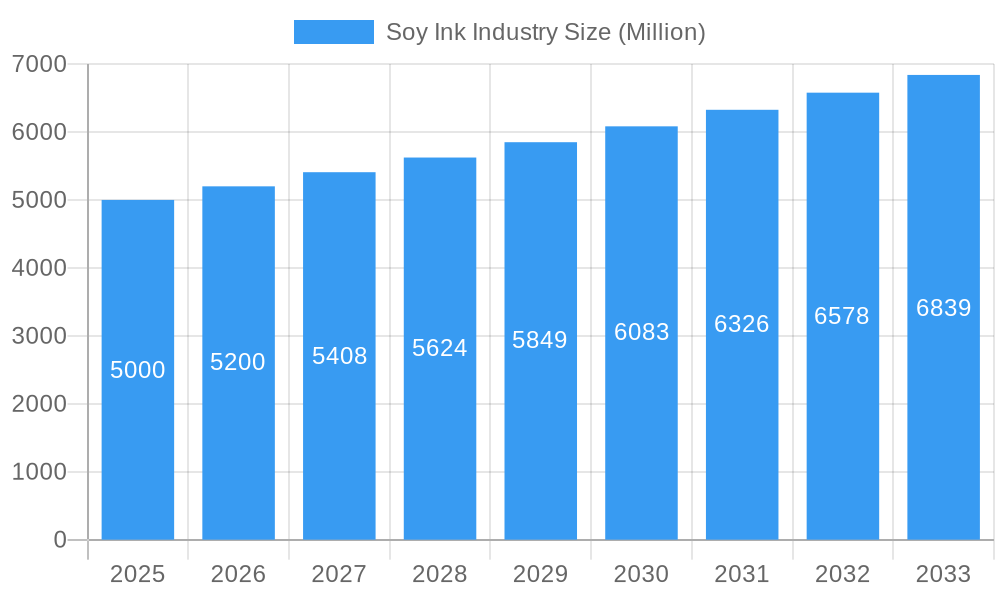
The soy ink industry is experiencing robust growth, fueled by increasing demand for eco-friendly printing solutions. With a current market size estimated at $5 billion in 2025 and a compound annual growth rate (CAGR) exceeding 4%, the market is projected to reach approximately $7 billion by 2033. This expansion is primarily driven by growing consumer awareness of environmental concerns and stricter regulations regarding volatile organic compounds (VOCs) in traditional inks. The shift towards sustainable packaging and printing practices across various sectors, including food and beverage, pharmaceuticals, and cosmetics, significantly contributes to the industry's upward trajectory. Major market players like Flint Group, Sun Chemical, and Hubergroup are actively investing in research and development to improve the performance and versatility of soy-based inks, further accelerating market growth. Competitive pricing and the readily available soy-based raw materials also enhance the market's attractiveness.
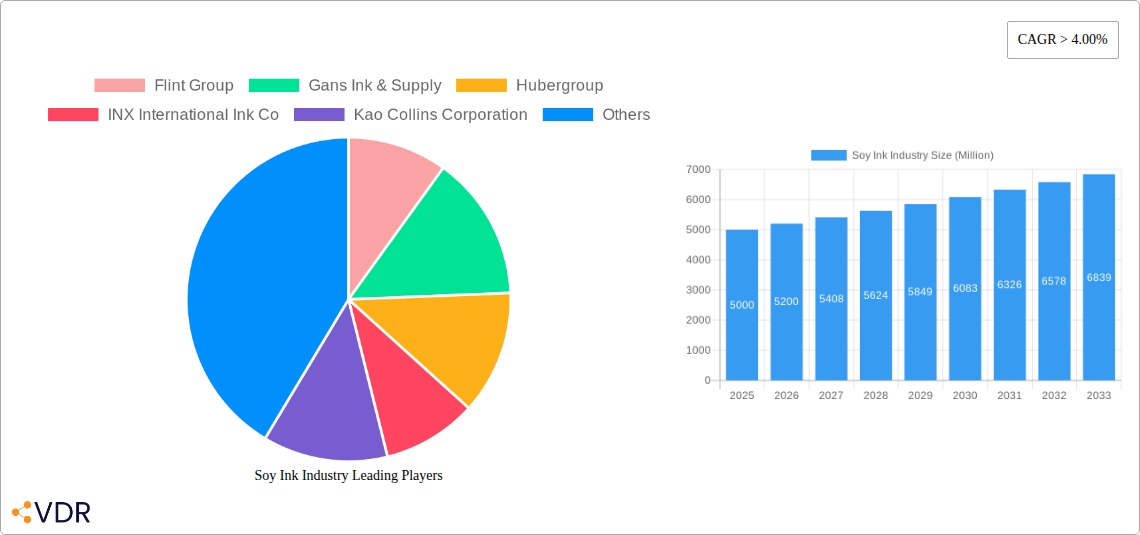
Soy Ink Industry Market Size (In Billion)
However, challenges remain. Price fluctuations in soy commodity markets can impact production costs. Furthermore, soy ink's potential limitations in certain printing applications, such as high-speed printing or requiring specific substrate compatibility, may hinder wider adoption. Nevertheless, ongoing technological advancements are continuously addressing these limitations, enhancing the overall performance and expanding the applications of soy-based inks. The industry's future remains positive, with a continued focus on innovation and sustainability expected to drive considerable growth in the coming years. The segmentation of the market likely includes various types of soy inks catering to different applications and printing processes, which further contributes to market diversification and expansion.
Soy Ink Industry Company Market Share
Soy Ink Industry Market Report: 2019-2033
This comprehensive report provides a detailed analysis of the soy ink industry, encompassing market dynamics, growth trends, regional performance, product landscape, key players, and future outlook. The study covers the historical period (2019-2024), base year (2025), and forecast period (2025-2033), offering valuable insights for industry professionals, investors, and strategic decision-makers. The report segments the market into various categories, enabling a granular understanding of the market's evolving structure.
Soy Ink Industry Market Dynamics & Structure
The global soy ink market, valued at xx Million in 2024, is characterized by moderate concentration with several key players holding significant market share. Technological innovation, particularly in sustainable and eco-friendly ink formulations, is a major driver. Stringent environmental regulations globally are also shaping the market, favoring soy-based inks due to their biodegradability. Competition from synthetic inks remains a challenge, but the growing demand for sustainable packaging is creating a favorable environment for soy ink adoption. Mergers and acquisitions (M&A) activity within the industry has been moderate, with a total of xx deals recorded between 2019 and 2024. This activity primarily focuses on expanding product portfolios and geographical reach.
- Market Concentration: Moderately concentrated, with top 5 players holding approximately xx% market share in 2024.
- Technological Innovation: Focus on bio-renewable content, improved printability, and reduced environmental impact.
- Regulatory Framework: Increasingly stringent environmental regulations driving demand for sustainable inks.
- Competitive Substitutes: Synthetic inks pose a significant competitive challenge.
- End-User Demographics: Packaging industry is the primary end-user, followed by publishing and commercial printing.
- M&A Trends: Moderate activity focused on expanding product lines and market access.
Soy Ink Industry Growth Trends & Insights
The soy ink market is projected to experience significant growth during the forecast period (2025-2033), driven by increasing consumer awareness of environmental sustainability and the rising demand for eco-friendly packaging solutions. The market size is expected to reach xx Million by 2033, registering a CAGR of xx% during the forecast period. Technological advancements, such as the development of inks with higher bio-renewable content and improved print quality, are further fueling market growth. The adoption rate of soy inks is steadily increasing across various end-use segments, particularly within the packaging and publishing sectors. Consumer preference for sustainable products is a crucial factor contributing to the market's positive trajectory. Market penetration is expected to rise from xx% in 2025 to xx% by 2033.
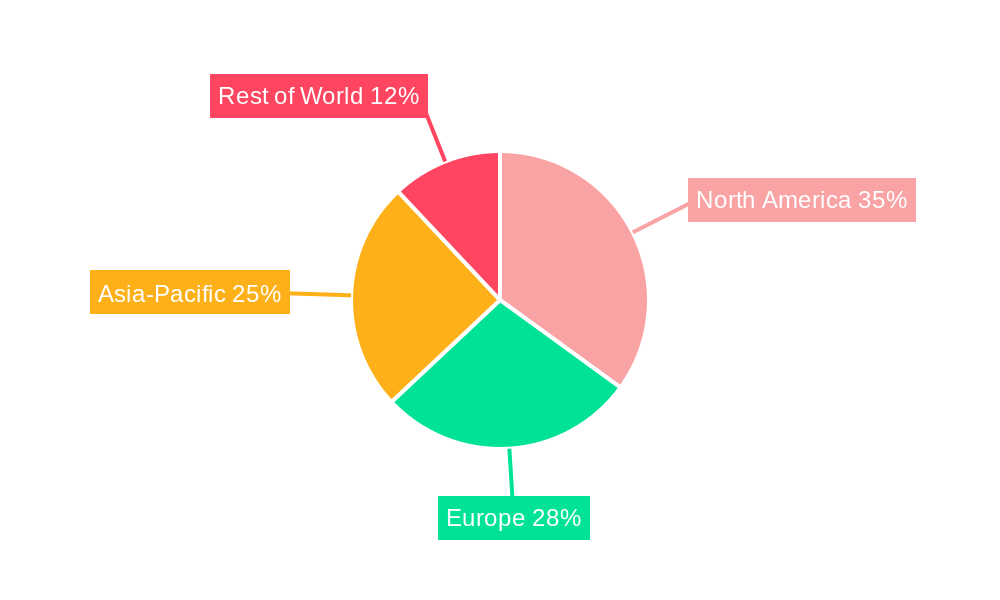
Dominant Regions, Countries, or Segments in Soy Ink Industry
North America and Europe currently hold the largest market shares in the soy ink industry, driven by strong environmental regulations and a high level of consumer awareness regarding sustainability. However, Asia-Pacific is projected to exhibit the fastest growth rate during the forecast period due to rapid industrialization, increasing packaging demand, and growing adoption of sustainable printing practices.
- North America: Strong regulatory environment and high consumer demand for sustainable products.
- Europe: Similar to North America, stringent regulations and high environmental consciousness fuel growth.
- Asia-Pacific: Fastest-growing region due to rapid industrialization and rising demand for eco-friendly packaging.
- Key Drivers: Stringent environmental regulations, increasing consumer awareness of sustainability, and growing demand for eco-friendly packaging.
Soy Ink Industry Product Landscape
Soy-based inks are continuously evolving, with innovations focusing on enhancing printability, color vibrancy, and overall performance. Formulations incorporating higher bio-renewable content are gaining traction, aligning with the growing emphasis on sustainability. The inks are widely used in various applications, including packaging, publications, and commercial printing, where their eco-friendly attributes are highly valued. Unique selling propositions include biodegradability, reduced environmental impact, and often, comparable or superior print quality compared to traditional inks.
Key Drivers, Barriers & Challenges in Soy Ink Industry
Key Drivers: Growing demand for sustainable packaging, stringent environmental regulations, and increasing consumer preference for eco-friendly products are the primary drivers of growth. Technological advancements leading to improved performance and cost-effectiveness of soy inks also play a significant role.
Challenges: Competition from synthetic inks, price volatility of raw materials (soybeans), and potential supply chain disruptions pose significant challenges. Furthermore, achieving consistent print quality across various substrates can also be a barrier to wider adoption. The cost of soy ink can be higher than some synthetic alternatives, potentially limiting its adoption in price-sensitive markets.
Emerging Opportunities in Soy Ink Industry
Untapped markets in developing economies present significant growth opportunities. Innovations in ink formulations, such as the development of soy-based inks for specialized applications (e.g., flexible packaging), and addressing the challenges in achieving the same vibrancy as conventional inks will unlock new market potential. Furthermore, partnerships with packaging companies and brands committed to sustainability can create synergistic growth opportunities.
Growth Accelerators in the Soy Ink Industry
Technological breakthroughs in soy ink formulations, resulting in enhanced performance and lower costs, are expected to significantly boost market growth. Strategic partnerships between soy ink manufacturers and major printing and packaging companies will further accelerate adoption. Government initiatives promoting sustainable practices and favorable policies supporting the use of bio-based materials will also play a key role.
Key Players Shaping the Soy Ink Industry Market
- Flint Group
- Gans Ink & Supply
- Hubergroup
- INX International Ink Co
- Kao Collins Corporation
- Siegwerk Druckfarben AG & Co KGaA
- Omya AG
- Sun Chemical
- Synthotex Chemicals Pvt Ltd
- Toyo Ink America LLC *List Not Exhaustive
Notable Milestones in Soy Ink Industry Sector
- May 10, 2022: Flint Group launched its Kryoset Flint ink series, a heat-set ink eliminating the drying process.
- May 11, 2022: Siegwerk launched its SICURA Litho Pack ECO series, a UV offset ink with high bio-renewable content.
In-Depth Soy Ink Industry Market Outlook
The soy ink industry is poised for robust growth, driven by the convergence of environmental concerns, technological advancements, and increasing consumer demand for sustainable products. Strategic investments in research and development, coupled with collaborations across the value chain, will unlock significant market potential and create lucrative opportunities for key players. The focus on sustainability and the continuous improvement of soy ink performance will further solidify its position within the printing and packaging industries.
Soy Ink Industry Segmentation
-
1. Type
- 1.1. Flint Ink
- 1.2. Soy-based Ink
- 1.3. UV Ink
- 1.4. Other Types
-
2. Application
- 2.1. Label and Packaging
- 2.2. Commercial Printing
- 2.3. Publication
- 2.4. Other Applications
Soy Ink Industry Segmentation By Geography
-
1. Asia Pacific
- 1.1. China
- 1.2. India
- 1.3. Japan
- 1.4. South Korea
- 1.5. Rest of Asia Pacific
-
2. North America
- 2.1. United States
- 2.2. Canada
- 2.3. Mexico
-
3. Europe
- 3.1. Germany
- 3.2. United Kingdom
- 3.3. France
- 3.4. Italy
- 3.5. Rest of Europe
-
4. South America
- 4.1. Brazil
- 4.2. Argentina
- 4.3. Rest of South America
-
5. Middle East and Africa
- 5.1. Saudi Arabia
- 5.2. South Africa
- 5.3. Rest of Middle East and Africa
Soy Ink Industry Regional Market Share
Geographic Coverage of Soy Ink Industry
Soy Ink Industry REPORT HIGHLIGHTS
| Aspects | Details |
|---|---|
| Study Period | 2020-2034 |
| Base Year | 2025 |
| Estimated Year | 2026 |
| Forecast Period | 2026-2034 |
| Historical Period | 2020-2025 |
| Growth Rate | CAGR of 6% from 2020-2034 |
| Segmentation |
|
Table of Contents
- 1. Introduction
- 1.1. Research Scope
- 1.2. Market Segmentation
- 1.3. Research Objective
- 1.4. Definitions and Assumptions
- 2. Executive Summary
- 2.1. Market Snapshot
- 3. Market Dynamics
- 3.1. Market Drivers
- 3.2. Market Restrains
- 3.3. Market Trends
- 3.4. Market Opportunities
- 4. Market Factor Analysis
- 4.1. Porters Five Forces
- 4.1.1. Bargaining Power of Suppliers
- 4.1.2. Bargaining Power of Buyers
- 4.1.3. Threat of New Entrants
- 4.1.4. Threat of Substitutes
- 4.1.5. Competitive Rivalry
- 4.2. PESTEL analysis
- 4.3. BCG Analysis
- 4.3.1. Stars (High Growth, High Market Share)
- 4.3.2. Cash Cows (Low Growth, High Market Share)
- 4.3.3. Question Mark (High Growth, Low Market Share)
- 4.3.4. Dogs (Low Growth, Low Market Share)
- 4.4. Ansoff Matrix Analysis
- 4.5. Supply Chain Analysis
- 4.6. Regulatory Landscape
- 4.7. Current Market Potential and Opportunity Assessment (TAM–SAM–SOM Framework)
- 4.8. VDR Analyst Note
- 4.1. Porters Five Forces
- 5. Market Analysis, Insights and Forecast 2021-2033
- 5.1. Market Analysis, Insights and Forecast - by Type
- 5.1.1. Flint Ink
- 5.1.2. Soy-based Ink
- 5.1.3. UV Ink
- 5.1.4. Other Types
- 5.2. Market Analysis, Insights and Forecast - by Application
- 5.2.1. Label and Packaging
- 5.2.2. Commercial Printing
- 5.2.3. Publication
- 5.2.4. Other Applications
- 5.3. Market Analysis, Insights and Forecast - by Region
- 5.3.1. Asia Pacific
- 5.3.2. North America
- 5.3.3. Europe
- 5.3.4. South America
- 5.3.5. Middle East and Africa
- 5.1. Market Analysis, Insights and Forecast - by Type
- 6. Global Soy Ink Industry Analysis, Insights and Forecast, 2021-2033
- 6.1. Market Analysis, Insights and Forecast - by Type
- 6.1.1. Flint Ink
- 6.1.2. Soy-based Ink
- 6.1.3. UV Ink
- 6.1.4. Other Types
- 6.2. Market Analysis, Insights and Forecast - by Application
- 6.2.1. Label and Packaging
- 6.2.2. Commercial Printing
- 6.2.3. Publication
- 6.2.4. Other Applications
- 6.1. Market Analysis, Insights and Forecast - by Type
- 7. Asia Pacific Soy Ink Industry Analysis, Insights and Forecast, 2021-2033
- 7.1. Market Analysis, Insights and Forecast - by Type
- 7.1.1. Flint Ink
- 7.1.2. Soy-based Ink
- 7.1.3. UV Ink
- 7.1.4. Other Types
- 7.2. Market Analysis, Insights and Forecast - by Application
- 7.2.1. Label and Packaging
- 7.2.2. Commercial Printing
- 7.2.3. Publication
- 7.2.4. Other Applications
- 7.1. Market Analysis, Insights and Forecast - by Type
- 8. North America Soy Ink Industry Analysis, Insights and Forecast, 2021-2033
- 8.1. Market Analysis, Insights and Forecast - by Type
- 8.1.1. Flint Ink
- 8.1.2. Soy-based Ink
- 8.1.3. UV Ink
- 8.1.4. Other Types
- 8.2. Market Analysis, Insights and Forecast - by Application
- 8.2.1. Label and Packaging
- 8.2.2. Commercial Printing
- 8.2.3. Publication
- 8.2.4. Other Applications
- 8.1. Market Analysis, Insights and Forecast - by Type
- 9. Europe Soy Ink Industry Analysis, Insights and Forecast, 2021-2033
- 9.1. Market Analysis, Insights and Forecast - by Type
- 9.1.1. Flint Ink
- 9.1.2. Soy-based Ink
- 9.1.3. UV Ink
- 9.1.4. Other Types
- 9.2. Market Analysis, Insights and Forecast - by Application
- 9.2.1. Label and Packaging
- 9.2.2. Commercial Printing
- 9.2.3. Publication
- 9.2.4. Other Applications
- 9.1. Market Analysis, Insights and Forecast - by Type
- 10. South America Soy Ink Industry Analysis, Insights and Forecast, 2021-2033
- 10.1. Market Analysis, Insights and Forecast - by Type
- 10.1.1. Flint Ink
- 10.1.2. Soy-based Ink
- 10.1.3. UV Ink
- 10.1.4. Other Types
- 10.2. Market Analysis, Insights and Forecast - by Application
- 10.2.1. Label and Packaging
- 10.2.2. Commercial Printing
- 10.2.3. Publication
- 10.2.4. Other Applications
- 10.1. Market Analysis, Insights and Forecast - by Type
- 11. Middle East and Africa Soy Ink Industry Analysis, Insights and Forecast, 2021-2033
- 11.1. Market Analysis, Insights and Forecast - by Type
- 11.1.1. Flint Ink
- 11.1.2. Soy-based Ink
- 11.1.3. UV Ink
- 11.1.4. Other Types
- 11.2. Market Analysis, Insights and Forecast - by Application
- 11.2.1. Label and Packaging
- 11.2.2. Commercial Printing
- 11.2.3. Publication
- 11.2.4. Other Applications
- 11.1. Market Analysis, Insights and Forecast - by Type
- 12. Competitive Analysis
- 12.1. Company Profiles
- 12.1.1 Flint Group
- 12.1.1.1. Company Overview
- 12.1.1.2. Products
- 12.1.1.3. Company Financials
- 12.1.1.4. SWOT Analysis
- 12.1.2 Gans Ink & Supply
- 12.1.2.1. Company Overview
- 12.1.2.2. Products
- 12.1.2.3. Company Financials
- 12.1.2.4. SWOT Analysis
- 12.1.3 Hubergroup
- 12.1.3.1. Company Overview
- 12.1.3.2. Products
- 12.1.3.3. Company Financials
- 12.1.3.4. SWOT Analysis
- 12.1.4 INX International Ink Co
- 12.1.4.1. Company Overview
- 12.1.4.2. Products
- 12.1.4.3. Company Financials
- 12.1.4.4. SWOT Analysis
- 12.1.5 Kao Collins Corporation
- 12.1.5.1. Company Overview
- 12.1.5.2. Products
- 12.1.5.3. Company Financials
- 12.1.5.4. SWOT Analysis
- 12.1.6 Siegwerk Druckfarben AG & Co KGaA
- 12.1.6.1. Company Overview
- 12.1.6.2. Products
- 12.1.6.3. Company Financials
- 12.1.6.4. SWOT Analysis
- 12.1.7 Omya AG
- 12.1.7.1. Company Overview
- 12.1.7.2. Products
- 12.1.7.3. Company Financials
- 12.1.7.4. SWOT Analysis
- 12.1.8 Sun Chemical
- 12.1.8.1. Company Overview
- 12.1.8.2. Products
- 12.1.8.3. Company Financials
- 12.1.8.4. SWOT Analysis
- 12.1.9 Synthotex Chemicals Pvt Ltd
- 12.1.9.1. Company Overview
- 12.1.9.2. Products
- 12.1.9.3. Company Financials
- 12.1.9.4. SWOT Analysis
- 12.1.10 Toyo Ink America LLC *List Not Exhaustive
- 12.1.10.1. Company Overview
- 12.1.10.2. Products
- 12.1.10.3. Company Financials
- 12.1.10.4. SWOT Analysis
- 12.1.1 Flint Group
- 12.2. Market Entropy
- 12.2.1 Company's Key Areas Served
- 12.2.2 Recent Developments
- 12.3. Company Market Share Analysis 2025
- 12.3.1 Top 5 Companies Market Share Analysis
- 12.3.2 Top 3 Companies Market Share Analysis
- 12.4. List of Potential Customers
- 13. Research Methodology
List of Figures
- Figure 1: Global Soy Ink Industry Revenue Breakdown (billion, %) by Region 2025 & 2033
- Figure 2: Asia Pacific Soy Ink Industry Revenue (billion), by Type 2025 & 2033
- Figure 3: Asia Pacific Soy Ink Industry Revenue Share (%), by Type 2025 & 2033
- Figure 4: Asia Pacific Soy Ink Industry Revenue (billion), by Application 2025 & 2033
- Figure 5: Asia Pacific Soy Ink Industry Revenue Share (%), by Application 2025 & 2033
- Figure 6: Asia Pacific Soy Ink Industry Revenue (billion), by Country 2025 & 2033
- Figure 7: Asia Pacific Soy Ink Industry Revenue Share (%), by Country 2025 & 2033
- Figure 8: North America Soy Ink Industry Revenue (billion), by Type 2025 & 2033
- Figure 9: North America Soy Ink Industry Revenue Share (%), by Type 2025 & 2033
- Figure 10: North America Soy Ink Industry Revenue (billion), by Application 2025 & 2033
- Figure 11: North America Soy Ink Industry Revenue Share (%), by Application 2025 & 2033
- Figure 12: North America Soy Ink Industry Revenue (billion), by Country 2025 & 2033
- Figure 13: North America Soy Ink Industry Revenue Share (%), by Country 2025 & 2033
- Figure 14: Europe Soy Ink Industry Revenue (billion), by Type 2025 & 2033
- Figure 15: Europe Soy Ink Industry Revenue Share (%), by Type 2025 & 2033
- Figure 16: Europe Soy Ink Industry Revenue (billion), by Application 2025 & 2033
- Figure 17: Europe Soy Ink Industry Revenue Share (%), by Application 2025 & 2033
- Figure 18: Europe Soy Ink Industry Revenue (billion), by Country 2025 & 2033
- Figure 19: Europe Soy Ink Industry Revenue Share (%), by Country 2025 & 2033
- Figure 20: South America Soy Ink Industry Revenue (billion), by Type 2025 & 2033
- Figure 21: South America Soy Ink Industry Revenue Share (%), by Type 2025 & 2033
- Figure 22: South America Soy Ink Industry Revenue (billion), by Application 2025 & 2033
- Figure 23: South America Soy Ink Industry Revenue Share (%), by Application 2025 & 2033
- Figure 24: South America Soy Ink Industry Revenue (billion), by Country 2025 & 2033
- Figure 25: South America Soy Ink Industry Revenue Share (%), by Country 2025 & 2033
- Figure 26: Middle East and Africa Soy Ink Industry Revenue (billion), by Type 2025 & 2033
- Figure 27: Middle East and Africa Soy Ink Industry Revenue Share (%), by Type 2025 & 2033
- Figure 28: Middle East and Africa Soy Ink Industry Revenue (billion), by Application 2025 & 2033
- Figure 29: Middle East and Africa Soy Ink Industry Revenue Share (%), by Application 2025 & 2033
- Figure 30: Middle East and Africa Soy Ink Industry Revenue (billion), by Country 2025 & 2033
- Figure 31: Middle East and Africa Soy Ink Industry Revenue Share (%), by Country 2025 & 2033
List of Tables
- Table 1: Global Soy Ink Industry Revenue billion Forecast, by Type 2020 & 2033
- Table 2: Global Soy Ink Industry Revenue billion Forecast, by Application 2020 & 2033
- Table 3: Global Soy Ink Industry Revenue billion Forecast, by Region 2020 & 2033
- Table 4: Global Soy Ink Industry Revenue billion Forecast, by Type 2020 & 2033
- Table 5: Global Soy Ink Industry Revenue billion Forecast, by Application 2020 & 2033
- Table 6: Global Soy Ink Industry Revenue billion Forecast, by Country 2020 & 2033
- Table 7: China Soy Ink Industry Revenue (billion) Forecast, by Application 2020 & 2033
- Table 8: India Soy Ink Industry Revenue (billion) Forecast, by Application 2020 & 2033
- Table 9: Japan Soy Ink Industry Revenue (billion) Forecast, by Application 2020 & 2033
- Table 10: South Korea Soy Ink Industry Revenue (billion) Forecast, by Application 2020 & 2033
- Table 11: Rest of Asia Pacific Soy Ink Industry Revenue (billion) Forecast, by Application 2020 & 2033
- Table 12: Global Soy Ink Industry Revenue billion Forecast, by Type 2020 & 2033
- Table 13: Global Soy Ink Industry Revenue billion Forecast, by Application 2020 & 2033
- Table 14: Global Soy Ink Industry Revenue billion Forecast, by Country 2020 & 2033
- Table 15: United States Soy Ink Industry Revenue (billion) Forecast, by Application 2020 & 2033
- Table 16: Canada Soy Ink Industry Revenue (billion) Forecast, by Application 2020 & 2033
- Table 17: Mexico Soy Ink Industry Revenue (billion) Forecast, by Application 2020 & 2033
- Table 18: Global Soy Ink Industry Revenue billion Forecast, by Type 2020 & 2033
- Table 19: Global Soy Ink Industry Revenue billion Forecast, by Application 2020 & 2033
- Table 20: Global Soy Ink Industry Revenue billion Forecast, by Country 2020 & 2033
- Table 21: Germany Soy Ink Industry Revenue (billion) Forecast, by Application 2020 & 2033
- Table 22: United Kingdom Soy Ink Industry Revenue (billion) Forecast, by Application 2020 & 2033
- Table 23: France Soy Ink Industry Revenue (billion) Forecast, by Application 2020 & 2033
- Table 24: Italy Soy Ink Industry Revenue (billion) Forecast, by Application 2020 & 2033
- Table 25: Rest of Europe Soy Ink Industry Revenue (billion) Forecast, by Application 2020 & 2033
- Table 26: Global Soy Ink Industry Revenue billion Forecast, by Type 2020 & 2033
- Table 27: Global Soy Ink Industry Revenue billion Forecast, by Application 2020 & 2033
- Table 28: Global Soy Ink Industry Revenue billion Forecast, by Country 2020 & 2033
- Table 29: Brazil Soy Ink Industry Revenue (billion) Forecast, by Application 2020 & 2033
- Table 30: Argentina Soy Ink Industry Revenue (billion) Forecast, by Application 2020 & 2033
- Table 31: Rest of South America Soy Ink Industry Revenue (billion) Forecast, by Application 2020 & 2033
- Table 32: Global Soy Ink Industry Revenue billion Forecast, by Type 2020 & 2033
- Table 33: Global Soy Ink Industry Revenue billion Forecast, by Application 2020 & 2033
- Table 34: Global Soy Ink Industry Revenue billion Forecast, by Country 2020 & 2033
- Table 35: Saudi Arabia Soy Ink Industry Revenue (billion) Forecast, by Application 2020 & 2033
- Table 36: South Africa Soy Ink Industry Revenue (billion) Forecast, by Application 2020 & 2033
- Table 37: Rest of Middle East and Africa Soy Ink Industry Revenue (billion) Forecast, by Application 2020 & 2033
Frequently Asked Questions
1. What is the projected Compound Annual Growth Rate (CAGR) of the Soy Ink Industry?
The projected CAGR is approximately 6%.
2. Which companies are prominent players in the Soy Ink Industry?
Key companies in the market include Flint Group, Gans Ink & Supply, Hubergroup, INX International Ink Co, Kao Collins Corporation, Siegwerk Druckfarben AG & Co KGaA, Omya AG, Sun Chemical, Synthotex Chemicals Pvt Ltd, Toyo Ink America LLC *List Not Exhaustive.
3. What are the main segments of the Soy Ink Industry?
The market segments include Type, Application.
4. Can you provide details about the market size?
The market size is estimated to be USD 4.8 billion as of 2022.
5. What are some drivers contributing to market growth?
Growth in Demand from Packaging Industry; Growing Concerns Related to VOC Emissions from Conventional Ink Printing Solutions.
6. What are the notable trends driving market growth?
Growth in Demand from Packaging Industry.
7. Are there any restraints impacting market growth?
Growth in Demand from Packaging Industry; Growing Concerns Related to VOC Emissions from Conventional Ink Printing Solutions.
8. Can you provide examples of recent developments in the market?
May 11, 2022: Siegwerk launched a new UV offset ink series with high bio-renewable content for paper and board applications. With its new SICURA Litho Pack ECO series, Siegwerk added another sustainable ink solution with a high share of bio-renewable content. This is expected to help the company further expand its offering in line with the circular economy.
9. What pricing options are available for accessing the report?
Pricing options include single-user, multi-user, and enterprise licenses priced at USD 4750, USD 5250, and USD 8750 respectively.
10. Is the market size provided in terms of value or volume?
The market size is provided in terms of value, measured in billion.
11. Are there any specific market keywords associated with the report?
Yes, the market keyword associated with the report is "Soy Ink Industry," which aids in identifying and referencing the specific market segment covered.
12. How do I determine which pricing option suits my needs best?
The pricing options vary based on user requirements and access needs. Individual users may opt for single-user licenses, while businesses requiring broader access may choose multi-user or enterprise licenses for cost-effective access to the report.
13. Are there any additional resources or data provided in the Soy Ink Industry report?
While the report offers comprehensive insights, it's advisable to review the specific contents or supplementary materials provided to ascertain if additional resources or data are available.
14. How can I stay updated on further developments or reports in the Soy Ink Industry?
To stay informed about further developments, trends, and reports in the Soy Ink Industry, consider subscribing to industry newsletters, following relevant companies and organizations, or regularly checking reputable industry news sources and publications.
Methodology
Step 1 - Identification of Relevant Samples Size from Population Database


Step 2 - Approaches for Defining Global Market Size (Value, Volume* & Price*)

Note*: In applicable scenarios
Step 3 - Data Sources
Primary Research
- Web Analytics
- Survey Reports
- Research Institute
- Latest Research Reports
- Opinion Leaders
Secondary Research
- Annual Reports
- White Paper
- Latest Press Release
- Industry Association
- Paid Database
- Investor Presentations

Step 4 - Data Triangulation
Involves using different sources of information in order to increase the validity of a study
These sources are likely to be stakeholders in a program - participants, other researchers, program staff, other community members, and so on.
Then we put all data in single framework & apply various statistical tools to find out the dynamic on the market.
During the analysis stage, feedback from the stakeholder groups would be compared to determine areas of agreement as well as areas of divergence