

Key Insights
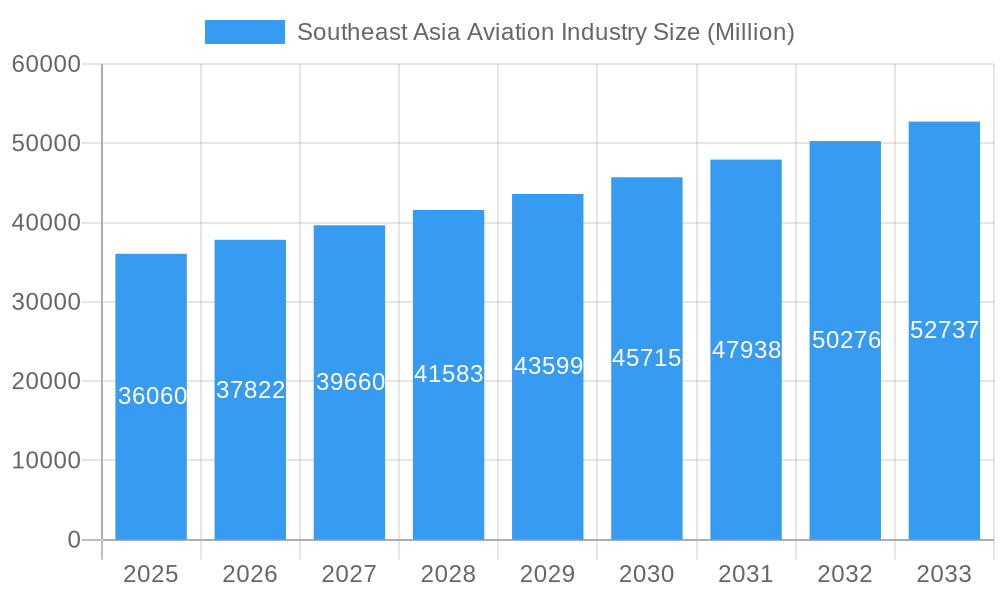
The Southeast Asia aviation industry, valued at $36.06 billion in 2025, is projected to experience robust growth, driven by factors such as rising disposable incomes, increasing tourism, and the expansion of regional air travel networks. The region's burgeoning middle class fuels demand for air travel, both domestically and internationally, leading to increased passenger numbers and cargo volumes. Government investments in airport infrastructure and the modernization of existing facilities further contribute to this positive trend. While potential constraints exist, such as fuel price volatility and geopolitical instability, the long-term outlook remains optimistic. Growth is expected to be particularly strong in countries like Indonesia, the Philippines, and Vietnam, reflecting their rapidly developing economies and expanding populations. The diverse segments within the industry, encompassing commercial, freighter, military, and general aviation aircraft, present varied opportunities for growth. The continued expansion of low-cost carriers and the increasing adoption of advanced technologies in aircraft manufacturing and air traffic management will also significantly shape the future of the industry.
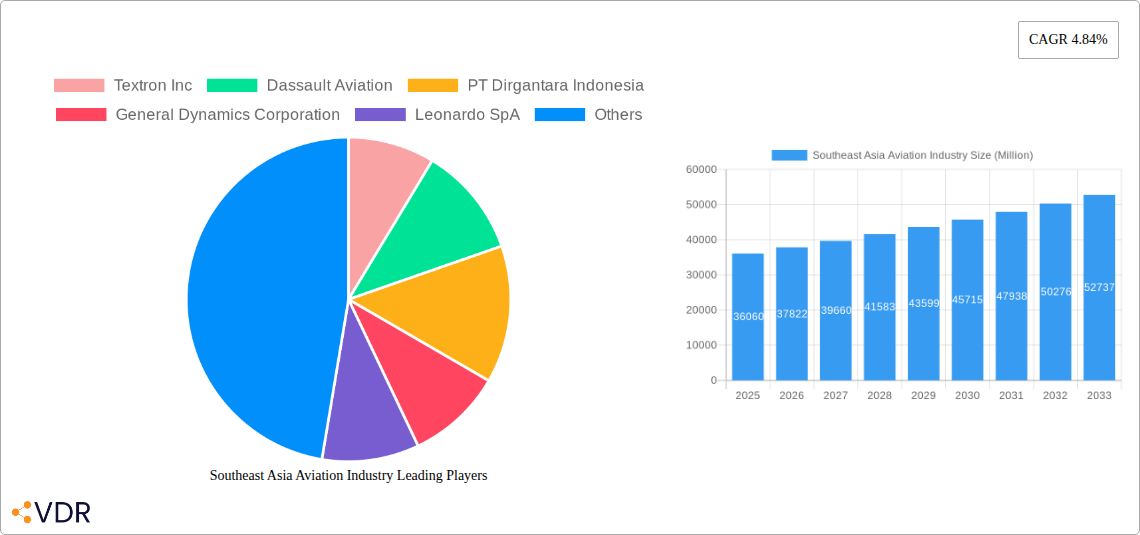
Southeast Asia Aviation Industry Market Size (In Billion)
The competitive landscape is characterized by a mix of global giants such as Boeing and Airbus, alongside regional players like PT Dirgantara Indonesia. These companies are engaged in intense competition to cater to the growing demand for aircraft and associated services. This competition drives innovation, leading to better efficiency and cost-effectiveness in the aviation sector, ultimately benefiting consumers. Further market segmentation reveals strong potential within commercial and general aviation. Commercial aviation will continue to see high demand due to increased passenger traffic, while general aviation will benefit from investments in tourism and infrastructure development. The industry's growth trajectory, while subject to economic fluctuations, projects a promising future for Southeast Asia, promising significant returns for investors and stakeholders alike.
Southeast Asia Aviation Industry Company Market Share
This comprehensive report provides an in-depth analysis of the Southeast Asia aviation industry, covering the period 2019-2033, with a focus on the forecast period 2025-2033 and a base year of 2025. It examines market dynamics, growth trends, key players, and future opportunities across various segments and countries within the region. This report is essential for industry professionals, investors, and policymakers seeking a clear understanding of this rapidly evolving market.
Southeast Asia Aviation Industry Market Dynamics & Structure
The Southeast Asia aviation industry is characterized by a complex interplay of factors influencing its growth and structure. Market concentration is moderate, with a few dominant players alongside numerous smaller regional operators. Technological innovation, driven by advancements in aircraft design, engine technology, and air traffic management systems, is a key growth driver. Stringent regulatory frameworks, varying across countries, impact operational efficiency and expansion plans. The emergence of low-cost carriers presents a competitive challenge to established airlines, while the rising demand for air travel continues to fuel market expansion. The industry also witnesses significant M&A activity, particularly among smaller players seeking to enhance scale and reach.
- Market Concentration: Moderate, with a Herfindahl-Hirschman Index (HHI) estimated at xx in 2025.
- M&A Activity: xx deals valued at xx Million USD recorded between 2019 and 2024.
- Technological Innovation: Focus on fuel efficiency, automation, and enhanced passenger experience.
- Regulatory Framework: Varies significantly across countries, impacting operational costs and expansion.
- Competitive Substitutes: Road and rail transport offer limited competition for long-haul routes.
Southeast Asia Aviation Industry Growth Trends & Insights
The Southeast Asia aviation industry experienced robust growth during the historical period (2019-2024), albeit with disruptions due to the COVID-19 pandemic. The market is projected to rebound strongly, exhibiting a Compound Annual Growth Rate (CAGR) of xx% during the forecast period (2025-2033). This growth is fueled by rising disposable incomes, increasing tourism, and expanding business travel within the region. Technological disruptions, such as the adoption of more fuel-efficient aircraft and advanced air traffic management systems, are contributing to operational efficiency and cost reduction. Furthermore, shifting consumer behavior toward more convenient and affordable travel options is further stimulating demand. Market penetration remains relatively low in certain segments, indicating substantial untapped potential. The total market size is predicted to reach xx Million USD by 2033.
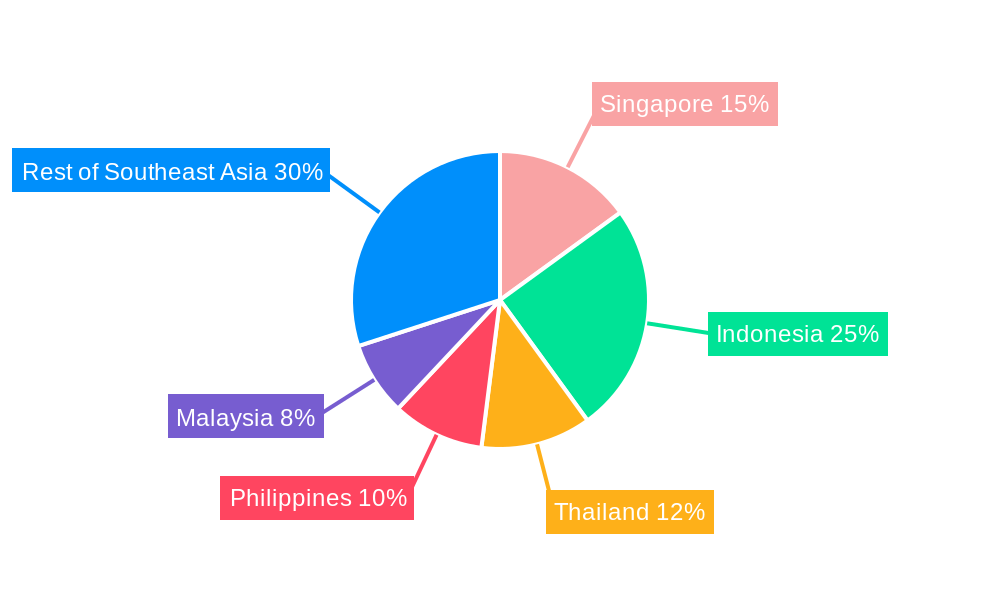
Dominant Regions, Countries, or Segments in Southeast Asia Aviation Industry
Indonesia and Singapore are the dominant markets within the Southeast Asia aviation industry, driven by their large populations, robust economies, and well-developed infrastructure. The commercial aircraft segment holds the largest market share, reflecting the strong growth in passenger air travel. However, the military aircraft segment is expected to show substantial growth, driven by increased defense spending in several countries.
- Leading Country: Indonesia (Market Share: xx% in 2025)
- Fastest Growing Segment: Military Aircraft (CAGR: xx% during 2025-2033)
- Key Drivers in Indonesia: Rapid economic growth, expanding tourism, and government investments in airport infrastructure.
- Key Drivers in Singapore: Strategic location as a regional aviation hub, strong government support, and advanced aviation technology.
Southeast Asia Aviation Industry Product Landscape
The Southeast Asia aviation industry features a diverse product landscape encompassing commercial and military aircraft, as well as general aviation aircraft. Innovation focuses on enhancing fuel efficiency, safety, and passenger comfort. The introduction of new aircraft models with improved aerodynamic designs, advanced avionics, and lighter materials contributes to better operational performance. Unique selling propositions include superior fuel economy, reduced maintenance costs, and enhanced passenger experience.
Key Drivers, Barriers & Challenges in Southeast Asia Aviation Industry
Key Drivers:
- Rapid economic growth and rising disposable incomes across Southeast Asia.
- Increased tourism and business travel.
- Government investments in airport infrastructure development.
- Technological advancements leading to more efficient and cost-effective operations.
Challenges & Restraints:
- Fluctuations in fuel prices impacting operating costs.
- Geopolitical uncertainties and regional conflicts affecting travel demand.
- Regulatory complexities and varying standards across different countries.
- Competition from other modes of transportation.
Emerging Opportunities in Southeast Asia Aviation Industry
- Growth in low-cost carriers offering affordable air travel.
- Increasing demand for air cargo services driven by e-commerce.
- Development of regional air connectivity within Southeast Asia.
- Potential for growth in general aviation and business aviation sectors.
Growth Accelerators in the Southeast Asia Aviation Industry Industry
Technological advancements in aircraft design, engine technology, and air traffic management will significantly accelerate growth. Strategic partnerships between airlines and airport operators will optimize operations and enhance customer experience. Expanding air connectivity through increased route networks and new airport construction will unlock growth potential.
Key Players Shaping the Southeast Asia Aviation Industry Market
- Textron Inc
- Dassault Aviation
- PT Dirgantara Indonesia
- General Dynamics Corporation
- Leonardo SpA
- Lockheed Martin Corporation
- Rostec
- Airbus SE
- Honda Aircraft Company LL
- United Aircraft Corporation
- ATR
- The Boeing Company
Notable Milestones in Southeast Asia Aviation Industry Sector
- 2021-Q4: Airbus secures a large order for new aircraft from a Southeast Asian airline.
- 2022-Q1: Significant investments announced in airport infrastructure development in Indonesia.
- 2023-Q2: Launch of a new low-cost carrier in the Philippines.
- 2024-Q3: Successful implementation of new air traffic management systems in Singapore.
In-Depth Southeast Asia Aviation Industry Market Outlook
The Southeast Asia aviation industry is poised for continued robust growth, driven by sustained economic expansion, increasing tourism, and the adoption of advanced technologies. Significant investment in infrastructure development and strategic partnerships will further enhance the sector’s competitiveness. The industry will also likely see increased consolidation through mergers and acquisitions, leading to a more concentrated market structure. The focus will remain on enhancing operational efficiency, improving passenger experience, and adapting to the evolving regulatory landscape. There is a considerable potential for further expansion within niche segments, such as general aviation and air cargo services.
Southeast Asia Aviation Industry Segmentation
- 1. Production Analysis
- 2. Consumption Analysis
- 3. Import Market Analysis (Value & Volume)
- 4. Export Market Analysis (Value & Volume)
- 5. Price Trend Analysis
Southeast Asia Aviation Industry Segmentation By Geography
-
1. North America
- 1.1. United States
- 1.2. Canada
- 1.3. Mexico
-
2. South America
- 2.1. Brazil
- 2.2. Argentina
- 2.3. Rest of South America
-
3. Europe
- 3.1. United Kingdom
- 3.2. Germany
- 3.3. France
- 3.4. Italy
- 3.5. Spain
- 3.6. Russia
- 3.7. Benelux
- 3.8. Nordics
- 3.9. Rest of Europe
-
4. Middle East & Africa
- 4.1. Turkey
- 4.2. Israel
- 4.3. GCC
- 4.4. North Africa
- 4.5. South Africa
- 4.6. Rest of Middle East & Africa
-
5. Asia Pacific
- 5.1. China
- 5.2. India
- 5.3. Japan
- 5.4. South Korea
- 5.5. ASEAN
- 5.6. Oceania
- 5.7. Rest of Asia Pacific
Southeast Asia Aviation Industry Regional Market Share
Geographic Coverage of Southeast Asia Aviation Industry
Southeast Asia Aviation Industry REPORT HIGHLIGHTS
| Aspects | Details |
|---|---|
| Study Period | 2020-2034 |
| Base Year | 2025 |
| Estimated Year | 2026 |
| Forecast Period | 2026-2034 |
| Historical Period | 2020-2025 |
| Growth Rate | CAGR of 4.84% from 2020-2034 |
| Segmentation |
|
Table of Contents
- 1. Introduction
- 1.1. Research Scope
- 1.2. Market Segmentation
- 1.3. Research Objective
- 1.4. Definitions and Assumptions
- 2. Executive Summary
- 2.1. Market Snapshot
- 3. Market Dynamics
- 3.1. Market Drivers
- 3.2. Market Restrains
- 3.3. Market Trends
- 3.4. Market Opportunities
- 4. Market Factor Analysis
- 4.1. Porters Five Forces
- 4.1.1. Bargaining Power of Suppliers
- 4.1.2. Bargaining Power of Buyers
- 4.1.3. Threat of New Entrants
- 4.1.4. Threat of Substitutes
- 4.1.5. Competitive Rivalry
- 4.2. PESTEL analysis
- 4.3. BCG Analysis
- 4.3.1. Stars (High Growth, High Market Share)
- 4.3.2. Cash Cows (Low Growth, High Market Share)
- 4.3.3. Question Mark (High Growth, Low Market Share)
- 4.3.4. Dogs (Low Growth, Low Market Share)
- 4.4. Ansoff Matrix Analysis
- 4.5. Supply Chain Analysis
- 4.6. Regulatory Landscape
- 4.7. Current Market Potential and Opportunity Assessment (TAM–SAM–SOM Framework)
- 4.8. VDR Analyst Note
- 4.1. Porters Five Forces
- 5. Market Analysis, Insights and Forecast 2021-2033
- 5.1. Market Analysis, Insights and Forecast - by Production Analysis
- 5.2. Market Analysis, Insights and Forecast - by Consumption Analysis
- 5.3. Market Analysis, Insights and Forecast - by Import Market Analysis (Value & Volume)
- 5.4. Market Analysis, Insights and Forecast - by Export Market Analysis (Value & Volume)
- 5.5. Market Analysis, Insights and Forecast - by Price Trend Analysis
- 5.6. Market Analysis, Insights and Forecast - by Region
- 5.6.1. North America
- 5.6.2. South America
- 5.6.3. Europe
- 5.6.4. Middle East & Africa
- 5.6.5. Asia Pacific
- 6. Global Southeast Asia Aviation Industry Analysis, Insights and Forecast, 2021-2033
- 6.1. Market Analysis, Insights and Forecast - by Production Analysis
- 6.2. Market Analysis, Insights and Forecast - by Consumption Analysis
- 6.3. Market Analysis, Insights and Forecast - by Import Market Analysis (Value & Volume)
- 6.4. Market Analysis, Insights and Forecast - by Export Market Analysis (Value & Volume)
- 6.5. Market Analysis, Insights and Forecast - by Price Trend Analysis
- 7. North America Southeast Asia Aviation Industry Analysis, Insights and Forecast, 2021-2033
- 7.1. Market Analysis, Insights and Forecast - by Production Analysis
- 7.2. Market Analysis, Insights and Forecast - by Consumption Analysis
- 7.3. Market Analysis, Insights and Forecast - by Import Market Analysis (Value & Volume)
- 7.4. Market Analysis, Insights and Forecast - by Export Market Analysis (Value & Volume)
- 7.5. Market Analysis, Insights and Forecast - by Price Trend Analysis
- 8. South America Southeast Asia Aviation Industry Analysis, Insights and Forecast, 2021-2033
- 8.1. Market Analysis, Insights and Forecast - by Production Analysis
- 8.2. Market Analysis, Insights and Forecast - by Consumption Analysis
- 8.3. Market Analysis, Insights and Forecast - by Import Market Analysis (Value & Volume)
- 8.4. Market Analysis, Insights and Forecast - by Export Market Analysis (Value & Volume)
- 8.5. Market Analysis, Insights and Forecast - by Price Trend Analysis
- 9. Europe Southeast Asia Aviation Industry Analysis, Insights and Forecast, 2021-2033
- 9.1. Market Analysis, Insights and Forecast - by Production Analysis
- 9.2. Market Analysis, Insights and Forecast - by Consumption Analysis
- 9.3. Market Analysis, Insights and Forecast - by Import Market Analysis (Value & Volume)
- 9.4. Market Analysis, Insights and Forecast - by Export Market Analysis (Value & Volume)
- 9.5. Market Analysis, Insights and Forecast - by Price Trend Analysis
- 10. Middle East & Africa Southeast Asia Aviation Industry Analysis, Insights and Forecast, 2021-2033
- 10.1. Market Analysis, Insights and Forecast - by Production Analysis
- 10.2. Market Analysis, Insights and Forecast - by Consumption Analysis
- 10.3. Market Analysis, Insights and Forecast - by Import Market Analysis (Value & Volume)
- 10.4. Market Analysis, Insights and Forecast - by Export Market Analysis (Value & Volume)
- 10.5. Market Analysis, Insights and Forecast - by Price Trend Analysis
- 11. Asia Pacific Southeast Asia Aviation Industry Analysis, Insights and Forecast, 2021-2033
- 11.1. Market Analysis, Insights and Forecast - by Production Analysis
- 11.2. Market Analysis, Insights and Forecast - by Consumption Analysis
- 11.3. Market Analysis, Insights and Forecast - by Import Market Analysis (Value & Volume)
- 11.4. Market Analysis, Insights and Forecast - by Export Market Analysis (Value & Volume)
- 11.5. Market Analysis, Insights and Forecast - by Price Trend Analysis
- 12. Competitive Analysis
- 12.1. Company Profiles
- 12.1.1 Textron Inc
- 12.1.1.1. Company Overview
- 12.1.1.2. Products
- 12.1.1.3. Company Financials
- 12.1.1.4. SWOT Analysis
- 12.1.2 Dassault Aviation
- 12.1.2.1. Company Overview
- 12.1.2.2. Products
- 12.1.2.3. Company Financials
- 12.1.2.4. SWOT Analysis
- 12.1.3 PT Dirgantara Indonesia
- 12.1.3.1. Company Overview
- 12.1.3.2. Products
- 12.1.3.3. Company Financials
- 12.1.3.4. SWOT Analysis
- 12.1.4 General Dynamics Corporation
- 12.1.4.1. Company Overview
- 12.1.4.2. Products
- 12.1.4.3. Company Financials
- 12.1.4.4. SWOT Analysis
- 12.1.5 Leonardo SpA
- 12.1.5.1. Company Overview
- 12.1.5.2. Products
- 12.1.5.3. Company Financials
- 12.1.5.4. SWOT Analysis
- 12.1.6 Lockheed Martin Corporation
- 12.1.6.1. Company Overview
- 12.1.6.2. Products
- 12.1.6.3. Company Financials
- 12.1.6.4. SWOT Analysis
- 12.1.7 Rostec
- 12.1.7.1. Company Overview
- 12.1.7.2. Products
- 12.1.7.3. Company Financials
- 12.1.7.4. SWOT Analysis
- 12.1.8 Airbus SE
- 12.1.8.1. Company Overview
- 12.1.8.2. Products
- 12.1.8.3. Company Financials
- 12.1.8.4. SWOT Analysis
- 12.1.9 Honda Aircraft Company LL
- 12.1.9.1. Company Overview
- 12.1.9.2. Products
- 12.1.9.3. Company Financials
- 12.1.9.4. SWOT Analysis
- 12.1.10 United Aircraft Corporation
- 12.1.10.1. Company Overview
- 12.1.10.2. Products
- 12.1.10.3. Company Financials
- 12.1.10.4. SWOT Analysis
- 12.1.11 ATR
- 12.1.11.1. Company Overview
- 12.1.11.2. Products
- 12.1.11.3. Company Financials
- 12.1.11.4. SWOT Analysis
- 12.1.12 The Boeing Company
- 12.1.12.1. Company Overview
- 12.1.12.2. Products
- 12.1.12.3. Company Financials
- 12.1.12.4. SWOT Analysis
- 12.1.1 Textron Inc
- 12.2. Market Entropy
- 12.2.1 Company's Key Areas Served
- 12.2.2 Recent Developments
- 12.3. Company Market Share Analysis 2025
- 12.3.1 Top 5 Companies Market Share Analysis
- 12.3.2 Top 3 Companies Market Share Analysis
- 12.4. List of Potential Customers
- 13. Research Methodology
List of Figures
- Figure 1: Global Southeast Asia Aviation Industry Revenue Breakdown (Million, %) by Region 2025 & 2033
- Figure 2: North America Southeast Asia Aviation Industry Revenue (Million), by Production Analysis 2025 & 2033
- Figure 3: North America Southeast Asia Aviation Industry Revenue Share (%), by Production Analysis 2025 & 2033
- Figure 4: North America Southeast Asia Aviation Industry Revenue (Million), by Consumption Analysis 2025 & 2033
- Figure 5: North America Southeast Asia Aviation Industry Revenue Share (%), by Consumption Analysis 2025 & 2033
- Figure 6: North America Southeast Asia Aviation Industry Revenue (Million), by Import Market Analysis (Value & Volume) 2025 & 2033
- Figure 7: North America Southeast Asia Aviation Industry Revenue Share (%), by Import Market Analysis (Value & Volume) 2025 & 2033
- Figure 8: North America Southeast Asia Aviation Industry Revenue (Million), by Export Market Analysis (Value & Volume) 2025 & 2033
- Figure 9: North America Southeast Asia Aviation Industry Revenue Share (%), by Export Market Analysis (Value & Volume) 2025 & 2033
- Figure 10: North America Southeast Asia Aviation Industry Revenue (Million), by Price Trend Analysis 2025 & 2033
- Figure 11: North America Southeast Asia Aviation Industry Revenue Share (%), by Price Trend Analysis 2025 & 2033
- Figure 12: North America Southeast Asia Aviation Industry Revenue (Million), by Country 2025 & 2033
- Figure 13: North America Southeast Asia Aviation Industry Revenue Share (%), by Country 2025 & 2033
- Figure 14: South America Southeast Asia Aviation Industry Revenue (Million), by Production Analysis 2025 & 2033
- Figure 15: South America Southeast Asia Aviation Industry Revenue Share (%), by Production Analysis 2025 & 2033
- Figure 16: South America Southeast Asia Aviation Industry Revenue (Million), by Consumption Analysis 2025 & 2033
- Figure 17: South America Southeast Asia Aviation Industry Revenue Share (%), by Consumption Analysis 2025 & 2033
- Figure 18: South America Southeast Asia Aviation Industry Revenue (Million), by Import Market Analysis (Value & Volume) 2025 & 2033
- Figure 19: South America Southeast Asia Aviation Industry Revenue Share (%), by Import Market Analysis (Value & Volume) 2025 & 2033
- Figure 20: South America Southeast Asia Aviation Industry Revenue (Million), by Export Market Analysis (Value & Volume) 2025 & 2033
- Figure 21: South America Southeast Asia Aviation Industry Revenue Share (%), by Export Market Analysis (Value & Volume) 2025 & 2033
- Figure 22: South America Southeast Asia Aviation Industry Revenue (Million), by Price Trend Analysis 2025 & 2033
- Figure 23: South America Southeast Asia Aviation Industry Revenue Share (%), by Price Trend Analysis 2025 & 2033
- Figure 24: South America Southeast Asia Aviation Industry Revenue (Million), by Country 2025 & 2033
- Figure 25: South America Southeast Asia Aviation Industry Revenue Share (%), by Country 2025 & 2033
- Figure 26: Europe Southeast Asia Aviation Industry Revenue (Million), by Production Analysis 2025 & 2033
- Figure 27: Europe Southeast Asia Aviation Industry Revenue Share (%), by Production Analysis 2025 & 2033
- Figure 28: Europe Southeast Asia Aviation Industry Revenue (Million), by Consumption Analysis 2025 & 2033
- Figure 29: Europe Southeast Asia Aviation Industry Revenue Share (%), by Consumption Analysis 2025 & 2033
- Figure 30: Europe Southeast Asia Aviation Industry Revenue (Million), by Import Market Analysis (Value & Volume) 2025 & 2033
- Figure 31: Europe Southeast Asia Aviation Industry Revenue Share (%), by Import Market Analysis (Value & Volume) 2025 & 2033
- Figure 32: Europe Southeast Asia Aviation Industry Revenue (Million), by Export Market Analysis (Value & Volume) 2025 & 2033
- Figure 33: Europe Southeast Asia Aviation Industry Revenue Share (%), by Export Market Analysis (Value & Volume) 2025 & 2033
- Figure 34: Europe Southeast Asia Aviation Industry Revenue (Million), by Price Trend Analysis 2025 & 2033
- Figure 35: Europe Southeast Asia Aviation Industry Revenue Share (%), by Price Trend Analysis 2025 & 2033
- Figure 36: Europe Southeast Asia Aviation Industry Revenue (Million), by Country 2025 & 2033
- Figure 37: Europe Southeast Asia Aviation Industry Revenue Share (%), by Country 2025 & 2033
- Figure 38: Middle East & Africa Southeast Asia Aviation Industry Revenue (Million), by Production Analysis 2025 & 2033
- Figure 39: Middle East & Africa Southeast Asia Aviation Industry Revenue Share (%), by Production Analysis 2025 & 2033
- Figure 40: Middle East & Africa Southeast Asia Aviation Industry Revenue (Million), by Consumption Analysis 2025 & 2033
- Figure 41: Middle East & Africa Southeast Asia Aviation Industry Revenue Share (%), by Consumption Analysis 2025 & 2033
- Figure 42: Middle East & Africa Southeast Asia Aviation Industry Revenue (Million), by Import Market Analysis (Value & Volume) 2025 & 2033
- Figure 43: Middle East & Africa Southeast Asia Aviation Industry Revenue Share (%), by Import Market Analysis (Value & Volume) 2025 & 2033
- Figure 44: Middle East & Africa Southeast Asia Aviation Industry Revenue (Million), by Export Market Analysis (Value & Volume) 2025 & 2033
- Figure 45: Middle East & Africa Southeast Asia Aviation Industry Revenue Share (%), by Export Market Analysis (Value & Volume) 2025 & 2033
- Figure 46: Middle East & Africa Southeast Asia Aviation Industry Revenue (Million), by Price Trend Analysis 2025 & 2033
- Figure 47: Middle East & Africa Southeast Asia Aviation Industry Revenue Share (%), by Price Trend Analysis 2025 & 2033
- Figure 48: Middle East & Africa Southeast Asia Aviation Industry Revenue (Million), by Country 2025 & 2033
- Figure 49: Middle East & Africa Southeast Asia Aviation Industry Revenue Share (%), by Country 2025 & 2033
- Figure 50: Asia Pacific Southeast Asia Aviation Industry Revenue (Million), by Production Analysis 2025 & 2033
- Figure 51: Asia Pacific Southeast Asia Aviation Industry Revenue Share (%), by Production Analysis 2025 & 2033
- Figure 52: Asia Pacific Southeast Asia Aviation Industry Revenue (Million), by Consumption Analysis 2025 & 2033
- Figure 53: Asia Pacific Southeast Asia Aviation Industry Revenue Share (%), by Consumption Analysis 2025 & 2033
- Figure 54: Asia Pacific Southeast Asia Aviation Industry Revenue (Million), by Import Market Analysis (Value & Volume) 2025 & 2033
- Figure 55: Asia Pacific Southeast Asia Aviation Industry Revenue Share (%), by Import Market Analysis (Value & Volume) 2025 & 2033
- Figure 56: Asia Pacific Southeast Asia Aviation Industry Revenue (Million), by Export Market Analysis (Value & Volume) 2025 & 2033
- Figure 57: Asia Pacific Southeast Asia Aviation Industry Revenue Share (%), by Export Market Analysis (Value & Volume) 2025 & 2033
- Figure 58: Asia Pacific Southeast Asia Aviation Industry Revenue (Million), by Price Trend Analysis 2025 & 2033
- Figure 59: Asia Pacific Southeast Asia Aviation Industry Revenue Share (%), by Price Trend Analysis 2025 & 2033
- Figure 60: Asia Pacific Southeast Asia Aviation Industry Revenue (Million), by Country 2025 & 2033
- Figure 61: Asia Pacific Southeast Asia Aviation Industry Revenue Share (%), by Country 2025 & 2033
List of Tables
- Table 1: Global Southeast Asia Aviation Industry Revenue Million Forecast, by Production Analysis 2020 & 2033
- Table 2: Global Southeast Asia Aviation Industry Revenue Million Forecast, by Consumption Analysis 2020 & 2033
- Table 3: Global Southeast Asia Aviation Industry Revenue Million Forecast, by Import Market Analysis (Value & Volume) 2020 & 2033
- Table 4: Global Southeast Asia Aviation Industry Revenue Million Forecast, by Export Market Analysis (Value & Volume) 2020 & 2033
- Table 5: Global Southeast Asia Aviation Industry Revenue Million Forecast, by Price Trend Analysis 2020 & 2033
- Table 6: Global Southeast Asia Aviation Industry Revenue Million Forecast, by Region 2020 & 2033
- Table 7: Global Southeast Asia Aviation Industry Revenue Million Forecast, by Production Analysis 2020 & 2033
- Table 8: Global Southeast Asia Aviation Industry Revenue Million Forecast, by Consumption Analysis 2020 & 2033
- Table 9: Global Southeast Asia Aviation Industry Revenue Million Forecast, by Import Market Analysis (Value & Volume) 2020 & 2033
- Table 10: Global Southeast Asia Aviation Industry Revenue Million Forecast, by Export Market Analysis (Value & Volume) 2020 & 2033
- Table 11: Global Southeast Asia Aviation Industry Revenue Million Forecast, by Price Trend Analysis 2020 & 2033
- Table 12: Global Southeast Asia Aviation Industry Revenue Million Forecast, by Country 2020 & 2033
- Table 13: United States Southeast Asia Aviation Industry Revenue (Million) Forecast, by Application 2020 & 2033
- Table 14: Canada Southeast Asia Aviation Industry Revenue (Million) Forecast, by Application 2020 & 2033
- Table 15: Mexico Southeast Asia Aviation Industry Revenue (Million) Forecast, by Application 2020 & 2033
- Table 16: Global Southeast Asia Aviation Industry Revenue Million Forecast, by Production Analysis 2020 & 2033
- Table 17: Global Southeast Asia Aviation Industry Revenue Million Forecast, by Consumption Analysis 2020 & 2033
- Table 18: Global Southeast Asia Aviation Industry Revenue Million Forecast, by Import Market Analysis (Value & Volume) 2020 & 2033
- Table 19: Global Southeast Asia Aviation Industry Revenue Million Forecast, by Export Market Analysis (Value & Volume) 2020 & 2033
- Table 20: Global Southeast Asia Aviation Industry Revenue Million Forecast, by Price Trend Analysis 2020 & 2033
- Table 21: Global Southeast Asia Aviation Industry Revenue Million Forecast, by Country 2020 & 2033
- Table 22: Brazil Southeast Asia Aviation Industry Revenue (Million) Forecast, by Application 2020 & 2033
- Table 23: Argentina Southeast Asia Aviation Industry Revenue (Million) Forecast, by Application 2020 & 2033
- Table 24: Rest of South America Southeast Asia Aviation Industry Revenue (Million) Forecast, by Application 2020 & 2033
- Table 25: Global Southeast Asia Aviation Industry Revenue Million Forecast, by Production Analysis 2020 & 2033
- Table 26: Global Southeast Asia Aviation Industry Revenue Million Forecast, by Consumption Analysis 2020 & 2033
- Table 27: Global Southeast Asia Aviation Industry Revenue Million Forecast, by Import Market Analysis (Value & Volume) 2020 & 2033
- Table 28: Global Southeast Asia Aviation Industry Revenue Million Forecast, by Export Market Analysis (Value & Volume) 2020 & 2033
- Table 29: Global Southeast Asia Aviation Industry Revenue Million Forecast, by Price Trend Analysis 2020 & 2033
- Table 30: Global Southeast Asia Aviation Industry Revenue Million Forecast, by Country 2020 & 2033
- Table 31: United Kingdom Southeast Asia Aviation Industry Revenue (Million) Forecast, by Application 2020 & 2033
- Table 32: Germany Southeast Asia Aviation Industry Revenue (Million) Forecast, by Application 2020 & 2033
- Table 33: France Southeast Asia Aviation Industry Revenue (Million) Forecast, by Application 2020 & 2033
- Table 34: Italy Southeast Asia Aviation Industry Revenue (Million) Forecast, by Application 2020 & 2033
- Table 35: Spain Southeast Asia Aviation Industry Revenue (Million) Forecast, by Application 2020 & 2033
- Table 36: Russia Southeast Asia Aviation Industry Revenue (Million) Forecast, by Application 2020 & 2033
- Table 37: Benelux Southeast Asia Aviation Industry Revenue (Million) Forecast, by Application 2020 & 2033
- Table 38: Nordics Southeast Asia Aviation Industry Revenue (Million) Forecast, by Application 2020 & 2033
- Table 39: Rest of Europe Southeast Asia Aviation Industry Revenue (Million) Forecast, by Application 2020 & 2033
- Table 40: Global Southeast Asia Aviation Industry Revenue Million Forecast, by Production Analysis 2020 & 2033
- Table 41: Global Southeast Asia Aviation Industry Revenue Million Forecast, by Consumption Analysis 2020 & 2033
- Table 42: Global Southeast Asia Aviation Industry Revenue Million Forecast, by Import Market Analysis (Value & Volume) 2020 & 2033
- Table 43: Global Southeast Asia Aviation Industry Revenue Million Forecast, by Export Market Analysis (Value & Volume) 2020 & 2033
- Table 44: Global Southeast Asia Aviation Industry Revenue Million Forecast, by Price Trend Analysis 2020 & 2033
- Table 45: Global Southeast Asia Aviation Industry Revenue Million Forecast, by Country 2020 & 2033
- Table 46: Turkey Southeast Asia Aviation Industry Revenue (Million) Forecast, by Application 2020 & 2033
- Table 47: Israel Southeast Asia Aviation Industry Revenue (Million) Forecast, by Application 2020 & 2033
- Table 48: GCC Southeast Asia Aviation Industry Revenue (Million) Forecast, by Application 2020 & 2033
- Table 49: North Africa Southeast Asia Aviation Industry Revenue (Million) Forecast, by Application 2020 & 2033
- Table 50: South Africa Southeast Asia Aviation Industry Revenue (Million) Forecast, by Application 2020 & 2033
- Table 51: Rest of Middle East & Africa Southeast Asia Aviation Industry Revenue (Million) Forecast, by Application 2020 & 2033
- Table 52: Global Southeast Asia Aviation Industry Revenue Million Forecast, by Production Analysis 2020 & 2033
- Table 53: Global Southeast Asia Aviation Industry Revenue Million Forecast, by Consumption Analysis 2020 & 2033
- Table 54: Global Southeast Asia Aviation Industry Revenue Million Forecast, by Import Market Analysis (Value & Volume) 2020 & 2033
- Table 55: Global Southeast Asia Aviation Industry Revenue Million Forecast, by Export Market Analysis (Value & Volume) 2020 & 2033
- Table 56: Global Southeast Asia Aviation Industry Revenue Million Forecast, by Price Trend Analysis 2020 & 2033
- Table 57: Global Southeast Asia Aviation Industry Revenue Million Forecast, by Country 2020 & 2033
- Table 58: China Southeast Asia Aviation Industry Revenue (Million) Forecast, by Application 2020 & 2033
- Table 59: India Southeast Asia Aviation Industry Revenue (Million) Forecast, by Application 2020 & 2033
- Table 60: Japan Southeast Asia Aviation Industry Revenue (Million) Forecast, by Application 2020 & 2033
- Table 61: South Korea Southeast Asia Aviation Industry Revenue (Million) Forecast, by Application 2020 & 2033
- Table 62: ASEAN Southeast Asia Aviation Industry Revenue (Million) Forecast, by Application 2020 & 2033
- Table 63: Oceania Southeast Asia Aviation Industry Revenue (Million) Forecast, by Application 2020 & 2033
- Table 64: Rest of Asia Pacific Southeast Asia Aviation Industry Revenue (Million) Forecast, by Application 2020 & 2033
Frequently Asked Questions
1. What is the projected Compound Annual Growth Rate (CAGR) of the Southeast Asia Aviation Industry?
The projected CAGR is approximately 4.84%.
2. Which companies are prominent players in the Southeast Asia Aviation Industry?
Key companies in the market include Textron Inc, Dassault Aviation, PT Dirgantara Indonesia, General Dynamics Corporation, Leonardo SpA, Lockheed Martin Corporation, Rostec, Airbus SE, Honda Aircraft Company LL, United Aircraft Corporation, ATR, The Boeing Company.
3. What are the main segments of the Southeast Asia Aviation Industry?
The market segments include Production Analysis, Consumption Analysis, Import Market Analysis (Value & Volume), Export Market Analysis (Value & Volume), Price Trend Analysis.
4. Can you provide details about the market size?
The market size is estimated to be USD 36.06 Million as of 2022.
5. What are some drivers contributing to market growth?
Increase in Internet of Things (IoT) and Autonomous Systems; Rise in Demand for Military and Defense Satellite Communication Solutions.
6. What are the notable trends driving market growth?
The Commercial Aircraft Segment is Expected to Dominate the Market.
7. Are there any restraints impacting market growth?
Cybersecurity Threats to Satellite Communication; Interference in Transmission of Data.
8. Can you provide examples of recent developments in the market?
N/A
9. What pricing options are available for accessing the report?
Pricing options include single-user, multi-user, and enterprise licenses priced at USD 4750, USD 5250, and USD 8750 respectively.
10. Is the market size provided in terms of value or volume?
The market size is provided in terms of value, measured in Million.
11. Are there any specific market keywords associated with the report?
Yes, the market keyword associated with the report is "Southeast Asia Aviation Industry," which aids in identifying and referencing the specific market segment covered.
12. How do I determine which pricing option suits my needs best?
The pricing options vary based on user requirements and access needs. Individual users may opt for single-user licenses, while businesses requiring broader access may choose multi-user or enterprise licenses for cost-effective access to the report.
13. Are there any additional resources or data provided in the Southeast Asia Aviation Industry report?
While the report offers comprehensive insights, it's advisable to review the specific contents or supplementary materials provided to ascertain if additional resources or data are available.
14. How can I stay updated on further developments or reports in the Southeast Asia Aviation Industry?
To stay informed about further developments, trends, and reports in the Southeast Asia Aviation Industry, consider subscribing to industry newsletters, following relevant companies and organizations, or regularly checking reputable industry news sources and publications.
Methodology
Step 1 - Identification of Relevant Samples Size from Population Database


Step 2 - Approaches for Defining Global Market Size (Value, Volume* & Price*)

Note*: In applicable scenarios
Step 3 - Data Sources
Primary Research
- Web Analytics
- Survey Reports
- Research Institute
- Latest Research Reports
- Opinion Leaders
Secondary Research
- Annual Reports
- White Paper
- Latest Press Release
- Industry Association
- Paid Database
- Investor Presentations

Step 4 - Data Triangulation
Involves using different sources of information in order to increase the validity of a study
These sources are likely to be stakeholders in a program - participants, other researchers, program staff, other community members, and so on.
Then we put all data in single framework & apply various statistical tools to find out the dynamic on the market.
During the analysis stage, feedback from the stakeholder groups would be compared to determine areas of agreement as well as areas of divergence