Strategic Insights into Sodium Ion Battery Market Market Trends

Sodium Ion Battery Market by Application (Stationary Energy Storage, Transportation), by North America (United States of America, Canada, Rest of the North America), by Europe (United Kingdom, Germany, France, Italy, Rest of the Europe), by Asia Pacific (China, India, Japan, Rest of the Asia Pacific), by South America (Brazil, Argentina, Rest of the South America), by Middle East and Africa (United Arab Emirates, Saudi Arabia, South Africa, Rest of the Middle East and Africa) Forecast 2025-2033

Jul 1 2025
Base Year: 2024

234 Pages
Main Logo

Strategic Insights into Sodium Ion Battery Market Market Trends


Home
Industries
Energy & Power
sponsor image
sponsor image
sponsor image
sponsor image
sponsor image

Tailored for you

  • In-depth Analysis Tailored to Specified Regions or Segments
  • Company Profiles Customized to User Preferences
  • Comprehensive Insights Focused on Specific Segments or Regions
  • Customized Evaluation of Competitive Landscape to Meet Your Needs
  • Tailored Customization to Address Other Specific Requirements
Ask for customization


Key Insights

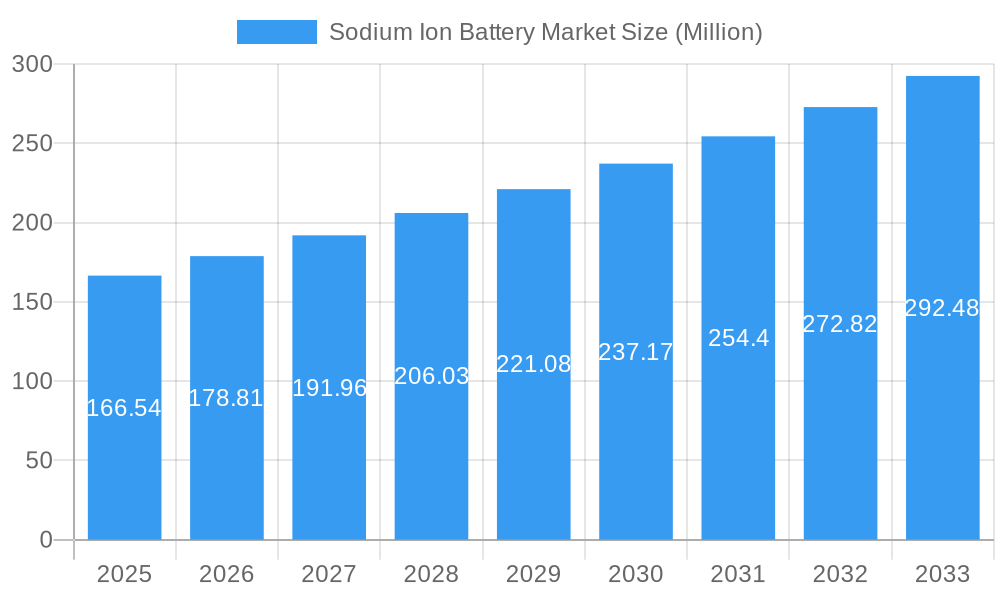
The Sodium Ion Battery market is poised for significant growth, projected to reach \$166.54 million in 2025 and exhibiting a robust Compound Annual Growth Rate (CAGR) of 7.28% from 2025 to 2033. This expansion is driven by several key factors. The increasing demand for sustainable energy storage solutions in stationary applications, such as grid-scale energy storage and backup power systems, is a primary driver. Furthermore, the burgeoning electric vehicle (EV) market is fueling demand for cost-effective and high-performance batteries, creating a significant opportunity for sodium-ion technology. Sodium's abundance and lower cost compared to lithium present a compelling advantage, making sodium-ion batteries a competitive alternative, particularly in large-scale applications where cost is a critical factor. Technological advancements focusing on improving energy density, cycle life, and safety are also contributing to market growth. While challenges remain in terms of energy density compared to lithium-ion batteries, ongoing research and development efforts are steadily addressing these limitations. The market segmentation reveals a strong focus on both stationary energy storage and transportation sectors, with geographical distribution spanning North America, Europe, Asia-Pacific, South America, and the Middle East & Africa. Established players like Contemporary Amperex Technology Co Limited and emerging companies like Natron Energy Inc are actively shaping the market landscape through innovation and strategic partnerships.
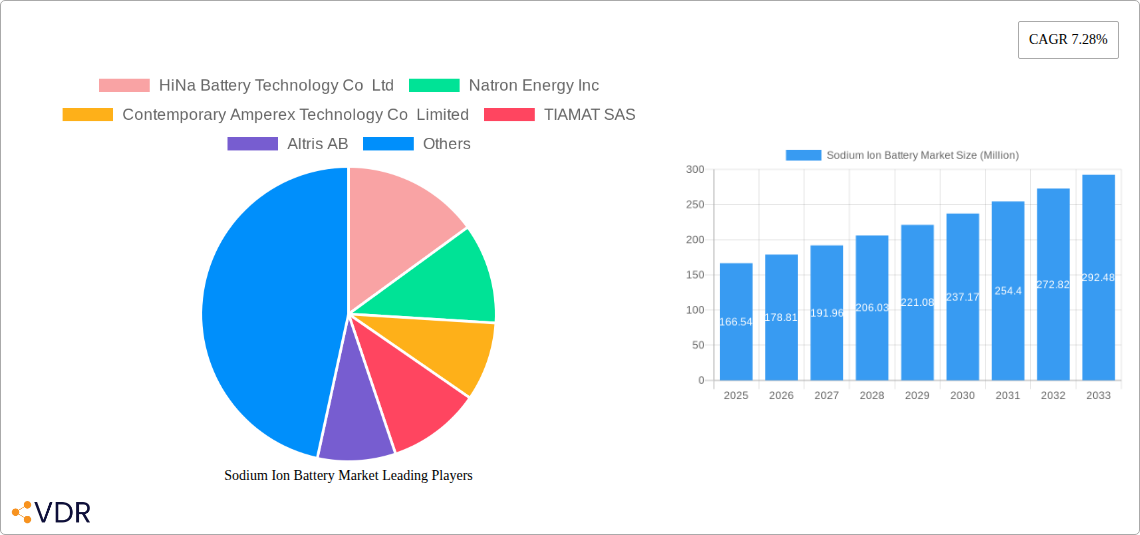
The geographical distribution of the Sodium Ion Battery market reflects the global focus on renewable energy integration and electric vehicle adoption. Asia-Pacific, particularly China, is expected to be a dominant region due to its substantial manufacturing base and significant investments in renewable energy infrastructure. North America and Europe also present substantial growth potential, driven by government policies promoting clean energy and the increasing adoption of electric vehicles. The competitive landscape is characterized by a mix of established players and innovative startups, leading to increased competition and driving further advancements in sodium-ion battery technology. The forecast period of 2025-2033 is anticipated to witness a steady increase in market size as technology matures and adoption rates across various applications rise, creating a lucrative market for both investors and technology providers. The long-term outlook for sodium-ion batteries is positive, driven by the need for sustainable and cost-effective energy storage solutions to address the global energy transition.

Sodium Ion Battery Market Research Report - Market Size, Growth & Forecast

Sodium Ion Battery Market: A Comprehensive Report (2019-2033)

This in-depth report provides a comprehensive analysis of the Sodium Ion Battery Market, encompassing market dynamics, growth trends, regional analysis, product landscape, key players, and future outlook. The study period covers 2019-2033, with 2025 as the base year and a forecast period of 2025-2033. The market size is presented in million units.

Sodium Ion Battery Market Dynamics & Structure

This section analyzes the intricate dynamics shaping the Sodium Ion Battery market, examining market concentration, technological advancements, regulatory landscapes, competitive pressures from substitute products, end-user demographics, and mergers & acquisitions (M&A) activities. The analysis integrates both quantitative data (market share, M&A deal volume: xx) and qualitative factors (innovation barriers, regulatory hurdles).

  • Market Concentration: The market exhibits a (xx)% concentration ratio, with (xx) players holding a significant share. This is expected to (increase/decrease) to (xx)% by 2033 due to (mention reasons).
  • Technological Innovation: Ongoing R&D efforts focused on (mention specific technological improvements) are driving market growth. However, challenges remain in (mention specific technological limitations).
  • Regulatory Frameworks: Government policies supporting (mention specific supportive policies) are boosting market expansion, while (mention specific regulatory challenges) pose hurdles.
  • Competitive Landscape: The emergence of (mention emerging technologies) poses a competitive threat, while the cost advantage of sodium-ion batteries over (mention competing battery technologies) is a key strength.
  • M&A Activity: The market has witnessed (xx) M&A deals in the past five years, reflecting (explain the impact of M&A activities on the market).

Sodium Ion Battery Market Growth Trends & Insights

This section provides a detailed analysis of the Sodium Ion Battery market's growth trajectory, incorporating historical data (2019-2024) and projections (2025-2033). We examine market size evolution, adoption rates across various sectors, technological disruptions, and shifts in consumer behavior. Specific metrics, including the Compound Annual Growth Rate (CAGR), market penetration rates, and regional variations, offer deeper insights. The analysis leverages (XXX - specify data source or methodology) to provide comprehensive market sizing and forecasting. The market is expected to grow at a CAGR of xx% from 2025 to 2033, reaching a projected market size of xx million units by 2033. This growth is primarily driven by (mention key drivers - e.g., increasing demand for energy storage, government incentives).

Sodium Ion Battery Market Growth

Dominant Regions, Countries, or Segments in Sodium Ion Battery Market

This section pinpoints the leading geographical regions and application segments (Stationary Energy Storage and Transportation) driving market expansion. A detailed analysis of market share, growth potential, and influencing factors (economic policies, infrastructure development) is provided.

  • Transportation Segment: This segment is projected to dominate the market, driven by the increasing adoption of electric vehicles and the cost-effectiveness of sodium-ion batteries in compact electric vehicles.
  • Stationary Energy Storage Segment: This segment is expected to experience substantial growth due to (mention reasons, e.g., increasing demand for renewable energy storage).
  • Dominant Regions: (Specify leading regions and countries - e.g., China, Europe, North America) are leading the market due to (mention specific factors, e.g., favorable government policies, robust manufacturing infrastructure).

Sodium Ion Battery Market Product Landscape

Sodium-ion batteries are characterized by their cost-effectiveness and suitability for various applications. Ongoing innovation focuses on enhancing energy density, cycle life, and safety features. Unique selling propositions include their lower material costs compared to lithium-ion batteries, making them a compelling alternative for large-scale energy storage and certain transportation applications.

Key Drivers, Barriers & Challenges in Sodium Ion Battery Market

Key Drivers:

  • Falling raw material costs.
  • Growing demand for affordable energy storage solutions.
  • Government support for renewable energy integration.
  • Technological advancements improving battery performance.

Key Challenges & Restraints:

  • Lower energy density compared to lithium-ion batteries.
  • Potential supply chain disruptions for raw materials.
  • Need for improved battery lifecycle management.
  • Competition from other battery technologies.

Emerging Opportunities in Sodium Ion Battery Market

Emerging opportunities include expansion into new applications (e.g., grid-scale energy storage, off-grid power systems), further development of high-energy-density sodium-ion battery chemistries, and collaborations with automotive manufacturers. Untapped markets in developing economies present significant growth potential.

Growth Accelerators in the Sodium Ion Battery Market Industry

Technological breakthroughs in cathode materials and electrolyte formulations are crucial growth catalysts. Strategic partnerships between battery manufacturers and automotive companies or energy storage providers are accelerating market penetration. Market expansion strategies focused on developing regions and emerging applications are also vital.

Key Players Shaping the Sodium Ion Battery Market Market

  • HiNa Battery Technology Co Ltd
  • Natron Energy Inc
  • Contemporary Amperex Technology Co Limited
  • TIAMAT SAS
  • Altris AB
  • AMTE Power PLC
  • Faradion Limited
  • NGK Insulators Ltd

Notable Milestones in Sodium Ion Battery Market Sector

  • June 2023: FinDreams (BYD) and Huaihai Holding Group partner to supply sodium-ion batteries for compact electric vehicles.
  • May 2022: Natron Energy and Clarios International announce a strategic agreement to manufacture sodium-ion batteries, aiming for a 600MW production capacity by 2023 at the Clarios Meadowbrook facility.

In-Depth Sodium Ion Battery Market Market Outlook

The Sodium Ion Battery market is poised for significant growth driven by technological advancements, strategic collaborations, and increasing demand for cost-effective energy storage solutions. The market's future potential is substantial, particularly in the transportation and stationary energy storage sectors. Companies adopting proactive strategies to address the challenges and capitalize on emerging opportunities are well-positioned for success in this rapidly evolving market.

Sodium Ion Battery Market Segmentation

  • 1. Application
    • 1.1. Stationary Energy Storage
    • 1.2. Transportation

Sodium Ion Battery Market Segmentation By Geography

  • 1. North America
    • 1.1. United States of America
    • 1.2. Canada
    • 1.3. Rest of the North America
  • 2. Europe
    • 2.1. United Kingdom
    • 2.2. Germany
    • 2.3. France
    • 2.4. Italy
    • 2.5. Rest of the Europe
  • 3. Asia Pacific
    • 3.1. China
    • 3.2. India
    • 3.3. Japan
    • 3.4. Rest of the Asia Pacific
  • 4. South America
    • 4.1. Brazil
    • 4.2. Argentina
    • 4.3. Rest of the South America
  • 5. Middle East and Africa
    • 5.1. United Arab Emirates
    • 5.2. Saudi Arabia
    • 5.3. South Africa
    • 5.4. Rest of the Middle East and Africa
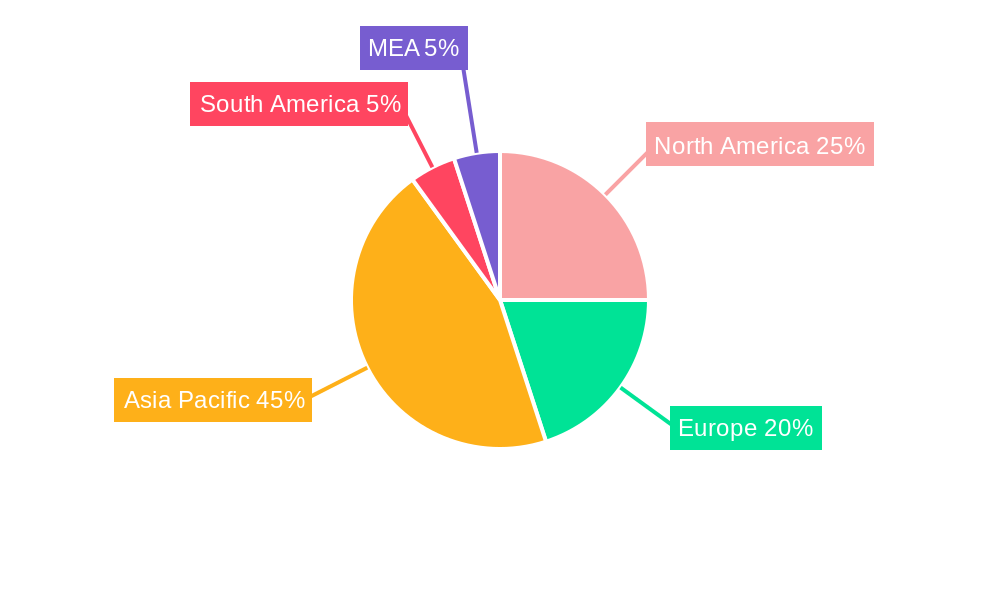
Sodium Ion Battery Market Regional Share


Sodium Ion Battery Market REPORT HIGHLIGHTS

AspectsDetails
Study Period 2019-2033
Base Year 2024
Estimated Year 2025
Forecast Period2025-2033
Historical Period2019-2024
Growth RateCAGR of 7.28% from 2019-2033
Segmentation
    • By Application
      • Stationary Energy Storage
      • Transportation
  • By Geography
    • North America
      • United States of America
      • Canada
      • Rest of the North America
    • Europe
      • United Kingdom
      • Germany
      • France
      • Italy
      • Rest of the Europe
    • Asia Pacific
      • China
      • India
      • Japan
      • Rest of the Asia Pacific
    • South America
      • Brazil
      • Argentina
      • Rest of the South America
    • Middle East and Africa
      • United Arab Emirates
      • Saudi Arabia
      • South Africa
      • Rest of the Middle East and Africa


Table of Contents

  1. 1. Introduction
    • 1.1. Research Scope
    • 1.2. Market Segmentation
    • 1.3. Research Methodology
    • 1.4. Definitions and Assumptions
  2. 2. Executive Summary
    • 2.1. Introduction
  3. 3. Market Dynamics
    • 3.1. Introduction
      • 3.2. Market Drivers
        • 3.2.1. 4.; The Increasing Demand for Cleaner Energy4.; Increasing Adoption of Sodium-Ion Batteries for Energy Storage Systems
      • 3.3. Market Restrains
        • 3.3.1. 4.; Availability of Technical Constraints
      • 3.4. Market Trends
        • 3.4.1. Stationary Energy Storage is a Significant Segment for the Market
  4. 4. Market Factor Analysis
    • 4.1. Porters Five Forces
    • 4.2. Supply/Value Chain
    • 4.3. PESTEL analysis
    • 4.4. Market Entropy
    • 4.5. Patent/Trademark Analysis
  5. 5. Global Sodium Ion Battery Market Analysis, Insights and Forecast, 2019-2031
    • 5.1. Market Analysis, Insights and Forecast - by Application
      • 5.1.1. Stationary Energy Storage
      • 5.1.2. Transportation
    • 5.2. Market Analysis, Insights and Forecast - by Region
      • 5.2.1. North America
      • 5.2.2. Europe
      • 5.2.3. Asia Pacific
      • 5.2.4. South America
      • 5.2.5. Middle East and Africa
  6. 6. North America Sodium Ion Battery Market Analysis, Insights and Forecast, 2019-2031
    • 6.1. Market Analysis, Insights and Forecast - by Application
      • 6.1.1. Stationary Energy Storage
      • 6.1.2. Transportation
  7. 7. Europe Sodium Ion Battery Market Analysis, Insights and Forecast, 2019-2031
    • 7.1. Market Analysis, Insights and Forecast - by Application
      • 7.1.1. Stationary Energy Storage
      • 7.1.2. Transportation
  8. 8. Asia Pacific Sodium Ion Battery Market Analysis, Insights and Forecast, 2019-2031
    • 8.1. Market Analysis, Insights and Forecast - by Application
      • 8.1.1. Stationary Energy Storage
      • 8.1.2. Transportation
  9. 9. South America Sodium Ion Battery Market Analysis, Insights and Forecast, 2019-2031
    • 9.1. Market Analysis, Insights and Forecast - by Application
      • 9.1.1. Stationary Energy Storage
      • 9.1.2. Transportation
  10. 10. Middle East and Africa Sodium Ion Battery Market Analysis, Insights and Forecast, 2019-2031
    • 10.1. Market Analysis, Insights and Forecast - by Application
      • 10.1.1. Stationary Energy Storage
      • 10.1.2. Transportation
  11. 11. North America Sodium Ion Battery Market Analysis, Insights and Forecast, 2019-2031
      • 11.1. Market Analysis, Insights and Forecast - By Country/Sub-region
        • 11.1.1 United States
        • 11.1.2 Canada
        • 11.1.3 Mexico
  12. 12. Europe Sodium Ion Battery Market Analysis, Insights and Forecast, 2019-2031
      • 12.1. Market Analysis, Insights and Forecast - By Country/Sub-region
        • 12.1.1 Germany
        • 12.1.2 United Kingdom
        • 12.1.3 France
        • 12.1.4 Spain
        • 12.1.5 Italy
        • 12.1.6 Spain
        • 12.1.7 Belgium
        • 12.1.8 Netherland
        • 12.1.9 Nordics
        • 12.1.10 Rest of Europe
  13. 13. Asia Pacific Sodium Ion Battery Market Analysis, Insights and Forecast, 2019-2031
      • 13.1. Market Analysis, Insights and Forecast - By Country/Sub-region
        • 13.1.1 China
        • 13.1.2 Japan
        • 13.1.3 India
        • 13.1.4 South Korea
        • 13.1.5 Southeast Asia
        • 13.1.6 Australia
        • 13.1.7 Indonesia
        • 13.1.8 Phillipes
        • 13.1.9 Singapore
        • 13.1.10 Thailandc
        • 13.1.11 Rest of Asia Pacific
  14. 14. South America Sodium Ion Battery Market Analysis, Insights and Forecast, 2019-2031
      • 14.1. Market Analysis, Insights and Forecast - By Country/Sub-region
        • 14.1.1 Brazil
        • 14.1.2 Argentina
        • 14.1.3 Peru
        • 14.1.4 Chile
        • 14.1.5 Colombia
        • 14.1.6 Ecuador
        • 14.1.7 Venezuela
        • 14.1.8 Rest of South America
  15. 15. North America Sodium Ion Battery Market Analysis, Insights and Forecast, 2019-2031
      • 15.1. Market Analysis, Insights and Forecast - By Country/Sub-region
        • 15.1.1 United States
        • 15.1.2 Canada
        • 15.1.3 Mexico
  16. 16. MEA Sodium Ion Battery Market Analysis, Insights and Forecast, 2019-2031
      • 16.1. Market Analysis, Insights and Forecast - By Country/Sub-region
        • 16.1.1 United Arab Emirates
        • 16.1.2 Saudi Arabia
        • 16.1.3 South Africa
        • 16.1.4 Rest of Middle East and Africa
  17. 17. Competitive Analysis
    • 17.1. Global Market Share Analysis 2024
      • 17.2. Company Profiles
        • 17.2.1 HiNa Battery Technology Co Ltd
          • 17.2.1.1. Overview
          • 17.2.1.2. Products
          • 17.2.1.3. SWOT Analysis
          • 17.2.1.4. Recent Developments
          • 17.2.1.5. Financials (Based on Availability)
        • 17.2.2 Natron Energy Inc
          • 17.2.2.1. Overview
          • 17.2.2.2. Products
          • 17.2.2.3. SWOT Analysis
          • 17.2.2.4. Recent Developments
          • 17.2.2.5. Financials (Based on Availability)
        • 17.2.3 Contemporary Amperex Technology Co Limited
          • 17.2.3.1. Overview
          • 17.2.3.2. Products
          • 17.2.3.3. SWOT Analysis
          • 17.2.3.4. Recent Developments
          • 17.2.3.5. Financials (Based on Availability)
        • 17.2.4 TIAMAT SAS
          • 17.2.4.1. Overview
          • 17.2.4.2. Products
          • 17.2.4.3. SWOT Analysis
          • 17.2.4.4. Recent Developments
          • 17.2.4.5. Financials (Based on Availability)
        • 17.2.5 Altris AB
          • 17.2.5.1. Overview
          • 17.2.5.2. Products
          • 17.2.5.3. SWOT Analysis
          • 17.2.5.4. Recent Developments
          • 17.2.5.5. Financials (Based on Availability)
        • 17.2.6 AMTE Power PLC
          • 17.2.6.1. Overview
          • 17.2.6.2. Products
          • 17.2.6.3. SWOT Analysis
          • 17.2.6.4. Recent Developments
          • 17.2.6.5. Financials (Based on Availability)
        • 17.2.7 Faradion Limited
          • 17.2.7.1. Overview
          • 17.2.7.2. Products
          • 17.2.7.3. SWOT Analysis
          • 17.2.7.4. Recent Developments
          • 17.2.7.5. Financials (Based on Availability)
        • 17.2.8 NGK Insulators Ltd
          • 17.2.8.1. Overview
          • 17.2.8.2. Products
          • 17.2.8.3. SWOT Analysis
          • 17.2.8.4. Recent Developments
          • 17.2.8.5. Financials (Based on Availability)

List of Figures

  1. Figure 1: Global Sodium Ion Battery Market Revenue Breakdown (Million, %) by Region 2024 & 2032
  2. Figure 2: Global Sodium Ion Battery Market Volume Breakdown (Kilotons, %) by Region 2024 & 2032
  3. Figure 3: North America Sodium Ion Battery Market Revenue (Million), by Country 2024 & 2032
  4. Figure 4: North America Sodium Ion Battery Market Volume (Kilotons), by Country 2024 & 2032
  5. Figure 5: North America Sodium Ion Battery Market Revenue Share (%), by Country 2024 & 2032
  6. Figure 6: North America Sodium Ion Battery Market Volume Share (%), by Country 2024 & 2032
  7. Figure 7: Europe Sodium Ion Battery Market Revenue (Million), by Country 2024 & 2032
  8. Figure 8: Europe Sodium Ion Battery Market Volume (Kilotons), by Country 2024 & 2032
  9. Figure 9: Europe Sodium Ion Battery Market Revenue Share (%), by Country 2024 & 2032
  10. Figure 10: Europe Sodium Ion Battery Market Volume Share (%), by Country 2024 & 2032
  11. Figure 11: Asia Pacific Sodium Ion Battery Market Revenue (Million), by Country 2024 & 2032
  12. Figure 12: Asia Pacific Sodium Ion Battery Market Volume (Kilotons), by Country 2024 & 2032
  13. Figure 13: Asia Pacific Sodium Ion Battery Market Revenue Share (%), by Country 2024 & 2032
  14. Figure 14: Asia Pacific Sodium Ion Battery Market Volume Share (%), by Country 2024 & 2032
  15. Figure 15: South America Sodium Ion Battery Market Revenue (Million), by Country 2024 & 2032
  16. Figure 16: South America Sodium Ion Battery Market Volume (Kilotons), by Country 2024 & 2032
  17. Figure 17: South America Sodium Ion Battery Market Revenue Share (%), by Country 2024 & 2032
  18. Figure 18: South America Sodium Ion Battery Market Volume Share (%), by Country 2024 & 2032
  19. Figure 19: North America Sodium Ion Battery Market Revenue (Million), by Country 2024 & 2032
  20. Figure 20: North America Sodium Ion Battery Market Volume (Kilotons), by Country 2024 & 2032
  21. Figure 21: North America Sodium Ion Battery Market Revenue Share (%), by Country 2024 & 2032
  22. Figure 22: North America Sodium Ion Battery Market Volume Share (%), by Country 2024 & 2032
  23. Figure 23: MEA Sodium Ion Battery Market Revenue (Million), by Country 2024 & 2032
  24. Figure 24: MEA Sodium Ion Battery Market Volume (Kilotons), by Country 2024 & 2032
  25. Figure 25: MEA Sodium Ion Battery Market Revenue Share (%), by Country 2024 & 2032
  26. Figure 26: MEA Sodium Ion Battery Market Volume Share (%), by Country 2024 & 2032
  27. Figure 27: North America Sodium Ion Battery Market Revenue (Million), by Application 2024 & 2032
  28. Figure 28: North America Sodium Ion Battery Market Volume (Kilotons), by Application 2024 & 2032
  29. Figure 29: North America Sodium Ion Battery Market Revenue Share (%), by Application 2024 & 2032
  30. Figure 30: North America Sodium Ion Battery Market Volume Share (%), by Application 2024 & 2032
  31. Figure 31: North America Sodium Ion Battery Market Revenue (Million), by Country 2024 & 2032
  32. Figure 32: North America Sodium Ion Battery Market Volume (Kilotons), by Country 2024 & 2032
  33. Figure 33: North America Sodium Ion Battery Market Revenue Share (%), by Country 2024 & 2032
  34. Figure 34: North America Sodium Ion Battery Market Volume Share (%), by Country 2024 & 2032
  35. Figure 35: Europe Sodium Ion Battery Market Revenue (Million), by Application 2024 & 2032
  36. Figure 36: Europe Sodium Ion Battery Market Volume (Kilotons), by Application 2024 & 2032
  37. Figure 37: Europe Sodium Ion Battery Market Revenue Share (%), by Application 2024 & 2032
  38. Figure 38: Europe Sodium Ion Battery Market Volume Share (%), by Application 2024 & 2032
  39. Figure 39: Europe Sodium Ion Battery Market Revenue (Million), by Country 2024 & 2032
  40. Figure 40: Europe Sodium Ion Battery Market Volume (Kilotons), by Country 2024 & 2032
  41. Figure 41: Europe Sodium Ion Battery Market Revenue Share (%), by Country 2024 & 2032
  42. Figure 42: Europe Sodium Ion Battery Market Volume Share (%), by Country 2024 & 2032
  43. Figure 43: Asia Pacific Sodium Ion Battery Market Revenue (Million), by Application 2024 & 2032
  44. Figure 44: Asia Pacific Sodium Ion Battery Market Volume (Kilotons), by Application 2024 & 2032
  45. Figure 45: Asia Pacific Sodium Ion Battery Market Revenue Share (%), by Application 2024 & 2032
  46. Figure 46: Asia Pacific Sodium Ion Battery Market Volume Share (%), by Application 2024 & 2032
  47. Figure 47: Asia Pacific Sodium Ion Battery Market Revenue (Million), by Country 2024 & 2032
  48. Figure 48: Asia Pacific Sodium Ion Battery Market Volume (Kilotons), by Country 2024 & 2032
  49. Figure 49: Asia Pacific Sodium Ion Battery Market Revenue Share (%), by Country 2024 & 2032
  50. Figure 50: Asia Pacific Sodium Ion Battery Market Volume Share (%), by Country 2024 & 2032
  51. Figure 51: South America Sodium Ion Battery Market Revenue (Million), by Application 2024 & 2032
  52. Figure 52: South America Sodium Ion Battery Market Volume (Kilotons), by Application 2024 & 2032
  53. Figure 53: South America Sodium Ion Battery Market Revenue Share (%), by Application 2024 & 2032
  54. Figure 54: South America Sodium Ion Battery Market Volume Share (%), by Application 2024 & 2032
  55. Figure 55: South America Sodium Ion Battery Market Revenue (Million), by Country 2024 & 2032
  56. Figure 56: South America Sodium Ion Battery Market Volume (Kilotons), by Country 2024 & 2032
  57. Figure 57: South America Sodium Ion Battery Market Revenue Share (%), by Country 2024 & 2032
  58. Figure 58: South America Sodium Ion Battery Market Volume Share (%), by Country 2024 & 2032
  59. Figure 59: Middle East and Africa Sodium Ion Battery Market Revenue (Million), by Application 2024 & 2032
  60. Figure 60: Middle East and Africa Sodium Ion Battery Market Volume (Kilotons), by Application 2024 & 2032
  61. Figure 61: Middle East and Africa Sodium Ion Battery Market Revenue Share (%), by Application 2024 & 2032
  62. Figure 62: Middle East and Africa Sodium Ion Battery Market Volume Share (%), by Application 2024 & 2032
  63. Figure 63: Middle East and Africa Sodium Ion Battery Market Revenue (Million), by Country 2024 & 2032
  64. Figure 64: Middle East and Africa Sodium Ion Battery Market Volume (Kilotons), by Country 2024 & 2032
  65. Figure 65: Middle East and Africa Sodium Ion Battery Market Revenue Share (%), by Country 2024 & 2032
  66. Figure 66: Middle East and Africa Sodium Ion Battery Market Volume Share (%), by Country 2024 & 2032

List of Tables

  1. Table 1: Global Sodium Ion Battery Market Revenue Million Forecast, by Region 2019 & 2032
  2. Table 2: Global Sodium Ion Battery Market Volume Kilotons Forecast, by Region 2019 & 2032
  3. Table 3: Global Sodium Ion Battery Market Revenue Million Forecast, by Application 2019 & 2032
  4. Table 4: Global Sodium Ion Battery Market Volume Kilotons Forecast, by Application 2019 & 2032
  5. Table 5: Global Sodium Ion Battery Market Revenue Million Forecast, by Region 2019 & 2032
  6. Table 6: Global Sodium Ion Battery Market Volume Kilotons Forecast, by Region 2019 & 2032
  7. Table 7: Global Sodium Ion Battery Market Revenue Million Forecast, by Country 2019 & 2032
  8. Table 8: Global Sodium Ion Battery Market Volume Kilotons Forecast, by Country 2019 & 2032
  9. Table 9: United States Sodium Ion Battery Market Revenue (Million) Forecast, by Application 2019 & 2032
  10. Table 10: United States Sodium Ion Battery Market Volume (Kilotons) Forecast, by Application 2019 & 2032
  11. Table 11: Canada Sodium Ion Battery Market Revenue (Million) Forecast, by Application 2019 & 2032
  12. Table 12: Canada Sodium Ion Battery Market Volume (Kilotons) Forecast, by Application 2019 & 2032
  13. Table 13: Mexico Sodium Ion Battery Market Revenue (Million) Forecast, by Application 2019 & 2032
  14. Table 14: Mexico Sodium Ion Battery Market Volume (Kilotons) Forecast, by Application 2019 & 2032
  15. Table 15: Global Sodium Ion Battery Market Revenue Million Forecast, by Country 2019 & 2032
  16. Table 16: Global Sodium Ion Battery Market Volume Kilotons Forecast, by Country 2019 & 2032
  17. Table 17: Germany Sodium Ion Battery Market Revenue (Million) Forecast, by Application 2019 & 2032
  18. Table 18: Germany Sodium Ion Battery Market Volume (Kilotons) Forecast, by Application 2019 & 2032
  19. Table 19: United Kingdom Sodium Ion Battery Market Revenue (Million) Forecast, by Application 2019 & 2032
  20. Table 20: United Kingdom Sodium Ion Battery Market Volume (Kilotons) Forecast, by Application 2019 & 2032
  21. Table 21: France Sodium Ion Battery Market Revenue (Million) Forecast, by Application 2019 & 2032
  22. Table 22: France Sodium Ion Battery Market Volume (Kilotons) Forecast, by Application 2019 & 2032
  23. Table 23: Spain Sodium Ion Battery Market Revenue (Million) Forecast, by Application 2019 & 2032
  24. Table 24: Spain Sodium Ion Battery Market Volume (Kilotons) Forecast, by Application 2019 & 2032
  25. Table 25: Italy Sodium Ion Battery Market Revenue (Million) Forecast, by Application 2019 & 2032
  26. Table 26: Italy Sodium Ion Battery Market Volume (Kilotons) Forecast, by Application 2019 & 2032
  27. Table 27: Spain Sodium Ion Battery Market Revenue (Million) Forecast, by Application 2019 & 2032
  28. Table 28: Spain Sodium Ion Battery Market Volume (Kilotons) Forecast, by Application 2019 & 2032
  29. Table 29: Belgium Sodium Ion Battery Market Revenue (Million) Forecast, by Application 2019 & 2032
  30. Table 30: Belgium Sodium Ion Battery Market Volume (Kilotons) Forecast, by Application 2019 & 2032
  31. Table 31: Netherland Sodium Ion Battery Market Revenue (Million) Forecast, by Application 2019 & 2032
  32. Table 32: Netherland Sodium Ion Battery Market Volume (Kilotons) Forecast, by Application 2019 & 2032
  33. Table 33: Nordics Sodium Ion Battery Market Revenue (Million) Forecast, by Application 2019 & 2032
  34. Table 34: Nordics Sodium Ion Battery Market Volume (Kilotons) Forecast, by Application 2019 & 2032
  35. Table 35: Rest of Europe Sodium Ion Battery Market Revenue (Million) Forecast, by Application 2019 & 2032
  36. Table 36: Rest of Europe Sodium Ion Battery Market Volume (Kilotons) Forecast, by Application 2019 & 2032
  37. Table 37: Global Sodium Ion Battery Market Revenue Million Forecast, by Country 2019 & 2032
  38. Table 38: Global Sodium Ion Battery Market Volume Kilotons Forecast, by Country 2019 & 2032
  39. Table 39: China Sodium Ion Battery Market Revenue (Million) Forecast, by Application 2019 & 2032
  40. Table 40: China Sodium Ion Battery Market Volume (Kilotons) Forecast, by Application 2019 & 2032
  41. Table 41: Japan Sodium Ion Battery Market Revenue (Million) Forecast, by Application 2019 & 2032
  42. Table 42: Japan Sodium Ion Battery Market Volume (Kilotons) Forecast, by Application 2019 & 2032
  43. Table 43: India Sodium Ion Battery Market Revenue (Million) Forecast, by Application 2019 & 2032
  44. Table 44: India Sodium Ion Battery Market Volume (Kilotons) Forecast, by Application 2019 & 2032
  45. Table 45: South Korea Sodium Ion Battery Market Revenue (Million) Forecast, by Application 2019 & 2032
  46. Table 46: South Korea Sodium Ion Battery Market Volume (Kilotons) Forecast, by Application 2019 & 2032
  47. Table 47: Southeast Asia Sodium Ion Battery Market Revenue (Million) Forecast, by Application 2019 & 2032
  48. Table 48: Southeast Asia Sodium Ion Battery Market Volume (Kilotons) Forecast, by Application 2019 & 2032
  49. Table 49: Australia Sodium Ion Battery Market Revenue (Million) Forecast, by Application 2019 & 2032
  50. Table 50: Australia Sodium Ion Battery Market Volume (Kilotons) Forecast, by Application 2019 & 2032
  51. Table 51: Indonesia Sodium Ion Battery Market Revenue (Million) Forecast, by Application 2019 & 2032
  52. Table 52: Indonesia Sodium Ion Battery Market Volume (Kilotons) Forecast, by Application 2019 & 2032
  53. Table 53: Phillipes Sodium Ion Battery Market Revenue (Million) Forecast, by Application 2019 & 2032
  54. Table 54: Phillipes Sodium Ion Battery Market Volume (Kilotons) Forecast, by Application 2019 & 2032
  55. Table 55: Singapore Sodium Ion Battery Market Revenue (Million) Forecast, by Application 2019 & 2032
  56. Table 56: Singapore Sodium Ion Battery Market Volume (Kilotons) Forecast, by Application 2019 & 2032
  57. Table 57: Thailandc Sodium Ion Battery Market Revenue (Million) Forecast, by Application 2019 & 2032
  58. Table 58: Thailandc Sodium Ion Battery Market Volume (Kilotons) Forecast, by Application 2019 & 2032
  59. Table 59: Rest of Asia Pacific Sodium Ion Battery Market Revenue (Million) Forecast, by Application 2019 & 2032
  60. Table 60: Rest of Asia Pacific Sodium Ion Battery Market Volume (Kilotons) Forecast, by Application 2019 & 2032
  61. Table 61: Global Sodium Ion Battery Market Revenue Million Forecast, by Country 2019 & 2032
  62. Table 62: Global Sodium Ion Battery Market Volume Kilotons Forecast, by Country 2019 & 2032
  63. Table 63: Brazil Sodium Ion Battery Market Revenue (Million) Forecast, by Application 2019 & 2032
  64. Table 64: Brazil Sodium Ion Battery Market Volume (Kilotons) Forecast, by Application 2019 & 2032
  65. Table 65: Argentina Sodium Ion Battery Market Revenue (Million) Forecast, by Application 2019 & 2032
  66. Table 66: Argentina Sodium Ion Battery Market Volume (Kilotons) Forecast, by Application 2019 & 2032
  67. Table 67: Peru Sodium Ion Battery Market Revenue (Million) Forecast, by Application 2019 & 2032
  68. Table 68: Peru Sodium Ion Battery Market Volume (Kilotons) Forecast, by Application 2019 & 2032
  69. Table 69: Chile Sodium Ion Battery Market Revenue (Million) Forecast, by Application 2019 & 2032
  70. Table 70: Chile Sodium Ion Battery Market Volume (Kilotons) Forecast, by Application 2019 & 2032
  71. Table 71: Colombia Sodium Ion Battery Market Revenue (Million) Forecast, by Application 2019 & 2032
  72. Table 72: Colombia Sodium Ion Battery Market Volume (Kilotons) Forecast, by Application 2019 & 2032
  73. Table 73: Ecuador Sodium Ion Battery Market Revenue (Million) Forecast, by Application 2019 & 2032
  74. Table 74: Ecuador Sodium Ion Battery Market Volume (Kilotons) Forecast, by Application 2019 & 2032
  75. Table 75: Venezuela Sodium Ion Battery Market Revenue (Million) Forecast, by Application 2019 & 2032
  76. Table 76: Venezuela Sodium Ion Battery Market Volume (Kilotons) Forecast, by Application 2019 & 2032
  77. Table 77: Rest of South America Sodium Ion Battery Market Revenue (Million) Forecast, by Application 2019 & 2032
  78. Table 78: Rest of South America Sodium Ion Battery Market Volume (Kilotons) Forecast, by Application 2019 & 2032
  79. Table 79: Global Sodium Ion Battery Market Revenue Million Forecast, by Country 2019 & 2032
  80. Table 80: Global Sodium Ion Battery Market Volume Kilotons Forecast, by Country 2019 & 2032
  81. Table 81: United States Sodium Ion Battery Market Revenue (Million) Forecast, by Application 2019 & 2032
  82. Table 82: United States Sodium Ion Battery Market Volume (Kilotons) Forecast, by Application 2019 & 2032
  83. Table 83: Canada Sodium Ion Battery Market Revenue (Million) Forecast, by Application 2019 & 2032
  84. Table 84: Canada Sodium Ion Battery Market Volume (Kilotons) Forecast, by Application 2019 & 2032
  85. Table 85: Mexico Sodium Ion Battery Market Revenue (Million) Forecast, by Application 2019 & 2032
  86. Table 86: Mexico Sodium Ion Battery Market Volume (Kilotons) Forecast, by Application 2019 & 2032
  87. Table 87: Global Sodium Ion Battery Market Revenue Million Forecast, by Country 2019 & 2032
  88. Table 88: Global Sodium Ion Battery Market Volume Kilotons Forecast, by Country 2019 & 2032
  89. Table 89: United Arab Emirates Sodium Ion Battery Market Revenue (Million) Forecast, by Application 2019 & 2032
  90. Table 90: United Arab Emirates Sodium Ion Battery Market Volume (Kilotons) Forecast, by Application 2019 & 2032
  91. Table 91: Saudi Arabia Sodium Ion Battery Market Revenue (Million) Forecast, by Application 2019 & 2032
  92. Table 92: Saudi Arabia Sodium Ion Battery Market Volume (Kilotons) Forecast, by Application 2019 & 2032
  93. Table 93: South Africa Sodium Ion Battery Market Revenue (Million) Forecast, by Application 2019 & 2032
  94. Table 94: South Africa Sodium Ion Battery Market Volume (Kilotons) Forecast, by Application 2019 & 2032
  95. Table 95: Rest of Middle East and Africa Sodium Ion Battery Market Revenue (Million) Forecast, by Application 2019 & 2032
  96. Table 96: Rest of Middle East and Africa Sodium Ion Battery Market Volume (Kilotons) Forecast, by Application 2019 & 2032
  97. Table 97: Global Sodium Ion Battery Market Revenue Million Forecast, by Application 2019 & 2032
  98. Table 98: Global Sodium Ion Battery Market Volume Kilotons Forecast, by Application 2019 & 2032
  99. Table 99: Global Sodium Ion Battery Market Revenue Million Forecast, by Country 2019 & 2032
  100. Table 100: Global Sodium Ion Battery Market Volume Kilotons Forecast, by Country 2019 & 2032
  101. Table 101: United States of America Sodium Ion Battery Market Revenue (Million) Forecast, by Application 2019 & 2032
  102. Table 102: United States of America Sodium Ion Battery Market Volume (Kilotons) Forecast, by Application 2019 & 2032
  103. Table 103: Canada Sodium Ion Battery Market Revenue (Million) Forecast, by Application 2019 & 2032
  104. Table 104: Canada Sodium Ion Battery Market Volume (Kilotons) Forecast, by Application 2019 & 2032
  105. Table 105: Rest of the North America Sodium Ion Battery Market Revenue (Million) Forecast, by Application 2019 & 2032
  106. Table 106: Rest of the North America Sodium Ion Battery Market Volume (Kilotons) Forecast, by Application 2019 & 2032
  107. Table 107: Global Sodium Ion Battery Market Revenue Million Forecast, by Application 2019 & 2032
  108. Table 108: Global Sodium Ion Battery Market Volume Kilotons Forecast, by Application 2019 & 2032
  109. Table 109: Global Sodium Ion Battery Market Revenue Million Forecast, by Country 2019 & 2032
  110. Table 110: Global Sodium Ion Battery Market Volume Kilotons Forecast, by Country 2019 & 2032
  111. Table 111: United Kingdom Sodium Ion Battery Market Revenue (Million) Forecast, by Application 2019 & 2032
  112. Table 112: United Kingdom Sodium Ion Battery Market Volume (Kilotons) Forecast, by Application 2019 & 2032
  113. Table 113: Germany Sodium Ion Battery Market Revenue (Million) Forecast, by Application 2019 & 2032
  114. Table 114: Germany Sodium Ion Battery Market Volume (Kilotons) Forecast, by Application 2019 & 2032
  115. Table 115: France Sodium Ion Battery Market Revenue (Million) Forecast, by Application 2019 & 2032
  116. Table 116: France Sodium Ion Battery Market Volume (Kilotons) Forecast, by Application 2019 & 2032
  117. Table 117: Italy Sodium Ion Battery Market Revenue (Million) Forecast, by Application 2019 & 2032
  118. Table 118: Italy Sodium Ion Battery Market Volume (Kilotons) Forecast, by Application 2019 & 2032
  119. Table 119: Rest of the Europe Sodium Ion Battery Market Revenue (Million) Forecast, by Application 2019 & 2032
  120. Table 120: Rest of the Europe Sodium Ion Battery Market Volume (Kilotons) Forecast, by Application 2019 & 2032
  121. Table 121: Global Sodium Ion Battery Market Revenue Million Forecast, by Application 2019 & 2032
  122. Table 122: Global Sodium Ion Battery Market Volume Kilotons Forecast, by Application 2019 & 2032
  123. Table 123: Global Sodium Ion Battery Market Revenue Million Forecast, by Country 2019 & 2032
  124. Table 124: Global Sodium Ion Battery Market Volume Kilotons Forecast, by Country 2019 & 2032
  125. Table 125: China Sodium Ion Battery Market Revenue (Million) Forecast, by Application 2019 & 2032
  126. Table 126: China Sodium Ion Battery Market Volume (Kilotons) Forecast, by Application 2019 & 2032
  127. Table 127: India Sodium Ion Battery Market Revenue (Million) Forecast, by Application 2019 & 2032
  128. Table 128: India Sodium Ion Battery Market Volume (Kilotons) Forecast, by Application 2019 & 2032
  129. Table 129: Japan Sodium Ion Battery Market Revenue (Million) Forecast, by Application 2019 & 2032
  130. Table 130: Japan Sodium Ion Battery Market Volume (Kilotons) Forecast, by Application 2019 & 2032
  131. Table 131: Rest of the Asia Pacific Sodium Ion Battery Market Revenue (Million) Forecast, by Application 2019 & 2032
  132. Table 132: Rest of the Asia Pacific Sodium Ion Battery Market Volume (Kilotons) Forecast, by Application 2019 & 2032
  133. Table 133: Global Sodium Ion Battery Market Revenue Million Forecast, by Application 2019 & 2032
  134. Table 134: Global Sodium Ion Battery Market Volume Kilotons Forecast, by Application 2019 & 2032
  135. Table 135: Global Sodium Ion Battery Market Revenue Million Forecast, by Country 2019 & 2032
  136. Table 136: Global Sodium Ion Battery Market Volume Kilotons Forecast, by Country 2019 & 2032
  137. Table 137: Brazil Sodium Ion Battery Market Revenue (Million) Forecast, by Application 2019 & 2032
  138. Table 138: Brazil Sodium Ion Battery Market Volume (Kilotons) Forecast, by Application 2019 & 2032
  139. Table 139: Argentina Sodium Ion Battery Market Revenue (Million) Forecast, by Application 2019 & 2032
  140. Table 140: Argentina Sodium Ion Battery Market Volume (Kilotons) Forecast, by Application 2019 & 2032
  141. Table 141: Rest of the South America Sodium Ion Battery Market Revenue (Million) Forecast, by Application 2019 & 2032
  142. Table 142: Rest of the South America Sodium Ion Battery Market Volume (Kilotons) Forecast, by Application 2019 & 2032
  143. Table 143: Global Sodium Ion Battery Market Revenue Million Forecast, by Application 2019 & 2032
  144. Table 144: Global Sodium Ion Battery Market Volume Kilotons Forecast, by Application 2019 & 2032
  145. Table 145: Global Sodium Ion Battery Market Revenue Million Forecast, by Country 2019 & 2032
  146. Table 146: Global Sodium Ion Battery Market Volume Kilotons Forecast, by Country 2019 & 2032
  147. Table 147: United Arab Emirates Sodium Ion Battery Market Revenue (Million) Forecast, by Application 2019 & 2032
  148. Table 148: United Arab Emirates Sodium Ion Battery Market Volume (Kilotons) Forecast, by Application 2019 & 2032
  149. Table 149: Saudi Arabia Sodium Ion Battery Market Revenue (Million) Forecast, by Application 2019 & 2032
  150. Table 150: Saudi Arabia Sodium Ion Battery Market Volume (Kilotons) Forecast, by Application 2019 & 2032
  151. Table 151: South Africa Sodium Ion Battery Market Revenue (Million) Forecast, by Application 2019 & 2032
  152. Table 152: South Africa Sodium Ion Battery Market Volume (Kilotons) Forecast, by Application 2019 & 2032
  153. Table 153: Rest of the Middle East and Africa Sodium Ion Battery Market Revenue (Million) Forecast, by Application 2019 & 2032
  154. Table 154: Rest of the Middle East and Africa Sodium Ion Battery Market Volume (Kilotons) Forecast, by Application 2019 & 2032


Frequently Asked Questions

1. What is the projected Compound Annual Growth Rate (CAGR) of the Sodium Ion Battery Market?

The projected CAGR is approximately 7.28%.

2. Which companies are prominent players in the Sodium Ion Battery Market?

Key companies in the market include HiNa Battery Technology Co Ltd, Natron Energy Inc, Contemporary Amperex Technology Co Limited, TIAMAT SAS, Altris AB, AMTE Power PLC, Faradion Limited, NGK Insulators Ltd.

3. What are the main segments of the Sodium Ion Battery Market?

The market segments include Application.

4. Can you provide details about the market size?

The market size is estimated to be USD 166.54 Million as of 2022.

5. What are some drivers contributing to market growth?

4.; The Increasing Demand for Cleaner Energy4.; Increasing Adoption of Sodium-Ion Batteries for Energy Storage Systems.

6. What are the notable trends driving market growth?

Stationary Energy Storage is a Significant Segment for the Market.

7. Are there any restraints impacting market growth?

4.; Availability of Technical Constraints.

8. Can you provide examples of recent developments in the market?

June 2023: FinDreams, the battery division of Chinese automaker BYD, is forming a partnership with Huaihai Holding Group. Together, the two companies announced plans to supply sodium-ion batteries for compact electric vehicles.

9. What pricing options are available for accessing the report?

Pricing options include single-user, multi-user, and enterprise licenses priced at USD 4750, USD 5250, and USD 8750 respectively.

10. Is the market size provided in terms of value or volume?

The market size is provided in terms of value, measured in Million and volume, measured in Kilotons.

11. Are there any specific market keywords associated with the report?

Yes, the market keyword associated with the report is "Sodium Ion Battery Market," which aids in identifying and referencing the specific market segment covered.

12. How do I determine which pricing option suits my needs best?

The pricing options vary based on user requirements and access needs. Individual users may opt for single-user licenses, while businesses requiring broader access may choose multi-user or enterprise licenses for cost-effective access to the report.

13. Are there any additional resources or data provided in the Sodium Ion Battery Market report?

While the report offers comprehensive insights, it's advisable to review the specific contents or supplementary materials provided to ascertain if additional resources or data are available.

14. How can I stay updated on further developments or reports in the Sodium Ion Battery Market?

To stay informed about further developments, trends, and reports in the Sodium Ion Battery Market, consider subscribing to industry newsletters, following relevant companies and organizations, or regularly checking reputable industry news sources and publications.


Methodology

Step 1 - Identification of Relevant Samples Size from Population Database

Step Chart
Bar Chart
Method Chart

Step 2 - Approaches for Defining Global Market Size (Value, Volume* & Price*)

Approach Chart
Top-down and bottom-up approaches are used to validate the global market size and estimate the market size for manufactures, regional segments, product, and application.

Note*: In applicable scenarios

Step 3 - Data Sources

Primary Research

  • Web Analytics
  • Survey Reports
  • Research Institute
  • Latest Research Reports
  • Opinion Leaders

Secondary Research

  • Annual Reports
  • White Paper
  • Latest Press Release
  • Industry Association
  • Paid Database
  • Investor Presentations
Analyst Chart

Step 4 - Data Triangulation

Involves using different sources of information in order to increase the validity of a study

These sources are likely to be stakeholders in a program - participants, other researchers, program staff, other community members, and so on.

Then we put all data in single framework & apply various statistical tools to find out the dynamic on the market.

During the analysis stage, feedback from the stakeholder groups would be compared to determine areas of agreement as well as areas of divergence

Additionally, after gathering mixed and scattered data from a wide range of sources, data is triangulated and correlated to come up with estimated figures which are further validated through primary mediums or industry experts, opinion leaders.

About Visionary Data Reports

Visionary Data Reports provides future-focused market research, advanced analytics, and strategic insights for technology, healthcare, green energy, and finance. Our reports help you anticipate trends, innovate, and lead in your industry. Our expert team combines primary research, data science, and industry knowledge to deliver actionable intelligence. We offer syndicated reports, custom analytics, and consulting services tailored to your business needs. At Visionary Data Reports, we are committed to quality, transparency, and client satisfaction. Every report is rigorously validated to ensure accuracy and relevance. Our global perspective and forward-thinking approach help you understand both current and emerging market dynamics.

Stay ahead with Visionary Data Reports. Subscribe to our newsletter for the latest insights and research highlights, and follow us on social media for real-time updates. Visionary Data Reports – Your Guide to Tomorrow’s Opportunities.

artwork spiralartwork spiralRelated Reports
artwork underline

China Nuclear Power Plant Equipment Market Unlocking Growth Opportunities: Analysis and Forecast 2025-2033

Explore the China Nuclear Power Plant Equipment Market analysis, CAGR > 6.00%, drivers, restraints, and key segments. Discover market trends for Pressurized Water Reactor, Island Equipment, and major companies.

December 2025
Base Year: 2024
No Of Pages: 197
Price: $3800

Exploring Key Trends in Saudi Arabia Drilling Rigs Market Market

Explore the Saudi Arabia Drilling Rigs Market analysis, including market size, CAGR of 4.80%, key drivers, trends, and major companies. Get insights into the onshore deployment segment and regional focus on Saudi Arabia.

December 2025
Base Year: 2024
No Of Pages: 197
Price: $3800

Consumer Trends Driving Industrial Centrifuge Industry Market Growth

Explore the booming Industrial Centrifuge Market, projected to reach $8.47 billion with a 4.51% CAGR. Discover key growth drivers, emerging trends, and regional market dominance in water treatment, pharmaceuticals, and food & beverages.

December 2025
Base Year: 2024
No Of Pages: 234
Price: $4750

Japan Power EPC Market Growth Projections: Trends to Watch

Explore the dynamic Japan Power EPC Market, analyzing key drivers like renewable energy expansion and infrastructure upgrades. Discover market size, CAGR, trends, restraints, and leading companies shaping the future of power generation in Japan through 2033.

December 2025
Base Year: 2024
No Of Pages: 197
Price: $3800

Equatorial Guinea Power Industry Insights: Market Size Analysis to 2033

Explore the burgeoning Equatorial Guinea power industry market with insights on growth drivers, key trends, and segmental analysis. Discover forecasts for electricity transmission, generation, and renewable energy equipment.

November 2025
Base Year: 2024
No Of Pages: 197
Price: $3800

Exploring Innovations in Africa Thermal Energy Storage Industry: Market Dynamics 2025-2033

Explore the booming African Thermal Energy Storage market, driven by renewable energy integration and power generation needs. Discover key growth drivers, market size projections, and leading companies shaping the future of energy in Africa.

November 2025
Base Year: 2024
No Of Pages: 234
Price: $4750

Decoding Market Trends in Oil and Gas Industry in Malaysia: 2025-2033 Analysis

Explore Malaysia's Oil and Gas Industry market size, CAGR, key drivers, trends, and restraints. Get in-depth analysis and future projections for this vital energy sector.

November 2025
Base Year: 2024
No Of Pages: 197
Price: $3800

Strategic Growth Drivers for Portugal Gas Generator Market Market

Explore the Portugal Gas Generator Market analysis, including market size, CAGR, drivers, trends, restraints, and key players. Discover growth opportunities and insights for the 2019-2033 period.

November 2025
Base Year: 2024
No Of Pages: 197
Price: $3800

FPSO Market Market Size and Trends 2025-2033: Comprehensive Outlook

Explore the dynamic FPSO market forecast, driven by deepwater exploration and technological innovation. Discover market size, CAGR, key drivers, restraints, and regional growth trends.

November 2025
Base Year: 2024
No Of Pages: 234
Price: $4750

Exploring Consumer Shifts in North America Oil & Gas Line Pipe Market Market 2025-2033

The size of the North America Oil & Gas Line Pipe Market market was valued at USD XX Million in 2024 and is projected to reach USD XXX Million by 2033, with an expected CAGR of 2.00">> 2.00% during the forecast period.

November 2025
Base Year: 2024
No Of Pages: 234
Price: $4750

Future Prospects for North America Smart Meters Market Growth

Explore the booming North America smart meters market forecast, driven by smart grid adoption and energy efficiency initiatives. Discover key insights, growth drivers, and leading companies shaping the future of utility management.

November 2025
Base Year: 2024
No Of Pages: 234
Price: $4750

Strategic Growth Drivers for Steam Turbine MRO Market Market

Explore the booming Steam Turbine MRO market forecast (2025-2033) with insights on drivers, trends, and segments for power, oil & gas. Get CAGR analysis.

November 2025
Base Year: 2024
No Of Pages: 234
Price: $4750

Exploring Asia-Pacific Solar PV Module Market’s Market Size Dynamics 2025-2033

Explore the booming Asia-Pacific Solar PV Module Market, driven by robust CAGR and government initiatives. Discover key drivers, trends, restraints, and growth opportunities across product types, end-users, and leading regions.

November 2025
Base Year: 2024
No Of Pages: 234
Price: $4750

Bulgaria Solar Energy Market XX CAGR Growth Analysis 2025-2033

Explore the dynamic Bulgarian solar energy market forecast, market size, CAGR, drivers, trends, restraints, and key players. Discover growth opportunities in clean energy.

November 2025
Base Year: 2024
No Of Pages: 197
Price: $3800

Europe Power to Gas Market Market Disruption and Future Trends

Explore the booming Europe Power to Gas market, driven by renewable energy integration and decarbonization efforts. Discover market size, growth drivers, and key segments for 2025-2033.

November 2025
Base Year: 2024
No Of Pages: 234
Price: $4750

Southeast Asia Power Transmission and Distribution Market Growth Pathways: Strategic Analysis and Forecasts 2025-2033

Explore the dynamic Southeast Asia Power Transmission and Distribution market, driven by robust economic growth and smart grid adoption. Discover key insights, CAGR trends, and market forecasts up to 2033 for Vietnam, Indonesia, Malaysia, and Thailand.

November 2025
Base Year: 2024
No Of Pages: 234
Price: $4750

Navigating South America Lithium-ion Battery For Electric Vehicle Market Market Growth 2025-2033

Explore the burgeoning South America lithium-ion battery market for electric vehicles, driven by robust growth and adoption. Discover key trends, market size, and leading companies shaping the future of EV mobility in the region.

November 2025
Base Year: 2024
No Of Pages: 234
Price: $4750

Growth Strategies in Middle East and Africa Solar Panel Recycling Market Market: 2025-2033 Outlook

Explore the booming Middle East and Africa Solar Panel Recycling Market, driven by rapid solar adoption and circular economy initiatives. Discover key drivers, trends, and growth forecasts for this essential sector.

November 2025
Base Year: 2024
No Of Pages: 234
Price: $4750

Peru Oil & Gas Downstream Industry Market Predictions and Opportunities 2025-2033

The size of the Peru Oil & Gas Downstream Industry market was valued at USD XX Million in 2024 and is projected to reach USD XXX Million by 2033, with an expected CAGR of 1.61">> 1.61% during the forecast period.

November 2025
Base Year: 2024
No Of Pages: 197
Price: $3800

Regional Trends and Opportunities for China Oil & Gas Upstream Industry Market

Explore the China Oil & Gas Upstream Industry market analysis, including key drivers, trends, restraints, and growth forecasts up to 2033. Discover insights into onshore and offshore exploration and production.

November 2025
Base Year: 2024
No Of Pages: 197
Price: $3800

Exploring Regional Dynamics of Power Transmission Tower Market Market 2025-2033

The size of the Power Transmission Tower Market market was valued at USD XX Million in 2024 and is projected to reach USD XXX Million by 2033, with an expected CAGR of 6.00">> 6.00% during the forecast period.

November 2025
Base Year: 2024
No Of Pages: 234
Price: $4750

North America Natural Gas Market Market Demand Dynamics: Insights 2025-2033

Explore the dynamic North America natural gas market analysis, forecasting robust growth driven by power generation, industrial fuel, and automotive applications. Discover key trends, drivers, and restraints shaping the region through 2033.

November 2025
Base Year: 2024
No Of Pages: 197
Price: $3800

Denmark Oil And Gas Midstream Market CAGR Growth Drivers and Trends: Forecasts 2025-2033

Explore the robust growth of the Denmark Oil and Gas Midstream market, driven by infrastructure development and energy security needs. Discover key insights, market drivers, and emerging trends shaping the sector through 2033.

October 2025
Base Year: 2024
No Of Pages: 197
Price: $3800

Netherlands Combined Heat and Power Market Analysis 2025 and Forecasts 2033: Unveiling Growth Opportunities

The size of the Netherlands Combined Heat and Power Market market was valued at USD XX Million in 2024 and is projected to reach USD XXX Million by 2033, with an expected CAGR of 1.34% during the forecast period.

October 2025
Base Year: 2024
No Of Pages: 197
Price: $3800

Thermal Power Industry Growth Opportunities and Market Forecast 2025-2033: A Strategic Analysis

Explore the Thermal Power Industry's market size, CAGR of 3%, and key drivers. Understand trends, restraints, fuel types (Coal, Gas, Nuclear), and leading companies from 2019-2033.

October 2025
Base Year: 2024
No Of Pages: 180
Price: $4750

North America Directional Drilling Industry Future-proof Strategies: Trends, Competitor Dynamics, and Opportunities 2025-2033

Explore the booming North America directional drilling market, driven by advanced technologies like RSS and growing oil/gas demand. Get key insights, market size, CAGR, and growth drivers for 2025-2033.

October 2025
Base Year: 2024
No Of Pages: 234
Price: $4750

Exploring Opportunities in Asia-Pacific Gas Generator Market Sector

The size of the Asia-Pacific Gas Generator Market market was valued at USD XX Million in 2024 and is projected to reach USD XXX Million by 2033, with an expected CAGR of 6.38">> 6.38% during the forecast period.

October 2025
Base Year: 2024
No Of Pages: 234
Price: $4750

Challenges to Overcome in Saudi Arabia Land-Based Fuel Transportation Market Market Growth: Analysis 2025-2033

Explore the dynamic Saudi Arabia Land-Based Fuel Transportation Market, driven by robust demand, infrastructure growth, and strategic energy initiatives. Discover key segments, trends, and leading companies shaping this vital sector's future.

October 2025
Base Year: 2024
No Of Pages: 197
Price: $3800

Laminated Busbar Industry Competitive Strategies: Trends and Forecasts 2025-2033

The size of the Laminated Busbar Industry market was valued at USD 0.78 USD Billion in 2024 and is projected to reach USD 1.17 USD Billion by 2033, with an expected CAGR of 6.02% during the forecast period.

October 2025
Base Year: 2024
No Of Pages: 180
Price: $4750

North America Nuclear Power Plant and Equipment Market Industry Overview and Projections

Explore the robust growth and key drivers of the North America Nuclear Power Plant and Equipment Market, from PWRs to BWRs, and understand future trends and opportunities through 2033.

October 2025
Base Year: 2024
No Of Pages: 234
Price: $4750

Consumer Trends Driving Brazil ROV Market Market Growth

The size of the Brazil ROV Market market was valued at USD XX Million in 2024 and is projected to reach USD XXX Million by 2033, with an expected CAGR of 6.00">> 6.00% during the forecast period.

October 2025
Base Year: 2024
No Of Pages: 197
Price: $3800

Emerging Growth Patterns in Algeria Oil and Gas Upstream Industry Market

Explore the burgeoning Algeria Oil and Gas Upstream Industry with our in-depth analysis. Discover market size, CAGR, key drivers like onshore and offshore projects, influential companies, and future trends shaping Algeria's energy landscape.

October 2025
Base Year: 2024
No Of Pages: 197
Price: $3800

Exploring Venezuela Energy Industry Market Disruption and Innovation

Explore the Venezuela Energy Industry's robust growth forecast, driven by hydrocarbon reserves and renewable integration. Discover key trends, restraints, and major players shaping the market's future from 2019-2033.

October 2025
Base Year: 2024
No Of Pages: 180
Price: $3800

Regional Growth Projections for Canada Renewable Energy Market Industry

Explore the dynamic Canadian renewable energy market, driven by robust growth, supportive policies, and technological innovation. Discover key drivers, trends, and segments shaping the future of sustainable power in Canada.

October 2025
Base Year: 2024
No Of Pages: 197
Price: $3800

Romania Wind Energy Market Market’s Consumer Landscape: Insights and Trends 2025-2033

Explore the booming Romanian wind energy market! Discover market size, CAGR, key drivers like renewable energy policies, and segments (onshore/offshore). Leading companies and future trends for 2025-2033.

October 2025
Base Year: 2024
No Of Pages: 197
Price: $3800

Consumer Trends Driving South America Medium Voltage Switchgear Market Market Growth

Explore the booming South America Medium Voltage Switchgear Market, driven by smart grids, renewable energy, and infrastructure upgrades. Get key insights, CAGR, market size, and top companies.

October 2025
Base Year: 2024
No Of Pages: 234
Price: $4750

Strategic Insights into South America High Voltage Switchgear Market Market Trends

Explore the dynamic South America High Voltage Switchgear Market, forecasting significant growth driven by renewable energy, infrastructure upgrades, and smart grid adoption. Discover key trends, drivers, and restraints impacting Brazil, Argentina, Colombia, and beyond.

October 2025
Base Year: 2024
No Of Pages: 234
Price: $4750

North America Wind Power Market Charting Growth Trajectories 2025-2033: Strategic Insights and Forecasts

The size of the North America Wind Power Market market was valued at USD XX Million in 2024 and is projected to reach USD XXX Million by 2033, with an expected CAGR of 7.34% during the forecast period.

October 2025
Base Year: 2024
No Of Pages: 234
Price: $4750

Sudan Power Industry Trends and Opportunities for Growth

Explore the evolving Sudan power industry market. Discover key drivers, emerging trends, and restraints shaping the energy landscape from 2019-2033.

October 2025
Base Year: 2024
No Of Pages: 197
Price: $3800

Emerging Opportunities in Alkaline Battery Market Market

Explore the dynamic Alkaline Battery Market forecast, driven by robust CAGR, consumer electronics demand, and emerging rechargeable trends. Discover market size, growth drivers, restraints, key players, and regional analysis up to 2033.

October 2025
Base Year: 2024
No Of Pages: 180
Price: $4750

Nigeria Solar EPC Market 2025-2033 Overview: Trends, Dynamics, and Growth Opportunities

Explore the booming Nigeria Solar EPC Market, projected to reach $1.22 Billion by 2025 with a strong CAGR. Discover market drivers, trends, and key players shaping Nigeria's renewable energy future.

October 2025
Base Year: 2024
No Of Pages: 197
Price: $3800

Oil and Gas Nuclear Magnetic Resonance Industry Future-proof Strategies: Trends, Competitor Dynamics, and Opportunities 2025-2033

Explore the booming Oil and Gas Nuclear Magnetic Resonance (NMR) market, driven by advanced reservoir characterization and EOR techniques. Discover key growth drivers, market trends, and regional insights from 2025-2033 with a CAGR over 5.00%.

October 2025
Base Year: 2024
No Of Pages: 234
Price: $4750

South America Nuclear Reactor Construction Market Analysis Report 2025: Market to Grow by a CAGR of XX to 2033, Driven by Government Incentives, Popularity of Virtual Assistants, and Strategic Partnerships

Explore the South America nuclear reactor construction market analysis, including drivers, restraints, trends, and regional insights for Brazil, Argentina, and beyond. Understand market size and CAGR from 2019-2033.

October 2025
Base Year: 2024
No Of Pages: 234
Price: $4750

Solid Oxide Fuel Cells Market Strategic Market Roadmap: Analysis and Forecasts 2025-2033

The size of the Solid Oxide Fuel Cells Market market was valued at USD 1670 Million in 2024 and is projected to reach USD XXX Million by 2033, with an expected CAGR of 49.00">> 49.00% during the forecast period.

October 2025
Base Year: 2024
No Of Pages: 180
Price: $4750

Oil & Gas Pump Market Report: Trends and Forecasts 2025-2033

Explore the dynamic Oil & Gas Pump Market. Discover key growth drivers, segment analysis (Dynamic & Positive Displacement Pumps), application insights (Upstream, Midstream, Downstream), market trends, restraints, and leading companies. Get insights into market size and CAGR projections for 2025-2033.

October 2025
Base Year: 2024
No Of Pages: 234
Price: $4750

Electrical Bushing Market 2025-2033 Market Analysis: Trends, Dynamics, and Growth Opportunities

The size of the Electrical Bushing Market market was valued at USD XX Million in 2024 and is projected to reach USD XXX Million by 2033, with an expected CAGR of 5.60">> 5.60% during the forecast period.

October 2025
Base Year: 2024
No Of Pages: 234
Price: $4750

Future Trends Shaping East Europe Battery Industry Growth

Explore the dynamic East Europe battery market, driven by automotive electrification & industrial energy storage. Discover key trends, growth drivers, and leading companies shaping this expanding industry through 2033.

October 2025
Base Year: 2024
No Of Pages: 234
Price: $4750

Asia-Pacific Low Voltage Switchgear Market Industry Overview and Projections

Explore the Asia-Pacific Low Voltage Switchgear Market analysis, uncovering drivers, trends, and projections for market growth up to 2033. Essential for understanding future opportunities in electrical infrastructure.

October 2025
Base Year: 2024
No Of Pages: 234
Price: $4750

Parallel Shaft Geared Motors Market Strategic Roadmap: Analysis and Forecasts 2025-2033

The size of the Parallel Shaft Geared Motors Market market was valued at USD XX Million in 2024 and is projected to reach USD XXX Million by 2033, with an expected CAGR of 15.00% during the forecast period.

October 2025
Base Year: 2024
No Of Pages: 234
Price: $4750

Asia Pacific Smart Transformers Market Market’s Consumer Preferences: Trends and Analysis 2025-2033

Explore the booming Asia Pacific Smart Transformers Market, projected to exceed $13 billion by 2033. Discover key drivers, growth trends, and leading companies shaping the future of smart grid technology in the region.

October 2025
Base Year: 2024
No Of Pages: 234
Price: $4750

Business Address

Head Office

Ansec House 3 rd floor Tank Road, Yerwada, Pune, Maharashtra 411014

Contact Information

Craig Francis

Business Development Head

+17162654855

[email protected]

Secure Payment Partners

payment image
RetailPackagingLogisticsAutomotiveHealthcareAgricultureEnergy & PowerFood & BeverageAerospace & DefenseChemicals & MaterialsHospitality and TourismConsumer Goods and ServicesAnimal Nutrition & WellnessReal Estate and ConstructionHome and Property ImprovementTechnology, Media and TelecomManufacturing Products and ServicesFinancial Services and Investment Intelligence

© 2025 PRDUA Research & Media Private Limited, All rights reserved

Privacy Policy
Terms and Conditions
FAQ
  • Home
  • About Us
  • Industries
    • Packaging
    • Automotive
    • Home and Property Improvement
    • Retail
    • Energy & Power
    • Food & Beverage
    • Real Estate and Construction
    • Hospitality and Tourism
    • Agriculture
    • Manufacturing Products and Services
    • Healthcare
    • Logistics
    • Aerospace & Defense
    • Chemicals & Materials
    • Professional and Commercial Services
    • Financial Services and Investment Intelligence
    • Consumer Goods and Services
    • Animal Nutrition & Wellness
    • Technology, Media and Telecom
  • Services
  • Contact
Main Logo
  • Home
  • About Us
  • Industries
    • Packaging
    • Automotive
    • Home and Property Improvement
    • Retail
    • Energy & Power
    • Food & Beverage
    • Real Estate and Construction
    • Hospitality and Tourism
    • Agriculture
    • Manufacturing Products and Services
    • Healthcare
    • Logistics
    • Aerospace & Defense
    • Chemicals & Materials
    • Professional and Commercial Services
    • Financial Services and Investment Intelligence
    • Consumer Goods and Services
    • Animal Nutrition & Wellness
    • Technology, Media and Telecom
  • Services
  • Contact
+17162654855
[email protected]

+17162654855

[email protected]