

Key Insights
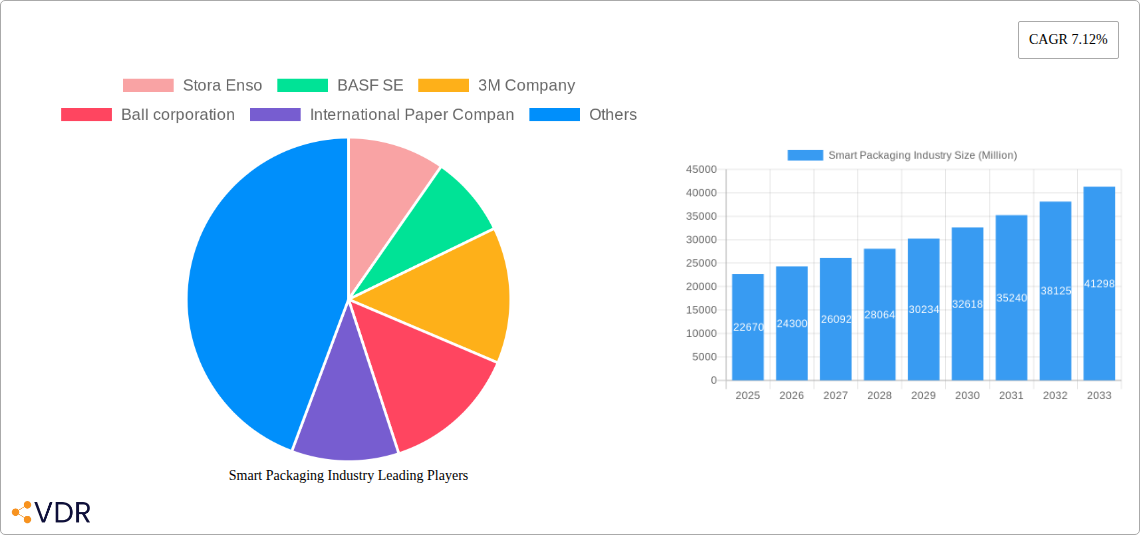
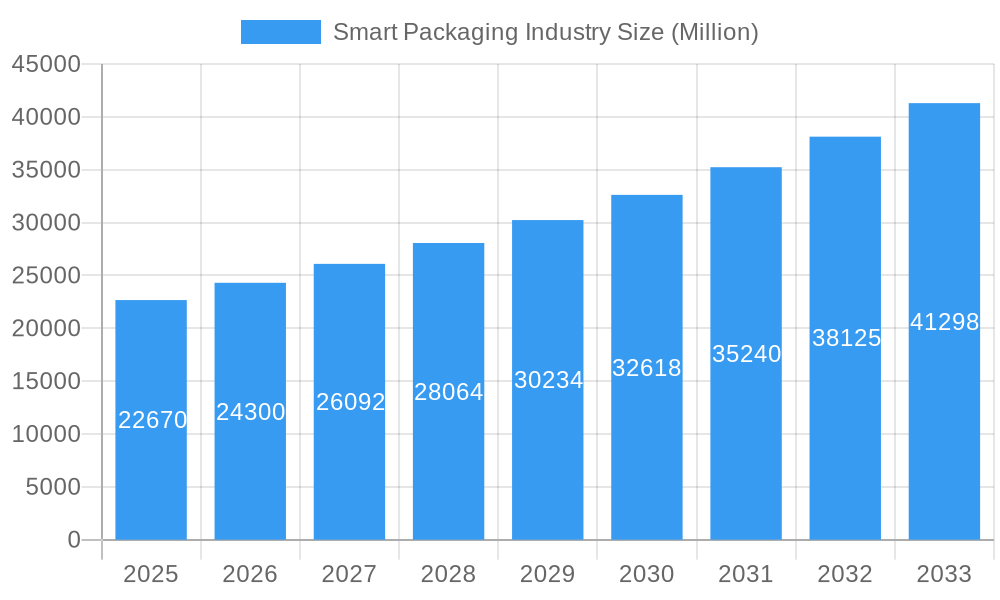
The smart packaging market, valued at $22.67 billion in 2025, is experiencing robust growth, projected to expand at a compound annual growth rate (CAGR) of 7.12% from 2025 to 2033. This expansion is driven by several key factors. The increasing demand for enhanced product safety and security, particularly within the food and beverage sectors, is a primary catalyst. Consumers are increasingly seeking transparent information about product origins, expiry dates, and handling conditions, fueling the adoption of technologies like active and intelligent packaging that provide this information. Furthermore, the growing e-commerce sector necessitates sophisticated packaging solutions for secure and efficient delivery, thereby boosting market growth. Technological advancements in sensor technology, RFID tags, and data analytics are also contributing significantly, enabling the creation of more sophisticated and interconnected packaging solutions. The healthcare sector represents a significant growth opportunity, driven by the need for tamper-evident and temperature-sensitive packaging for pharmaceuticals and medical devices. Competition among major players like Stora Enso, BASF SE, 3M Company, and Amcor PLC is fostering innovation and driving down costs, making smart packaging solutions more accessible across various industries.
Smart Packaging Industry Market Size (In Billion)
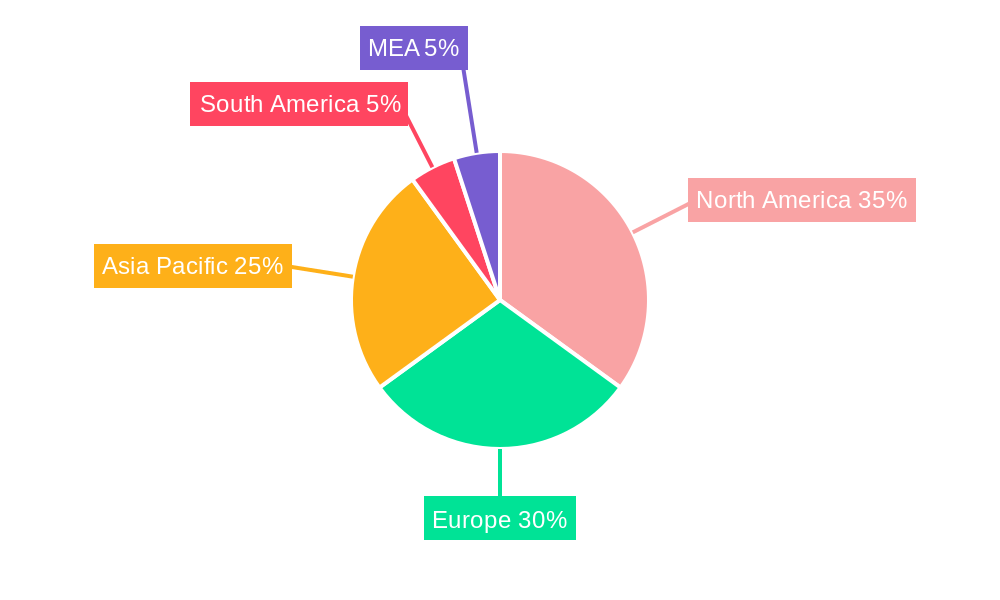
Regional market dynamics are also shaping the growth trajectory. North America and Europe currently hold substantial market shares, driven by early adoption and advanced infrastructure. However, the Asia-Pacific region is poised for significant growth, fueled by expanding manufacturing sectors and a rising middle class with increased disposable income. While regulatory hurdles and the initial high cost of implementation present some challenges, the long-term benefits of improved supply chain efficiency, reduced waste, and enhanced consumer experience are outweighing these concerns, ensuring continued expansion of the smart packaging market throughout the forecast period. The market segmentation by technology (active and intelligent packaging) and end-user vertical (food, beverage, healthcare, personal care) provides a detailed understanding of the specific growth drivers within each segment, allowing businesses to tailor their strategies effectively.
Smart Packaging Industry Company Market Share
Smart Packaging Industry Market Report: 2019-2033
This comprehensive report provides a detailed analysis of the Smart Packaging market, encompassing market dynamics, growth trends, regional dominance, product landscape, key players, and future outlook. The study period covers 2019-2033, with 2025 as the base and estimated year. This report is crucial for industry professionals, investors, and strategists seeking to understand and capitalize on the burgeoning opportunities within this dynamic sector. The report's parent market is the Packaging industry, while the child market is Smart Packaging, offering a granular view of this specific, high-growth area. The market size is projected to reach xx Million units by 2033.
Smart Packaging Industry Market Dynamics & Structure
The smart packaging market is characterized by moderate concentration, with key players holding significant market share. Technological innovation, driven by advancements in RFID, sensors, and connected packaging, is a primary growth driver. Stringent regulatory frameworks concerning sustainability and food safety significantly impact market dynamics. Competitive pressures stem from substitutes like traditional packaging, but smart packaging’s superior functionalities and traceability are mitigating these challenges. End-user demographics heavily influence market segmentation, with the food and beverage sector currently leading. M&A activity is moderate, with strategic acquisitions aimed at expanding technology portfolios and market reach.
- Market Concentration: Moderately concentrated, with top 10 players holding approximately 60% market share (2024 estimate).
- Technological Innovation: Key drivers include advancements in RFID, sensors, and connected packaging technologies.
- Regulatory Framework: Stringent regulations on food safety and sustainability are shaping market trends.
- Competitive Substitutes: Traditional packaging materials pose competitive pressure, yet smart packaging's benefits are creating differentiation.
- M&A Trends: Moderate M&A activity, focused on technology acquisitions and market expansion. Approximately xx deals were recorded between 2019-2024.
Smart Packaging Industry Growth Trends & Insights
The smart packaging market exhibits robust growth, fueled by increasing demand for enhanced product traceability, improved supply chain efficiency, and consumer preference for convenience and information. The market experienced a CAGR of xx% during the historical period (2019-2024) and is projected to maintain a CAGR of xx% during the forecast period (2025-2033). Market penetration is steadily increasing across various end-user verticals, driven by technological advancements and rising consumer awareness. Technological disruptions, such as the integration of AI and blockchain, are further accelerating growth. Consumer behavior shifts towards sustainable and digitally connected products are key contributors to market expansion.
Dominant Regions, Countries, or Segments in Smart Packaging Industry
North America currently holds the largest market share in the smart packaging industry, driven by robust technological infrastructure, high consumer adoption rates, and a strong presence of key players. Within technologies, Intelligent Packaging holds a larger market share compared to Active Packaging due to its wider range of applications and relatively lower cost. The food and beverage sector is the dominant end-user vertical, fueled by stringent regulations and increasing consumer demand for product information and traceability. Europe and Asia Pacific are also experiencing significant growth, driven by increasing investments in smart packaging solutions and rising consumer awareness.
- North America: Strong technological infrastructure, high consumer adoption, and key player presence drive dominance.
- Europe: Growing demand for sustainable packaging and stringent regulations fuel market expansion.
- Asia Pacific: Increasing investments in smart packaging solutions and rising consumer awareness drive growth.
- Dominant Technology Segment: Intelligent Packaging (xx Million units in 2025) leads due to wider application and cost-effectiveness.
- Dominant End-user Vertical: Food and Beverage (xx Million units in 2025) leads due to stringent regulations and consumer demand.
Smart Packaging Industry Product Landscape
Smart packaging solutions encompass a diverse range of products, including RFID tags, sensors, and connected packaging systems. These products offer functionalities such as real-time tracking, temperature monitoring, and tamper evidence, enhancing product safety and supply chain efficiency. Technological advancements are focused on miniaturization, improved sensor accuracy, and enhanced data analytics capabilities. Unique selling propositions include improved product traceability, reduced waste, and enhanced consumer experience.
Key Drivers, Barriers & Challenges in Smart Packaging Industry
Key Drivers: Increasing demand for product traceability, improved supply chain efficiency, stringent food safety regulations, and growing consumer preference for convenience and information drive market growth. Technological advancements, such as the integration of IoT and AI, further contribute to market expansion.
Key Challenges: High initial investment costs, technological complexities, concerns about data security and privacy, and the need for robust infrastructure limit market adoption. Supply chain disruptions and regulatory complexities add to the challenges. Competition from traditional packaging materials also presents a significant hurdle. (Estimated impact of supply chain issues: xx% reduction in market growth in 2024).
Emerging Opportunities in Smart Packaging Industry
Untapped markets in developing economies, particularly in the pharmaceutical and healthcare sectors, offer significant growth opportunities. Innovative applications, such as personalized packaging and interactive labels, are further driving market expansion. Evolving consumer preferences towards sustainable and ethical products present additional opportunities for businesses to offer eco-friendly and transparent smart packaging solutions.
Growth Accelerators in the Smart Packaging Industry
Technological breakthroughs, such as the development of advanced sensors and improved data analytics capabilities, are major catalysts for market growth. Strategic partnerships between packaging manufacturers, technology providers, and brand owners are enhancing innovation and market penetration. Expansion strategies focused on developing regions and untapped market segments are creating new avenues for growth.
Key Players Shaping the Smart Packaging Industry Market
- Stora Enso
- BASF SE
- 3M Company
- Ball corporation
- International Paper Company
- Amcor PLC
- Avery Dennison Corporation
- Huhtamaki OYJ
- Zebra Technologies Corporation
- Sealed Air Corporation
Notable Milestones in Smart Packaging Industry Sector
- January 2023: Avery Dennison announced a major investment exceeding USD 100 million to expand its RFID manufacturing capacity in Mexico, aiming to become the world's largest RFID provider. This strengthens its position in connected supply chains.
- March 2023: Amcor partnered with NfiniteNanotechnology Inc. to research nanocoating technology for improved recyclable and compostable packaging, highlighting a commitment to sustainability.
In-Depth Smart Packaging Industry Market Outlook
The smart packaging market is poised for continued strong growth, driven by technological advancements, rising consumer demand, and increasing regulatory pressure. Strategic partnerships, expansion into emerging markets, and the development of sustainable solutions will be crucial for success. The market's future potential is significant, with opportunities for innovation and market leadership across various segments and geographical regions.
Smart Packaging Industry Segmentation
-
1. Technology
- 1.1. Active Packaging
- 1.2. Intelligent Packaging
-
2. End-user Vertical
- 2.1. Food
- 2.2. Beverage
- 2.3. Healthcare
- 2.4. Personal Care
- 2.5. Other End-user Verticals
Smart Packaging Industry Segmentation By Geography
-
1. North America
- 1.1. United States
- 1.2. Canada
-
2. Europe
- 2.1. Germany
- 2.2. United Kingdom
- 2.3. France
- 2.4. Rest of Europe
-
3. Asia Pacific
- 3.1. China
- 3.2. Japan
- 3.3. India
- 3.4. Rest of Asia Pacific
- 4. Latin America
- 5. Middle East and Africa
Smart Packaging Industry Regional Market Share
Geographic Coverage of Smart Packaging Industry
Smart Packaging Industry REPORT HIGHLIGHTS
| Aspects | Details |
|---|---|
| Study Period | 2020-2034 |
| Base Year | 2025 |
| Estimated Year | 2026 |
| Forecast Period | 2026-2034 |
| Historical Period | 2020-2025 |
| Growth Rate | CAGR of 7.12% from 2020-2034 |
| Segmentation |
|
Table of Contents
- 1. Introduction
- 1.1. Research Scope
- 1.2. Market Segmentation
- 1.3. Research Objective
- 1.4. Definitions and Assumptions
- 2. Executive Summary
- 2.1. Market Snapshot
- 3. Market Dynamics
- 3.1. Market Drivers
- 3.2. Market Restrains
- 3.3. Market Trends
- 3.4. Market Opportunities
- 4. Market Factor Analysis
- 4.1. Porters Five Forces
- 4.1.1. Bargaining Power of Suppliers
- 4.1.2. Bargaining Power of Buyers
- 4.1.3. Threat of New Entrants
- 4.1.4. Threat of Substitutes
- 4.1.5. Competitive Rivalry
- 4.2. PESTEL analysis
- 4.3. BCG Analysis
- 4.3.1. Stars (High Growth, High Market Share)
- 4.3.2. Cash Cows (Low Growth, High Market Share)
- 4.3.3. Question Mark (High Growth, Low Market Share)
- 4.3.4. Dogs (Low Growth, Low Market Share)
- 4.4. Ansoff Matrix Analysis
- 4.5. Supply Chain Analysis
- 4.6. Regulatory Landscape
- 4.7. Current Market Potential and Opportunity Assessment (TAM–SAM–SOM Framework)
- 4.8. VDR Analyst Note
- 4.1. Porters Five Forces
- 5. Market Analysis, Insights and Forecast 2021-2033
- 5.1. Market Analysis, Insights and Forecast - by Technology
- 5.1.1. Active Packaging
- 5.1.2. Intelligent Packaging
- 5.2. Market Analysis, Insights and Forecast - by End-user Vertical
- 5.2.1. Food
- 5.2.2. Beverage
- 5.2.3. Healthcare
- 5.2.4. Personal Care
- 5.2.5. Other End-user Verticals
- 5.3. Market Analysis, Insights and Forecast - by Region
- 5.3.1. North America
- 5.3.2. Europe
- 5.3.3. Asia Pacific
- 5.3.4. Latin America
- 5.3.5. Middle East and Africa
- 5.1. Market Analysis, Insights and Forecast - by Technology
- 6. Global Smart Packaging Industry Analysis, Insights and Forecast, 2021-2033
- 6.1. Market Analysis, Insights and Forecast - by Technology
- 6.1.1. Active Packaging
- 6.1.2. Intelligent Packaging
- 6.2. Market Analysis, Insights and Forecast - by End-user Vertical
- 6.2.1. Food
- 6.2.2. Beverage
- 6.2.3. Healthcare
- 6.2.4. Personal Care
- 6.2.5. Other End-user Verticals
- 6.1. Market Analysis, Insights and Forecast - by Technology
- 7. North America Smart Packaging Industry Analysis, Insights and Forecast, 2021-2033
- 7.1. Market Analysis, Insights and Forecast - by Technology
- 7.1.1. Active Packaging
- 7.1.2. Intelligent Packaging
- 7.2. Market Analysis, Insights and Forecast - by End-user Vertical
- 7.2.1. Food
- 7.2.2. Beverage
- 7.2.3. Healthcare
- 7.2.4. Personal Care
- 7.2.5. Other End-user Verticals
- 7.1. Market Analysis, Insights and Forecast - by Technology
- 8. Europe Smart Packaging Industry Analysis, Insights and Forecast, 2021-2033
- 8.1. Market Analysis, Insights and Forecast - by Technology
- 8.1.1. Active Packaging
- 8.1.2. Intelligent Packaging
- 8.2. Market Analysis, Insights and Forecast - by End-user Vertical
- 8.2.1. Food
- 8.2.2. Beverage
- 8.2.3. Healthcare
- 8.2.4. Personal Care
- 8.2.5. Other End-user Verticals
- 8.1. Market Analysis, Insights and Forecast - by Technology
- 9. Asia Pacific Smart Packaging Industry Analysis, Insights and Forecast, 2021-2033
- 9.1. Market Analysis, Insights and Forecast - by Technology
- 9.1.1. Active Packaging
- 9.1.2. Intelligent Packaging
- 9.2. Market Analysis, Insights and Forecast - by End-user Vertical
- 9.2.1. Food
- 9.2.2. Beverage
- 9.2.3. Healthcare
- 9.2.4. Personal Care
- 9.2.5. Other End-user Verticals
- 9.1. Market Analysis, Insights and Forecast - by Technology
- 10. Latin America Smart Packaging Industry Analysis, Insights and Forecast, 2021-2033
- 10.1. Market Analysis, Insights and Forecast - by Technology
- 10.1.1. Active Packaging
- 10.1.2. Intelligent Packaging
- 10.2. Market Analysis, Insights and Forecast - by End-user Vertical
- 10.2.1. Food
- 10.2.2. Beverage
- 10.2.3. Healthcare
- 10.2.4. Personal Care
- 10.2.5. Other End-user Verticals
- 10.1. Market Analysis, Insights and Forecast - by Technology
- 11. Middle East and Africa Smart Packaging Industry Analysis, Insights and Forecast, 2021-2033
- 11.1. Market Analysis, Insights and Forecast - by Technology
- 11.1.1. Active Packaging
- 11.1.2. Intelligent Packaging
- 11.2. Market Analysis, Insights and Forecast - by End-user Vertical
- 11.2.1. Food
- 11.2.2. Beverage
- 11.2.3. Healthcare
- 11.2.4. Personal Care
- 11.2.5. Other End-user Verticals
- 11.1. Market Analysis, Insights and Forecast - by Technology
- 12. Competitive Analysis
- 12.1. Company Profiles
- 12.1.1 Stora Enso
- 12.1.1.1. Company Overview
- 12.1.1.2. Products
- 12.1.1.3. Company Financials
- 12.1.1.4. SWOT Analysis
- 12.1.2 BASF SE
- 12.1.2.1. Company Overview
- 12.1.2.2. Products
- 12.1.2.3. Company Financials
- 12.1.2.4. SWOT Analysis
- 12.1.3 3M Company
- 12.1.3.1. Company Overview
- 12.1.3.2. Products
- 12.1.3.3. Company Financials
- 12.1.3.4. SWOT Analysis
- 12.1.4 Ball corporation
- 12.1.4.1. Company Overview
- 12.1.4.2. Products
- 12.1.4.3. Company Financials
- 12.1.4.4. SWOT Analysis
- 12.1.5 International Paper Compan
- 12.1.5.1. Company Overview
- 12.1.5.2. Products
- 12.1.5.3. Company Financials
- 12.1.5.4. SWOT Analysis
- 12.1.6 Amcor PLC
- 12.1.6.1. Company Overview
- 12.1.6.2. Products
- 12.1.6.3. Company Financials
- 12.1.6.4. SWOT Analysis
- 12.1.7 Avery Dennison Corporation
- 12.1.7.1. Company Overview
- 12.1.7.2. Products
- 12.1.7.3. Company Financials
- 12.1.7.4. SWOT Analysis
- 12.1.8 Huhtamaki OYJ
- 12.1.8.1. Company Overview
- 12.1.8.2. Products
- 12.1.8.3. Company Financials
- 12.1.8.4. SWOT Analysis
- 12.1.9 Zebra Technologies Corporation
- 12.1.9.1. Company Overview
- 12.1.9.2. Products
- 12.1.9.3. Company Financials
- 12.1.9.4. SWOT Analysis
- 12.1.10 Sealed Air Corporation
- 12.1.10.1. Company Overview
- 12.1.10.2. Products
- 12.1.10.3. Company Financials
- 12.1.10.4. SWOT Analysis
- 12.1.1 Stora Enso
- 12.2. Market Entropy
- 12.2.1 Company's Key Areas Served
- 12.2.2 Recent Developments
- 12.3. Company Market Share Analysis 2025
- 12.3.1 Top 5 Companies Market Share Analysis
- 12.3.2 Top 3 Companies Market Share Analysis
- 12.4. List of Potential Customers
- 13. Research Methodology
List of Figures
- Figure 1: Global Smart Packaging Industry Revenue Breakdown (Million, %) by Region 2025 & 2033
- Figure 2: North America Smart Packaging Industry Revenue (Million), by Technology 2025 & 2033
- Figure 3: North America Smart Packaging Industry Revenue Share (%), by Technology 2025 & 2033
- Figure 4: North America Smart Packaging Industry Revenue (Million), by End-user Vertical 2025 & 2033
- Figure 5: North America Smart Packaging Industry Revenue Share (%), by End-user Vertical 2025 & 2033
- Figure 6: North America Smart Packaging Industry Revenue (Million), by Country 2025 & 2033
- Figure 7: North America Smart Packaging Industry Revenue Share (%), by Country 2025 & 2033
- Figure 8: Europe Smart Packaging Industry Revenue (Million), by Technology 2025 & 2033
- Figure 9: Europe Smart Packaging Industry Revenue Share (%), by Technology 2025 & 2033
- Figure 10: Europe Smart Packaging Industry Revenue (Million), by End-user Vertical 2025 & 2033
- Figure 11: Europe Smart Packaging Industry Revenue Share (%), by End-user Vertical 2025 & 2033
- Figure 12: Europe Smart Packaging Industry Revenue (Million), by Country 2025 & 2033
- Figure 13: Europe Smart Packaging Industry Revenue Share (%), by Country 2025 & 2033
- Figure 14: Asia Pacific Smart Packaging Industry Revenue (Million), by Technology 2025 & 2033
- Figure 15: Asia Pacific Smart Packaging Industry Revenue Share (%), by Technology 2025 & 2033
- Figure 16: Asia Pacific Smart Packaging Industry Revenue (Million), by End-user Vertical 2025 & 2033
- Figure 17: Asia Pacific Smart Packaging Industry Revenue Share (%), by End-user Vertical 2025 & 2033
- Figure 18: Asia Pacific Smart Packaging Industry Revenue (Million), by Country 2025 & 2033
- Figure 19: Asia Pacific Smart Packaging Industry Revenue Share (%), by Country 2025 & 2033
- Figure 20: Latin America Smart Packaging Industry Revenue (Million), by Technology 2025 & 2033
- Figure 21: Latin America Smart Packaging Industry Revenue Share (%), by Technology 2025 & 2033
- Figure 22: Latin America Smart Packaging Industry Revenue (Million), by End-user Vertical 2025 & 2033
- Figure 23: Latin America Smart Packaging Industry Revenue Share (%), by End-user Vertical 2025 & 2033
- Figure 24: Latin America Smart Packaging Industry Revenue (Million), by Country 2025 & 2033
- Figure 25: Latin America Smart Packaging Industry Revenue Share (%), by Country 2025 & 2033
- Figure 26: Middle East and Africa Smart Packaging Industry Revenue (Million), by Technology 2025 & 2033
- Figure 27: Middle East and Africa Smart Packaging Industry Revenue Share (%), by Technology 2025 & 2033
- Figure 28: Middle East and Africa Smart Packaging Industry Revenue (Million), by End-user Vertical 2025 & 2033
- Figure 29: Middle East and Africa Smart Packaging Industry Revenue Share (%), by End-user Vertical 2025 & 2033
- Figure 30: Middle East and Africa Smart Packaging Industry Revenue (Million), by Country 2025 & 2033
- Figure 31: Middle East and Africa Smart Packaging Industry Revenue Share (%), by Country 2025 & 2033
List of Tables
- Table 1: Global Smart Packaging Industry Revenue Million Forecast, by Technology 2020 & 2033
- Table 2: Global Smart Packaging Industry Revenue Million Forecast, by End-user Vertical 2020 & 2033
- Table 3: Global Smart Packaging Industry Revenue Million Forecast, by Region 2020 & 2033
- Table 4: Global Smart Packaging Industry Revenue Million Forecast, by Technology 2020 & 2033
- Table 5: Global Smart Packaging Industry Revenue Million Forecast, by End-user Vertical 2020 & 2033
- Table 6: Global Smart Packaging Industry Revenue Million Forecast, by Country 2020 & 2033
- Table 7: United States Smart Packaging Industry Revenue (Million) Forecast, by Application 2020 & 2033
- Table 8: Canada Smart Packaging Industry Revenue (Million) Forecast, by Application 2020 & 2033
- Table 9: Global Smart Packaging Industry Revenue Million Forecast, by Technology 2020 & 2033
- Table 10: Global Smart Packaging Industry Revenue Million Forecast, by End-user Vertical 2020 & 2033
- Table 11: Global Smart Packaging Industry Revenue Million Forecast, by Country 2020 & 2033
- Table 12: Germany Smart Packaging Industry Revenue (Million) Forecast, by Application 2020 & 2033
- Table 13: United Kingdom Smart Packaging Industry Revenue (Million) Forecast, by Application 2020 & 2033
- Table 14: France Smart Packaging Industry Revenue (Million) Forecast, by Application 2020 & 2033
- Table 15: Rest of Europe Smart Packaging Industry Revenue (Million) Forecast, by Application 2020 & 2033
- Table 16: Global Smart Packaging Industry Revenue Million Forecast, by Technology 2020 & 2033
- Table 17: Global Smart Packaging Industry Revenue Million Forecast, by End-user Vertical 2020 & 2033
- Table 18: Global Smart Packaging Industry Revenue Million Forecast, by Country 2020 & 2033
- Table 19: China Smart Packaging Industry Revenue (Million) Forecast, by Application 2020 & 2033
- Table 20: Japan Smart Packaging Industry Revenue (Million) Forecast, by Application 2020 & 2033
- Table 21: India Smart Packaging Industry Revenue (Million) Forecast, by Application 2020 & 2033
- Table 22: Rest of Asia Pacific Smart Packaging Industry Revenue (Million) Forecast, by Application 2020 & 2033
- Table 23: Global Smart Packaging Industry Revenue Million Forecast, by Technology 2020 & 2033
- Table 24: Global Smart Packaging Industry Revenue Million Forecast, by End-user Vertical 2020 & 2033
- Table 25: Global Smart Packaging Industry Revenue Million Forecast, by Country 2020 & 2033
- Table 26: Global Smart Packaging Industry Revenue Million Forecast, by Technology 2020 & 2033
- Table 27: Global Smart Packaging Industry Revenue Million Forecast, by End-user Vertical 2020 & 2033
- Table 28: Global Smart Packaging Industry Revenue Million Forecast, by Country 2020 & 2033
Frequently Asked Questions
1. What is the projected Compound Annual Growth Rate (CAGR) of the Smart Packaging Industry?
The projected CAGR is approximately 7.12%.
2. Which companies are prominent players in the Smart Packaging Industry?
Key companies in the market include Stora Enso, BASF SE, 3M Company, Ball corporation, International Paper Compan, Amcor PLC, Avery Dennison Corporation, Huhtamaki OYJ, Zebra Technologies Corporation, Sealed Air Corporation.
3. What are the main segments of the Smart Packaging Industry?
The market segments include Technology, End-user Vertical.
4. Can you provide details about the market size?
The market size is estimated to be USD 22.67 Million as of 2022.
5. What are some drivers contributing to market growth?
Advancement in Technology in Food Packaging for Quality Inspection; Rising Awareness Regarding Food Safety; Development in the Printing Industry Due to Various Applications of Smart Packaging.
6. What are the notable trends driving market growth?
Active Packaging to Hold Major Share in the Market.
7. Are there any restraints impacting market growth?
High Costs Due to Initial Requirement.
8. Can you provide examples of recent developments in the market?
March 2023: Amcor, a company that creates and manufactures environment-friendly packaging solutions, announced a joint research project agreement with NfiniteNanotechnology Inc. to validate the application of Nfinite's nanocoating technology to improve packaging that can be recycled and composted.
9. What pricing options are available for accessing the report?
Pricing options include single-user, multi-user, and enterprise licenses priced at USD 4750, USD 5250, and USD 8750 respectively.
10. Is the market size provided in terms of value or volume?
The market size is provided in terms of value, measured in Million.
11. Are there any specific market keywords associated with the report?
Yes, the market keyword associated with the report is "Smart Packaging Industry," which aids in identifying and referencing the specific market segment covered.
12. How do I determine which pricing option suits my needs best?
The pricing options vary based on user requirements and access needs. Individual users may opt for single-user licenses, while businesses requiring broader access may choose multi-user or enterprise licenses for cost-effective access to the report.
13. Are there any additional resources or data provided in the Smart Packaging Industry report?
While the report offers comprehensive insights, it's advisable to review the specific contents or supplementary materials provided to ascertain if additional resources or data are available.
14. How can I stay updated on further developments or reports in the Smart Packaging Industry?
To stay informed about further developments, trends, and reports in the Smart Packaging Industry, consider subscribing to industry newsletters, following relevant companies and organizations, or regularly checking reputable industry news sources and publications.
Methodology
Step 1 - Identification of Relevant Samples Size from Population Database


Step 2 - Approaches for Defining Global Market Size (Value, Volume* & Price*)

Note*: In applicable scenarios
Step 3 - Data Sources
Primary Research
- Web Analytics
- Survey Reports
- Research Institute
- Latest Research Reports
- Opinion Leaders
Secondary Research
- Annual Reports
- White Paper
- Latest Press Release
- Industry Association
- Paid Database
- Investor Presentations

Step 4 - Data Triangulation
Involves using different sources of information in order to increase the validity of a study
These sources are likely to be stakeholders in a program - participants, other researchers, program staff, other community members, and so on.
Then we put all data in single framework & apply various statistical tools to find out the dynamic on the market.
During the analysis stage, feedback from the stakeholder groups would be compared to determine areas of agreement as well as areas of divergence