
Key Insights
The global smart healthcare market is experiencing robust growth, driven by the increasing prevalence of chronic diseases, rising demand for remote patient monitoring, and the escalating adoption of digital health technologies. The market's Compound Annual Growth Rate (CAGR) of 8.50% from 2019 to 2024 suggests a significant expansion, projecting substantial market value by 2033. Key drivers include advancements in telemedicine, enabling remote consultations and diagnosis; the proliferation of electronic health records (EHRs) improving data management and patient care; and the growing popularity of mHealth applications offering convenient and accessible healthcare services. Furthermore, the emergence of innovative technologies like smart pills and syringes, smart RFID cabinets for efficient inventory management, and sophisticated data analytics contribute to this market expansion. While data security concerns and high initial investment costs present certain restraints, the overall market outlook remains positive, fueled by government initiatives promoting digital healthcare adoption and increasing investments in research and development. The market is segmented by product type (telemedicine, EHRs, mHealth, etc.), application (monitoring, treatment, etc.), and end-user (hospitals, home care, etc.), offering diverse growth opportunities across various segments. North America currently holds a significant market share, due to advanced healthcare infrastructure and high technology adoption rates, but the Asia-Pacific region is projected to witness significant growth in the coming years, driven by increasing healthcare spending and expanding internet penetration.
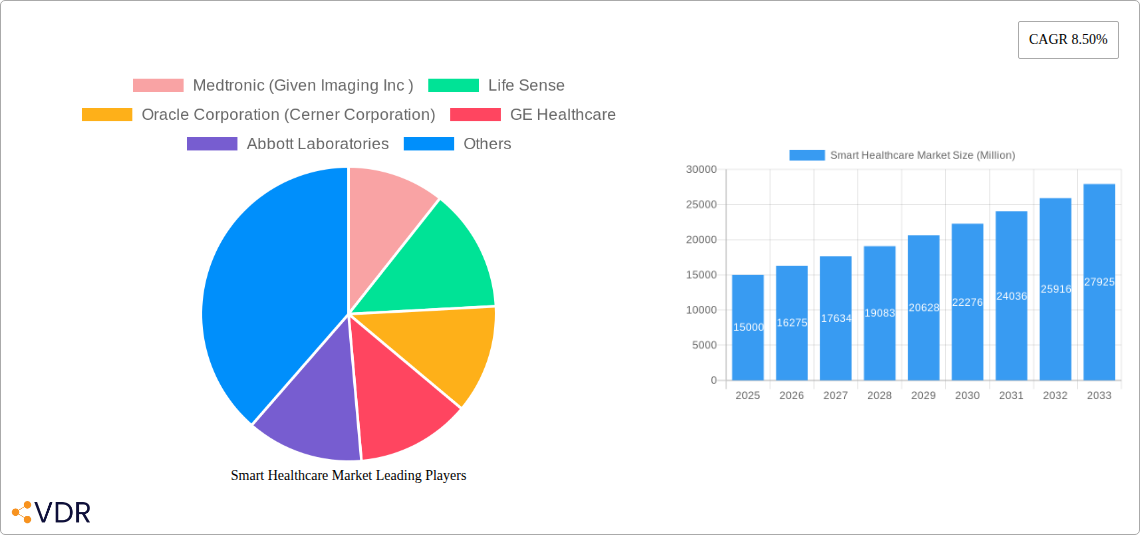
The competitive landscape is characterized by a mix of established players like Medtronic, GE Healthcare, and Philips, alongside emerging companies specializing in specific niche technologies. Strategic partnerships and acquisitions are likely to intensify as companies strive to expand their product portfolios and enhance their market presence. The future of the smart healthcare market hinges on continued technological advancements, favorable regulatory environments, and the increasing acceptance of digital healthcare solutions by both patients and healthcare providers. The focus on personalized medicine, predictive analytics, and improved patient engagement will further shape the market's trajectory in the years to come, fostering growth and innovation across the entire ecosystem. Addressing challenges like data interoperability and ensuring cybersecurity will remain crucial for sustaining long-term growth and building trust in digital healthcare solutions.
Smart Healthcare Market: A Comprehensive Report (2019-2033)
This in-depth report provides a comprehensive analysis of the Smart Healthcare Market, encompassing market dynamics, growth trends, regional dominance, product landscapes, key players, and future outlook. The study period spans 2019-2033, with a base year of 2025 and a forecast period of 2025-2033. The report segments the market by Product Type (Telemedicine, Electronic Health Records (EHR), mHealth, Smart Pills and Syringes, Smart RFID Cabinets, Other Product Types), Application (Storage and Inventory Management, Monitoring, Treatment, Other Applications), and End User (Hospitals, Home Care Settings, Other End Users). The market is projected to reach xx Million by 2033, exhibiting a promising CAGR of xx%.
Smart Healthcare Market Dynamics & Structure
The Smart Healthcare market is characterized by moderate concentration, with key players such as Medtronic, GE Healthcare, and Philips holding significant market share. However, the market is witnessing increased competition from smaller, agile companies specializing in niche areas like mHealth and smart pills. Technological innovation, particularly in AI and IoT, is a primary growth driver, while stringent regulatory frameworks and data privacy concerns act as significant barriers. The rise of telehealth during the pandemic accelerated adoption, and mergers & acquisitions (M&A) activity is expected to further consolidate the market.
- Market Concentration: Moderately concentrated, with top 5 players holding approximately xx% market share in 2024.
- Technological Innovation: AI, IoT, and big data analytics drive product development and efficiency gains.
- Regulatory Landscape: HIPAA, GDPR, and other regulations influence data security and interoperability.
- Competitive Substitutes: Traditional healthcare systems and legacy technologies pose competition.
- M&A Activity: xx major M&A deals were recorded between 2019-2024, indicating consolidation trends. xx% of these deals involved companies focused on EHR and Telemedicine.
- End-User Demographics: Growing geriatric population and rising prevalence of chronic diseases fuel market demand.
Smart Healthcare Market Growth Trends & Insights
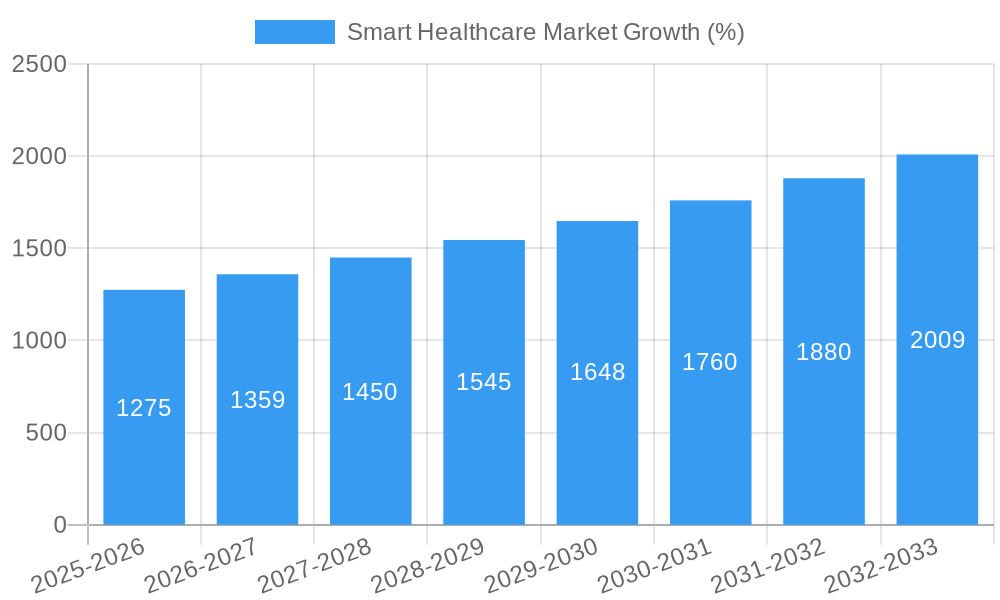
The Smart Healthcare market experienced significant growth during the historical period (2019-2024), driven primarily by increased healthcare spending, technological advancements, and growing awareness among consumers about health monitoring and preventive care. The COVID-19 pandemic further accelerated market growth, particularly in telemedicine and remote patient monitoring segments. This upward trajectory is projected to continue through the forecast period (2025-2033). The adoption rate of smart healthcare technologies is rapidly increasing, particularly in developed economies. However, challenges such as cost constraints, interoperability issues, and concerns regarding data security are hindering broader adoption in some regions.
- Market Size Evolution: Market size grew from xx Million in 2019 to xx Million in 2024, showcasing a CAGR of xx%.
- Adoption Rates: High adoption in developed economies, with xx% market penetration in the US by 2024.
- Technological Disruptions: AI-powered diagnostics and personalized medicine are revolutionizing healthcare delivery.
- Consumer Behavior Shifts: Increasing preference for convenient, accessible, and proactive healthcare solutions.
Dominant Regions, Countries, or Segments in Smart Healthcare Market
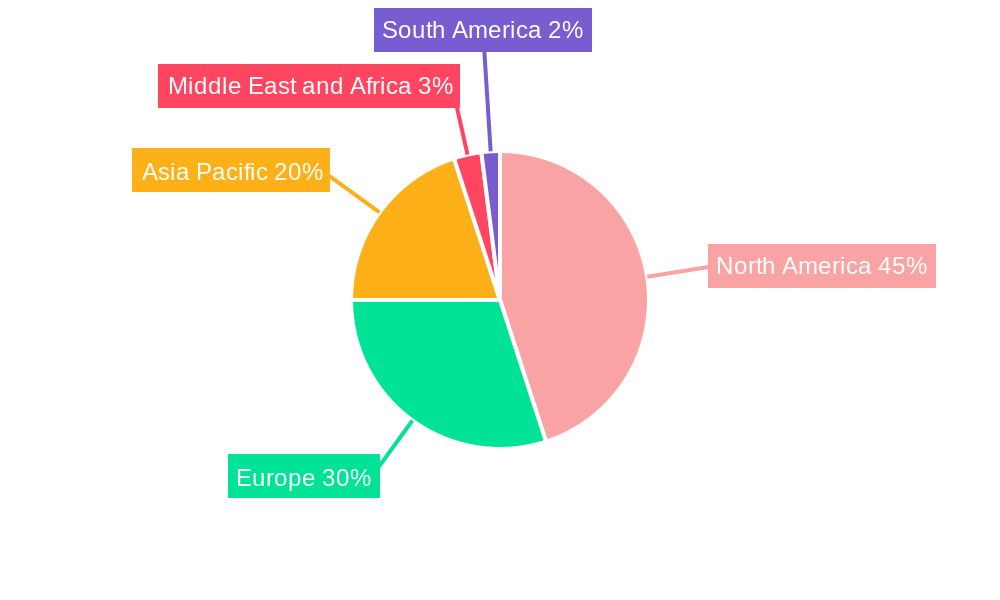
North America currently dominates the Smart Healthcare market, driven by high healthcare expenditure, advanced technological infrastructure, and early adoption of innovative technologies. However, the Asia-Pacific region is expected to exhibit the highest growth rate during the forecast period, fueled by rapid economic growth, increasing healthcare investment, and expanding digital healthcare infrastructure. Within the product segments, telemedicine and EHR are currently leading, while mHealth is projected to witness significant growth driven by smartphone penetration and mobile application development.
- North America: High market share due to advanced infrastructure and high adoption rates (xx% in 2024). Key drivers include robust regulatory frameworks for data privacy and extensive telehealth adoption.
- Europe: Strong growth potential driven by government initiatives promoting digital health and increasing investment in healthcare infrastructure.
- Asia-Pacific: Highest growth rate projected during the forecast period (xx% CAGR), driven by increasing smartphone penetration and affordability of smart devices.
- Dominant Segments: Telemedicine (xx% market share in 2024), EHR (xx%), with mHealth experiencing the fastest growth in adoption rate.
Smart Healthcare Market Product Landscape
The smart healthcare market is characterized by a diverse range of products, including sophisticated telemedicine platforms, advanced EHR systems with AI-powered diagnostics, and innovative mHealth applications that offer remote patient monitoring and personalized health management. Smart pills and syringes enable improved drug delivery and patient adherence, while smart RFID cabinets enhance inventory management and security within healthcare facilities. Continuous innovation, particularly in AI and IoT integration, is enhancing the capabilities and efficiency of these products. The key selling propositions revolve around improving patient outcomes, optimizing healthcare resource utilization, and enhancing operational efficiency.
Key Drivers, Barriers & Challenges in Smart Healthcare Market
Key Drivers:
- Technological advancements in AI, IoT, and big data analytics.
- Rising prevalence of chronic diseases and growing geriatric population.
- Increasing healthcare expenditure and government initiatives to promote digital healthcare.
- Growing demand for convenient, accessible, and personalized healthcare solutions.
Challenges:
- High initial investment costs for implementing smart healthcare technologies.
- Concerns regarding data privacy and security.
- Interoperability issues between different systems and devices.
- Regulatory hurdles and lack of standardized guidelines.
- Supply chain disruptions can impact the availability of components and devices. These disruptions reduced market growth by approximately xx% in 2022.
Emerging Opportunities in Smart Healthcare Market
- Expansion into untapped markets in developing countries.
- Development of innovative applications for remote patient monitoring and chronic disease management.
- Personalized medicine and AI-powered diagnostics offering targeted treatments.
- Integration of blockchain technology to enhance data security and interoperability.
- Growing demand for wearable health monitoring devices and mobile health applications.
Growth Accelerators in the Smart Healthcare Market Industry
Strategic partnerships between technology companies and healthcare providers are accelerating the adoption of smart healthcare technologies. Continuous technological breakthroughs in AI and IoT are expanding the capabilities of existing products and creating new opportunities. Government initiatives promoting digital healthcare and favorable regulatory environments are boosting market growth. Expansion into new markets and innovative business models are further fueling market expansion.
Key Players Shaping the Smart Healthcare Market Market
- Medtronic (Given Imaging Inc)
- Life Sense
- Oracle Corporation (Cerner Corporation)
- GE Healthcare
- Abbott Laboratories
- Siemens Healthineers AG
- Next Gen Healthcare
- Koninklijke Philips NV
- McKesson Corporation
- Olympus Corporation
- Capsule Technologies Inc
- Samsung Healthcare
Notable Milestones in Smart Healthcare Market Sector
- March 2022: Intuitive MB launched its medical building operating system, utilizing IoT, AI, and machine learning to create "smart" hospitals.
- March 2022: Commonwealth Bank introduced Smart Health, a terminal improving payment and claim experiences for Australian health insurers.
In-Depth Smart Healthcare Market Market Outlook
The Smart Healthcare market is poised for significant growth in the coming years, driven by continued technological innovation, increasing healthcare spending, and growing consumer demand for personalized and convenient healthcare solutions. Strategic partnerships, expansion into new markets, and innovative business models will further accelerate market expansion. The focus will be on improving data security, interoperability, and affordability to ensure broader adoption and accessibility. The market will witness a shift towards AI-powered diagnostics, personalized medicine, and preventive healthcare solutions.
Smart Healthcare Market Segmentation
-
1. Product Type
- 1.1. Telemedicine
- 1.2. Electronic Health Records
- 1.3. mHealth
- 1.4. Smart Pills and Syringes
- 1.5. Smart RFID Cabinets
- 1.6. Other Product Types
-
2. Application
- 2.1. Storage and Inventory Management
- 2.2. Monitoring
- 2.3. Treatment
- 2.4. Other Applications
-
3. End User
- 3.1. Hospitals
- 3.2. Home Care Settings
- 3.3. Other End Users
Smart Healthcare Market Segmentation By Geography
-
1. North America
- 1.1. United States
- 1.2. Canada
- 1.3. Mexico
-
2. Europe
- 2.1. Germany
- 2.2. United Kingdom
- 2.3. France
- 2.4. Spain
- 2.5. Italy
- 2.6. Rest of Europe
-
3. Asia Pacific
- 3.1. China
- 3.2. Japan
- 3.3. India
- 3.4. Australia
- 3.5. South Korea
- 3.6. Rest of Asia Pacific
-
4. Middle East and Africa
- 4.1. GCC
- 4.2. South Africa
- 4.3. Rest of Middle East and Africa
-
5. South America
- 5.1. Brazil
- 5.2. Argentina
- 5.3. Rest of South America
Smart Healthcare Market REPORT HIGHLIGHTS
| Aspects | Details |
|---|---|
| Study Period | 2019-2033 |
| Base Year | 2024 |
| Estimated Year | 2025 |
| Forecast Period | 2025-2033 |
| Historical Period | 2019-2024 |
| Growth Rate | CAGR of 8.50% from 2019-2033 |
| Segmentation |
|
Table of Contents
- 1. Introduction
- 1.1. Research Scope
- 1.2. Market Segmentation
- 1.3. Research Methodology
- 1.4. Definitions and Assumptions
- 2. Executive Summary
- 2.1. Introduction
- 3. Market Dynamics
- 3.1. Introduction
- 3.2. Market Drivers
- 3.2.1. Technological Advancements in Smart Healthcare Products; Booming Internet of Things (IoT) in the Healthcare Industry
- 3.3. Market Restrains
- 3.3.1. High Cost of Smart Healthcare Products
- 3.4. Market Trends
- 3.4.1. The mHealth Segment is Expected to Observe Good Growth in the Market
- 4. Market Factor Analysis
- 4.1. Porters Five Forces
- 4.2. Supply/Value Chain
- 4.3. PESTEL analysis
- 4.4. Market Entropy
- 4.5. Patent/Trademark Analysis
- 5. Global Smart Healthcare Market Analysis, Insights and Forecast, 2019-2031
- 5.1. Market Analysis, Insights and Forecast - by Product Type
- 5.1.1. Telemedicine
- 5.1.2. Electronic Health Records
- 5.1.3. mHealth
- 5.1.4. Smart Pills and Syringes
- 5.1.5. Smart RFID Cabinets
- 5.1.6. Other Product Types
- 5.2. Market Analysis, Insights and Forecast - by Application
- 5.2.1. Storage and Inventory Management
- 5.2.2. Monitoring
- 5.2.3. Treatment
- 5.2.4. Other Applications
- 5.3. Market Analysis, Insights and Forecast - by End User
- 5.3.1. Hospitals
- 5.3.2. Home Care Settings
- 5.3.3. Other End Users
- 5.4. Market Analysis, Insights and Forecast - by Region
- 5.4.1. North America
- 5.4.2. Europe
- 5.4.3. Asia Pacific
- 5.4.4. Middle East and Africa
- 5.4.5. South America
- 5.1. Market Analysis, Insights and Forecast - by Product Type
- 6. North America Smart Healthcare Market Analysis, Insights and Forecast, 2019-2031
- 6.1. Market Analysis, Insights and Forecast - by Product Type
- 6.1.1. Telemedicine
- 6.1.2. Electronic Health Records
- 6.1.3. mHealth
- 6.1.4. Smart Pills and Syringes
- 6.1.5. Smart RFID Cabinets
- 6.1.6. Other Product Types
- 6.2. Market Analysis, Insights and Forecast - by Application
- 6.2.1. Storage and Inventory Management
- 6.2.2. Monitoring
- 6.2.3. Treatment
- 6.2.4. Other Applications
- 6.3. Market Analysis, Insights and Forecast - by End User
- 6.3.1. Hospitals
- 6.3.2. Home Care Settings
- 6.3.3. Other End Users
- 6.1. Market Analysis, Insights and Forecast - by Product Type
- 7. Europe Smart Healthcare Market Analysis, Insights and Forecast, 2019-2031
- 7.1. Market Analysis, Insights and Forecast - by Product Type
- 7.1.1. Telemedicine
- 7.1.2. Electronic Health Records
- 7.1.3. mHealth
- 7.1.4. Smart Pills and Syringes
- 7.1.5. Smart RFID Cabinets
- 7.1.6. Other Product Types
- 7.2. Market Analysis, Insights and Forecast - by Application
- 7.2.1. Storage and Inventory Management
- 7.2.2. Monitoring
- 7.2.3. Treatment
- 7.2.4. Other Applications
- 7.3. Market Analysis, Insights and Forecast - by End User
- 7.3.1. Hospitals
- 7.3.2. Home Care Settings
- 7.3.3. Other End Users
- 7.1. Market Analysis, Insights and Forecast - by Product Type
- 8. Asia Pacific Smart Healthcare Market Analysis, Insights and Forecast, 2019-2031
- 8.1. Market Analysis, Insights and Forecast - by Product Type
- 8.1.1. Telemedicine
- 8.1.2. Electronic Health Records
- 8.1.3. mHealth
- 8.1.4. Smart Pills and Syringes
- 8.1.5. Smart RFID Cabinets
- 8.1.6. Other Product Types
- 8.2. Market Analysis, Insights and Forecast - by Application
- 8.2.1. Storage and Inventory Management
- 8.2.2. Monitoring
- 8.2.3. Treatment
- 8.2.4. Other Applications
- 8.3. Market Analysis, Insights and Forecast - by End User
- 8.3.1. Hospitals
- 8.3.2. Home Care Settings
- 8.3.3. Other End Users
- 8.1. Market Analysis, Insights and Forecast - by Product Type
- 9. Middle East and Africa Smart Healthcare Market Analysis, Insights and Forecast, 2019-2031
- 9.1. Market Analysis, Insights and Forecast - by Product Type
- 9.1.1. Telemedicine
- 9.1.2. Electronic Health Records
- 9.1.3. mHealth
- 9.1.4. Smart Pills and Syringes
- 9.1.5. Smart RFID Cabinets
- 9.1.6. Other Product Types
- 9.2. Market Analysis, Insights and Forecast - by Application
- 9.2.1. Storage and Inventory Management
- 9.2.2. Monitoring
- 9.2.3. Treatment
- 9.2.4. Other Applications
- 9.3. Market Analysis, Insights and Forecast - by End User
- 9.3.1. Hospitals
- 9.3.2. Home Care Settings
- 9.3.3. Other End Users
- 9.1. Market Analysis, Insights and Forecast - by Product Type
- 10. South America Smart Healthcare Market Analysis, Insights and Forecast, 2019-2031
- 10.1. Market Analysis, Insights and Forecast - by Product Type
- 10.1.1. Telemedicine
- 10.1.2. Electronic Health Records
- 10.1.3. mHealth
- 10.1.4. Smart Pills and Syringes
- 10.1.5. Smart RFID Cabinets
- 10.1.6. Other Product Types
- 10.2. Market Analysis, Insights and Forecast - by Application
- 10.2.1. Storage and Inventory Management
- 10.2.2. Monitoring
- 10.2.3. Treatment
- 10.2.4. Other Applications
- 10.3. Market Analysis, Insights and Forecast - by End User
- 10.3.1. Hospitals
- 10.3.2. Home Care Settings
- 10.3.3. Other End Users
- 10.1. Market Analysis, Insights and Forecast - by Product Type
- 11. North America Smart Healthcare Market Analysis, Insights and Forecast, 2019-2031
- 11.1. Market Analysis, Insights and Forecast - By Country/Sub-region
- 11.1.1 United States
- 11.1.2 Canada
- 11.1.3 Mexico
- 12. Europe Smart Healthcare Market Analysis, Insights and Forecast, 2019-2031
- 12.1. Market Analysis, Insights and Forecast - By Country/Sub-region
- 12.1.1 Germany
- 12.1.2 United Kingdom
- 12.1.3 France
- 12.1.4 Spain
- 12.1.5 Italy
- 12.1.6 Rest of Europe
- 13. Asia Pacific Smart Healthcare Market Analysis, Insights and Forecast, 2019-2031
- 13.1. Market Analysis, Insights and Forecast - By Country/Sub-region
- 13.1.1 China
- 13.1.2 Japan
- 13.1.3 India
- 13.1.4 Australia
- 13.1.5 South Korea
- 13.1.6 Rest of Asia Pacific
- 14. Middle East and Africa Smart Healthcare Market Analysis, Insights and Forecast, 2019-2031
- 14.1. Market Analysis, Insights and Forecast - By Country/Sub-region
- 14.1.1 GCC
- 14.1.2 South Africa
- 14.1.3 Rest of Middle East and Africa
- 15. South America Smart Healthcare Market Analysis, Insights and Forecast, 2019-2031
- 15.1. Market Analysis, Insights and Forecast - By Country/Sub-region
- 15.1.1 Brazil
- 15.1.2 Argentina
- 15.1.3 Rest of South America
- 16. Competitive Analysis
- 16.1. Global Market Share Analysis 2024
- 16.2. Company Profiles
- 16.2.1 Medtronic (Given Imaging Inc )
- 16.2.1.1. Overview
- 16.2.1.2. Products
- 16.2.1.3. SWOT Analysis
- 16.2.1.4. Recent Developments
- 16.2.1.5. Financials (Based on Availability)
- 16.2.2 Life Sense
- 16.2.2.1. Overview
- 16.2.2.2. Products
- 16.2.2.3. SWOT Analysis
- 16.2.2.4. Recent Developments
- 16.2.2.5. Financials (Based on Availability)
- 16.2.3 Oracle Corporation (Cerner Corporation)
- 16.2.3.1. Overview
- 16.2.3.2. Products
- 16.2.3.3. SWOT Analysis
- 16.2.3.4. Recent Developments
- 16.2.3.5. Financials (Based on Availability)
- 16.2.4 GE Healthcare
- 16.2.4.1. Overview
- 16.2.4.2. Products
- 16.2.4.3. SWOT Analysis
- 16.2.4.4. Recent Developments
- 16.2.4.5. Financials (Based on Availability)
- 16.2.5 Abbott Laboratories
- 16.2.5.1. Overview
- 16.2.5.2. Products
- 16.2.5.3. SWOT Analysis
- 16.2.5.4. Recent Developments
- 16.2.5.5. Financials (Based on Availability)
- 16.2.6 Siemens Healthineers AG
- 16.2.6.1. Overview
- 16.2.6.2. Products
- 16.2.6.3. SWOT Analysis
- 16.2.6.4. Recent Developments
- 16.2.6.5. Financials (Based on Availability)
- 16.2.7 Next Gen Healthcare
- 16.2.7.1. Overview
- 16.2.7.2. Products
- 16.2.7.3. SWOT Analysis
- 16.2.7.4. Recent Developments
- 16.2.7.5. Financials (Based on Availability)
- 16.2.8 Koninklijke Philips NV
- 16.2.8.1. Overview
- 16.2.8.2. Products
- 16.2.8.3. SWOT Analysis
- 16.2.8.4. Recent Developments
- 16.2.8.5. Financials (Based on Availability)
- 16.2.9 McKesson Corporation
- 16.2.9.1. Overview
- 16.2.9.2. Products
- 16.2.9.3. SWOT Analysis
- 16.2.9.4. Recent Developments
- 16.2.9.5. Financials (Based on Availability)
- 16.2.10 Olympus Corporation
- 16.2.10.1. Overview
- 16.2.10.2. Products
- 16.2.10.3. SWOT Analysis
- 16.2.10.4. Recent Developments
- 16.2.10.5. Financials (Based on Availability)
- 16.2.11 Capsule Technologies Inc
- 16.2.11.1. Overview
- 16.2.11.2. Products
- 16.2.11.3. SWOT Analysis
- 16.2.11.4. Recent Developments
- 16.2.11.5. Financials (Based on Availability)
- 16.2.12 Samsung Healthcare
- 16.2.12.1. Overview
- 16.2.12.2. Products
- 16.2.12.3. SWOT Analysis
- 16.2.12.4. Recent Developments
- 16.2.12.5. Financials (Based on Availability)
- 16.2.1 Medtronic (Given Imaging Inc )
List of Figures
- Figure 1: Global Smart Healthcare Market Revenue Breakdown (Million, %) by Region 2024 & 2032
- Figure 2: Global Smart Healthcare Market Volume Breakdown (K Unit, %) by Region 2024 & 2032
- Figure 3: North America Smart Healthcare Market Revenue (Million), by Country 2024 & 2032
- Figure 4: North America Smart Healthcare Market Volume (K Unit), by Country 2024 & 2032
- Figure 5: North America Smart Healthcare Market Revenue Share (%), by Country 2024 & 2032
- Figure 6: North America Smart Healthcare Market Volume Share (%), by Country 2024 & 2032
- Figure 7: Europe Smart Healthcare Market Revenue (Million), by Country 2024 & 2032
- Figure 8: Europe Smart Healthcare Market Volume (K Unit), by Country 2024 & 2032
- Figure 9: Europe Smart Healthcare Market Revenue Share (%), by Country 2024 & 2032
- Figure 10: Europe Smart Healthcare Market Volume Share (%), by Country 2024 & 2032
- Figure 11: Asia Pacific Smart Healthcare Market Revenue (Million), by Country 2024 & 2032
- Figure 12: Asia Pacific Smart Healthcare Market Volume (K Unit), by Country 2024 & 2032
- Figure 13: Asia Pacific Smart Healthcare Market Revenue Share (%), by Country 2024 & 2032
- Figure 14: Asia Pacific Smart Healthcare Market Volume Share (%), by Country 2024 & 2032
- Figure 15: Middle East and Africa Smart Healthcare Market Revenue (Million), by Country 2024 & 2032
- Figure 16: Middle East and Africa Smart Healthcare Market Volume (K Unit), by Country 2024 & 2032
- Figure 17: Middle East and Africa Smart Healthcare Market Revenue Share (%), by Country 2024 & 2032
- Figure 18: Middle East and Africa Smart Healthcare Market Volume Share (%), by Country 2024 & 2032
- Figure 19: South America Smart Healthcare Market Revenue (Million), by Country 2024 & 2032
- Figure 20: South America Smart Healthcare Market Volume (K Unit), by Country 2024 & 2032
- Figure 21: South America Smart Healthcare Market Revenue Share (%), by Country 2024 & 2032
- Figure 22: South America Smart Healthcare Market Volume Share (%), by Country 2024 & 2032
- Figure 23: North America Smart Healthcare Market Revenue (Million), by Product Type 2024 & 2032
- Figure 24: North America Smart Healthcare Market Volume (K Unit), by Product Type 2024 & 2032
- Figure 25: North America Smart Healthcare Market Revenue Share (%), by Product Type 2024 & 2032
- Figure 26: North America Smart Healthcare Market Volume Share (%), by Product Type 2024 & 2032
- Figure 27: North America Smart Healthcare Market Revenue (Million), by Application 2024 & 2032
- Figure 28: North America Smart Healthcare Market Volume (K Unit), by Application 2024 & 2032
- Figure 29: North America Smart Healthcare Market Revenue Share (%), by Application 2024 & 2032
- Figure 30: North America Smart Healthcare Market Volume Share (%), by Application 2024 & 2032
- Figure 31: North America Smart Healthcare Market Revenue (Million), by End User 2024 & 2032
- Figure 32: North America Smart Healthcare Market Volume (K Unit), by End User 2024 & 2032
- Figure 33: North America Smart Healthcare Market Revenue Share (%), by End User 2024 & 2032
- Figure 34: North America Smart Healthcare Market Volume Share (%), by End User 2024 & 2032
- Figure 35: North America Smart Healthcare Market Revenue (Million), by Country 2024 & 2032
- Figure 36: North America Smart Healthcare Market Volume (K Unit), by Country 2024 & 2032
- Figure 37: North America Smart Healthcare Market Revenue Share (%), by Country 2024 & 2032
- Figure 38: North America Smart Healthcare Market Volume Share (%), by Country 2024 & 2032
- Figure 39: Europe Smart Healthcare Market Revenue (Million), by Product Type 2024 & 2032
- Figure 40: Europe Smart Healthcare Market Volume (K Unit), by Product Type 2024 & 2032
- Figure 41: Europe Smart Healthcare Market Revenue Share (%), by Product Type 2024 & 2032
- Figure 42: Europe Smart Healthcare Market Volume Share (%), by Product Type 2024 & 2032
- Figure 43: Europe Smart Healthcare Market Revenue (Million), by Application 2024 & 2032
- Figure 44: Europe Smart Healthcare Market Volume (K Unit), by Application 2024 & 2032
- Figure 45: Europe Smart Healthcare Market Revenue Share (%), by Application 2024 & 2032
- Figure 46: Europe Smart Healthcare Market Volume Share (%), by Application 2024 & 2032
- Figure 47: Europe Smart Healthcare Market Revenue (Million), by End User 2024 & 2032
- Figure 48: Europe Smart Healthcare Market Volume (K Unit), by End User 2024 & 2032
- Figure 49: Europe Smart Healthcare Market Revenue Share (%), by End User 2024 & 2032
- Figure 50: Europe Smart Healthcare Market Volume Share (%), by End User 2024 & 2032
- Figure 51: Europe Smart Healthcare Market Revenue (Million), by Country 2024 & 2032
- Figure 52: Europe Smart Healthcare Market Volume (K Unit), by Country 2024 & 2032
- Figure 53: Europe Smart Healthcare Market Revenue Share (%), by Country 2024 & 2032
- Figure 54: Europe Smart Healthcare Market Volume Share (%), by Country 2024 & 2032
- Figure 55: Asia Pacific Smart Healthcare Market Revenue (Million), by Product Type 2024 & 2032
- Figure 56: Asia Pacific Smart Healthcare Market Volume (K Unit), by Product Type 2024 & 2032
- Figure 57: Asia Pacific Smart Healthcare Market Revenue Share (%), by Product Type 2024 & 2032
- Figure 58: Asia Pacific Smart Healthcare Market Volume Share (%), by Product Type 2024 & 2032
- Figure 59: Asia Pacific Smart Healthcare Market Revenue (Million), by Application 2024 & 2032
- Figure 60: Asia Pacific Smart Healthcare Market Volume (K Unit), by Application 2024 & 2032
- Figure 61: Asia Pacific Smart Healthcare Market Revenue Share (%), by Application 2024 & 2032
- Figure 62: Asia Pacific Smart Healthcare Market Volume Share (%), by Application 2024 & 2032
- Figure 63: Asia Pacific Smart Healthcare Market Revenue (Million), by End User 2024 & 2032
- Figure 64: Asia Pacific Smart Healthcare Market Volume (K Unit), by End User 2024 & 2032
- Figure 65: Asia Pacific Smart Healthcare Market Revenue Share (%), by End User 2024 & 2032
- Figure 66: Asia Pacific Smart Healthcare Market Volume Share (%), by End User 2024 & 2032
- Figure 67: Asia Pacific Smart Healthcare Market Revenue (Million), by Country 2024 & 2032
- Figure 68: Asia Pacific Smart Healthcare Market Volume (K Unit), by Country 2024 & 2032
- Figure 69: Asia Pacific Smart Healthcare Market Revenue Share (%), by Country 2024 & 2032
- Figure 70: Asia Pacific Smart Healthcare Market Volume Share (%), by Country 2024 & 2032
- Figure 71: Middle East and Africa Smart Healthcare Market Revenue (Million), by Product Type 2024 & 2032
- Figure 72: Middle East and Africa Smart Healthcare Market Volume (K Unit), by Product Type 2024 & 2032
- Figure 73: Middle East and Africa Smart Healthcare Market Revenue Share (%), by Product Type 2024 & 2032
- Figure 74: Middle East and Africa Smart Healthcare Market Volume Share (%), by Product Type 2024 & 2032
- Figure 75: Middle East and Africa Smart Healthcare Market Revenue (Million), by Application 2024 & 2032
- Figure 76: Middle East and Africa Smart Healthcare Market Volume (K Unit), by Application 2024 & 2032
- Figure 77: Middle East and Africa Smart Healthcare Market Revenue Share (%), by Application 2024 & 2032
- Figure 78: Middle East and Africa Smart Healthcare Market Volume Share (%), by Application 2024 & 2032
- Figure 79: Middle East and Africa Smart Healthcare Market Revenue (Million), by End User 2024 & 2032
- Figure 80: Middle East and Africa Smart Healthcare Market Volume (K Unit), by End User 2024 & 2032
- Figure 81: Middle East and Africa Smart Healthcare Market Revenue Share (%), by End User 2024 & 2032
- Figure 82: Middle East and Africa Smart Healthcare Market Volume Share (%), by End User 2024 & 2032
- Figure 83: Middle East and Africa Smart Healthcare Market Revenue (Million), by Country 2024 & 2032
- Figure 84: Middle East and Africa Smart Healthcare Market Volume (K Unit), by Country 2024 & 2032
- Figure 85: Middle East and Africa Smart Healthcare Market Revenue Share (%), by Country 2024 & 2032
- Figure 86: Middle East and Africa Smart Healthcare Market Volume Share (%), by Country 2024 & 2032
- Figure 87: South America Smart Healthcare Market Revenue (Million), by Product Type 2024 & 2032
- Figure 88: South America Smart Healthcare Market Volume (K Unit), by Product Type 2024 & 2032
- Figure 89: South America Smart Healthcare Market Revenue Share (%), by Product Type 2024 & 2032
- Figure 90: South America Smart Healthcare Market Volume Share (%), by Product Type 2024 & 2032
- Figure 91: South America Smart Healthcare Market Revenue (Million), by Application 2024 & 2032
- Figure 92: South America Smart Healthcare Market Volume (K Unit), by Application 2024 & 2032
- Figure 93: South America Smart Healthcare Market Revenue Share (%), by Application 2024 & 2032
- Figure 94: South America Smart Healthcare Market Volume Share (%), by Application 2024 & 2032
- Figure 95: South America Smart Healthcare Market Revenue (Million), by End User 2024 & 2032
- Figure 96: South America Smart Healthcare Market Volume (K Unit), by End User 2024 & 2032
- Figure 97: South America Smart Healthcare Market Revenue Share (%), by End User 2024 & 2032
- Figure 98: South America Smart Healthcare Market Volume Share (%), by End User 2024 & 2032
- Figure 99: South America Smart Healthcare Market Revenue (Million), by Country 2024 & 2032
- Figure 100: South America Smart Healthcare Market Volume (K Unit), by Country 2024 & 2032
- Figure 101: South America Smart Healthcare Market Revenue Share (%), by Country 2024 & 2032
- Figure 102: South America Smart Healthcare Market Volume Share (%), by Country 2024 & 2032
List of Tables
- Table 1: Global Smart Healthcare Market Revenue Million Forecast, by Region 2019 & 2032
- Table 2: Global Smart Healthcare Market Volume K Unit Forecast, by Region 2019 & 2032
- Table 3: Global Smart Healthcare Market Revenue Million Forecast, by Product Type 2019 & 2032
- Table 4: Global Smart Healthcare Market Volume K Unit Forecast, by Product Type 2019 & 2032
- Table 5: Global Smart Healthcare Market Revenue Million Forecast, by Application 2019 & 2032
- Table 6: Global Smart Healthcare Market Volume K Unit Forecast, by Application 2019 & 2032
- Table 7: Global Smart Healthcare Market Revenue Million Forecast, by End User 2019 & 2032
- Table 8: Global Smart Healthcare Market Volume K Unit Forecast, by End User 2019 & 2032
- Table 9: Global Smart Healthcare Market Revenue Million Forecast, by Region 2019 & 2032
- Table 10: Global Smart Healthcare Market Volume K Unit Forecast, by Region 2019 & 2032
- Table 11: Global Smart Healthcare Market Revenue Million Forecast, by Country 2019 & 2032
- Table 12: Global Smart Healthcare Market Volume K Unit Forecast, by Country 2019 & 2032
- Table 13: United States Smart Healthcare Market Revenue (Million) Forecast, by Application 2019 & 2032
- Table 14: United States Smart Healthcare Market Volume (K Unit) Forecast, by Application 2019 & 2032
- Table 15: Canada Smart Healthcare Market Revenue (Million) Forecast, by Application 2019 & 2032
- Table 16: Canada Smart Healthcare Market Volume (K Unit) Forecast, by Application 2019 & 2032
- Table 17: Mexico Smart Healthcare Market Revenue (Million) Forecast, by Application 2019 & 2032
- Table 18: Mexico Smart Healthcare Market Volume (K Unit) Forecast, by Application 2019 & 2032
- Table 19: Global Smart Healthcare Market Revenue Million Forecast, by Country 2019 & 2032
- Table 20: Global Smart Healthcare Market Volume K Unit Forecast, by Country 2019 & 2032
- Table 21: Germany Smart Healthcare Market Revenue (Million) Forecast, by Application 2019 & 2032
- Table 22: Germany Smart Healthcare Market Volume (K Unit) Forecast, by Application 2019 & 2032
- Table 23: United Kingdom Smart Healthcare Market Revenue (Million) Forecast, by Application 2019 & 2032
- Table 24: United Kingdom Smart Healthcare Market Volume (K Unit) Forecast, by Application 2019 & 2032
- Table 25: France Smart Healthcare Market Revenue (Million) Forecast, by Application 2019 & 2032
- Table 26: France Smart Healthcare Market Volume (K Unit) Forecast, by Application 2019 & 2032
- Table 27: Spain Smart Healthcare Market Revenue (Million) Forecast, by Application 2019 & 2032
- Table 28: Spain Smart Healthcare Market Volume (K Unit) Forecast, by Application 2019 & 2032
- Table 29: Italy Smart Healthcare Market Revenue (Million) Forecast, by Application 2019 & 2032
- Table 30: Italy Smart Healthcare Market Volume (K Unit) Forecast, by Application 2019 & 2032
- Table 31: Rest of Europe Smart Healthcare Market Revenue (Million) Forecast, by Application 2019 & 2032
- Table 32: Rest of Europe Smart Healthcare Market Volume (K Unit) Forecast, by Application 2019 & 2032
- Table 33: Global Smart Healthcare Market Revenue Million Forecast, by Country 2019 & 2032
- Table 34: Global Smart Healthcare Market Volume K Unit Forecast, by Country 2019 & 2032
- Table 35: China Smart Healthcare Market Revenue (Million) Forecast, by Application 2019 & 2032
- Table 36: China Smart Healthcare Market Volume (K Unit) Forecast, by Application 2019 & 2032
- Table 37: Japan Smart Healthcare Market Revenue (Million) Forecast, by Application 2019 & 2032
- Table 38: Japan Smart Healthcare Market Volume (K Unit) Forecast, by Application 2019 & 2032
- Table 39: India Smart Healthcare Market Revenue (Million) Forecast, by Application 2019 & 2032
- Table 40: India Smart Healthcare Market Volume (K Unit) Forecast, by Application 2019 & 2032
- Table 41: Australia Smart Healthcare Market Revenue (Million) Forecast, by Application 2019 & 2032
- Table 42: Australia Smart Healthcare Market Volume (K Unit) Forecast, by Application 2019 & 2032
- Table 43: South Korea Smart Healthcare Market Revenue (Million) Forecast, by Application 2019 & 2032
- Table 44: South Korea Smart Healthcare Market Volume (K Unit) Forecast, by Application 2019 & 2032
- Table 45: Rest of Asia Pacific Smart Healthcare Market Revenue (Million) Forecast, by Application 2019 & 2032
- Table 46: Rest of Asia Pacific Smart Healthcare Market Volume (K Unit) Forecast, by Application 2019 & 2032
- Table 47: Global Smart Healthcare Market Revenue Million Forecast, by Country 2019 & 2032
- Table 48: Global Smart Healthcare Market Volume K Unit Forecast, by Country 2019 & 2032
- Table 49: GCC Smart Healthcare Market Revenue (Million) Forecast, by Application 2019 & 2032
- Table 50: GCC Smart Healthcare Market Volume (K Unit) Forecast, by Application 2019 & 2032
- Table 51: South Africa Smart Healthcare Market Revenue (Million) Forecast, by Application 2019 & 2032
- Table 52: South Africa Smart Healthcare Market Volume (K Unit) Forecast, by Application 2019 & 2032
- Table 53: Rest of Middle East and Africa Smart Healthcare Market Revenue (Million) Forecast, by Application 2019 & 2032
- Table 54: Rest of Middle East and Africa Smart Healthcare Market Volume (K Unit) Forecast, by Application 2019 & 2032
- Table 55: Global Smart Healthcare Market Revenue Million Forecast, by Country 2019 & 2032
- Table 56: Global Smart Healthcare Market Volume K Unit Forecast, by Country 2019 & 2032
- Table 57: Brazil Smart Healthcare Market Revenue (Million) Forecast, by Application 2019 & 2032
- Table 58: Brazil Smart Healthcare Market Volume (K Unit) Forecast, by Application 2019 & 2032
- Table 59: Argentina Smart Healthcare Market Revenue (Million) Forecast, by Application 2019 & 2032
- Table 60: Argentina Smart Healthcare Market Volume (K Unit) Forecast, by Application 2019 & 2032
- Table 61: Rest of South America Smart Healthcare Market Revenue (Million) Forecast, by Application 2019 & 2032
- Table 62: Rest of South America Smart Healthcare Market Volume (K Unit) Forecast, by Application 2019 & 2032
- Table 63: Global Smart Healthcare Market Revenue Million Forecast, by Product Type 2019 & 2032
- Table 64: Global Smart Healthcare Market Volume K Unit Forecast, by Product Type 2019 & 2032
- Table 65: Global Smart Healthcare Market Revenue Million Forecast, by Application 2019 & 2032
- Table 66: Global Smart Healthcare Market Volume K Unit Forecast, by Application 2019 & 2032
- Table 67: Global Smart Healthcare Market Revenue Million Forecast, by End User 2019 & 2032
- Table 68: Global Smart Healthcare Market Volume K Unit Forecast, by End User 2019 & 2032
- Table 69: Global Smart Healthcare Market Revenue Million Forecast, by Country 2019 & 2032
- Table 70: Global Smart Healthcare Market Volume K Unit Forecast, by Country 2019 & 2032
- Table 71: United States Smart Healthcare Market Revenue (Million) Forecast, by Application 2019 & 2032
- Table 72: United States Smart Healthcare Market Volume (K Unit) Forecast, by Application 2019 & 2032
- Table 73: Canada Smart Healthcare Market Revenue (Million) Forecast, by Application 2019 & 2032
- Table 74: Canada Smart Healthcare Market Volume (K Unit) Forecast, by Application 2019 & 2032
- Table 75: Mexico Smart Healthcare Market Revenue (Million) Forecast, by Application 2019 & 2032
- Table 76: Mexico Smart Healthcare Market Volume (K Unit) Forecast, by Application 2019 & 2032
- Table 77: Global Smart Healthcare Market Revenue Million Forecast, by Product Type 2019 & 2032
- Table 78: Global Smart Healthcare Market Volume K Unit Forecast, by Product Type 2019 & 2032
- Table 79: Global Smart Healthcare Market Revenue Million Forecast, by Application 2019 & 2032
- Table 80: Global Smart Healthcare Market Volume K Unit Forecast, by Application 2019 & 2032
- Table 81: Global Smart Healthcare Market Revenue Million Forecast, by End User 2019 & 2032
- Table 82: Global Smart Healthcare Market Volume K Unit Forecast, by End User 2019 & 2032
- Table 83: Global Smart Healthcare Market Revenue Million Forecast, by Country 2019 & 2032
- Table 84: Global Smart Healthcare Market Volume K Unit Forecast, by Country 2019 & 2032
- Table 85: Germany Smart Healthcare Market Revenue (Million) Forecast, by Application 2019 & 2032
- Table 86: Germany Smart Healthcare Market Volume (K Unit) Forecast, by Application 2019 & 2032
- Table 87: United Kingdom Smart Healthcare Market Revenue (Million) Forecast, by Application 2019 & 2032
- Table 88: United Kingdom Smart Healthcare Market Volume (K Unit) Forecast, by Application 2019 & 2032
- Table 89: France Smart Healthcare Market Revenue (Million) Forecast, by Application 2019 & 2032
- Table 90: France Smart Healthcare Market Volume (K Unit) Forecast, by Application 2019 & 2032
- Table 91: Spain Smart Healthcare Market Revenue (Million) Forecast, by Application 2019 & 2032
- Table 92: Spain Smart Healthcare Market Volume (K Unit) Forecast, by Application 2019 & 2032
- Table 93: Italy Smart Healthcare Market Revenue (Million) Forecast, by Application 2019 & 2032
- Table 94: Italy Smart Healthcare Market Volume (K Unit) Forecast, by Application 2019 & 2032
- Table 95: Rest of Europe Smart Healthcare Market Revenue (Million) Forecast, by Application 2019 & 2032
- Table 96: Rest of Europe Smart Healthcare Market Volume (K Unit) Forecast, by Application 2019 & 2032
- Table 97: Global Smart Healthcare Market Revenue Million Forecast, by Product Type 2019 & 2032
- Table 98: Global Smart Healthcare Market Volume K Unit Forecast, by Product Type 2019 & 2032
- Table 99: Global Smart Healthcare Market Revenue Million Forecast, by Application 2019 & 2032
- Table 100: Global Smart Healthcare Market Volume K Unit Forecast, by Application 2019 & 2032
- Table 101: Global Smart Healthcare Market Revenue Million Forecast, by End User 2019 & 2032
- Table 102: Global Smart Healthcare Market Volume K Unit Forecast, by End User 2019 & 2032
- Table 103: Global Smart Healthcare Market Revenue Million Forecast, by Country 2019 & 2032
- Table 104: Global Smart Healthcare Market Volume K Unit Forecast, by Country 2019 & 2032
- Table 105: China Smart Healthcare Market Revenue (Million) Forecast, by Application 2019 & 2032
- Table 106: China Smart Healthcare Market Volume (K Unit) Forecast, by Application 2019 & 2032
- Table 107: Japan Smart Healthcare Market Revenue (Million) Forecast, by Application 2019 & 2032
- Table 108: Japan Smart Healthcare Market Volume (K Unit) Forecast, by Application 2019 & 2032
- Table 109: India Smart Healthcare Market Revenue (Million) Forecast, by Application 2019 & 2032
- Table 110: India Smart Healthcare Market Volume (K Unit) Forecast, by Application 2019 & 2032
- Table 111: Australia Smart Healthcare Market Revenue (Million) Forecast, by Application 2019 & 2032
- Table 112: Australia Smart Healthcare Market Volume (K Unit) Forecast, by Application 2019 & 2032
- Table 113: South Korea Smart Healthcare Market Revenue (Million) Forecast, by Application 2019 & 2032
- Table 114: South Korea Smart Healthcare Market Volume (K Unit) Forecast, by Application 2019 & 2032
- Table 115: Rest of Asia Pacific Smart Healthcare Market Revenue (Million) Forecast, by Application 2019 & 2032
- Table 116: Rest of Asia Pacific Smart Healthcare Market Volume (K Unit) Forecast, by Application 2019 & 2032
- Table 117: Global Smart Healthcare Market Revenue Million Forecast, by Product Type 2019 & 2032
- Table 118: Global Smart Healthcare Market Volume K Unit Forecast, by Product Type 2019 & 2032
- Table 119: Global Smart Healthcare Market Revenue Million Forecast, by Application 2019 & 2032
- Table 120: Global Smart Healthcare Market Volume K Unit Forecast, by Application 2019 & 2032
- Table 121: Global Smart Healthcare Market Revenue Million Forecast, by End User 2019 & 2032
- Table 122: Global Smart Healthcare Market Volume K Unit Forecast, by End User 2019 & 2032
- Table 123: Global Smart Healthcare Market Revenue Million Forecast, by Country 2019 & 2032
- Table 124: Global Smart Healthcare Market Volume K Unit Forecast, by Country 2019 & 2032
- Table 125: GCC Smart Healthcare Market Revenue (Million) Forecast, by Application 2019 & 2032
- Table 126: GCC Smart Healthcare Market Volume (K Unit) Forecast, by Application 2019 & 2032
- Table 127: South Africa Smart Healthcare Market Revenue (Million) Forecast, by Application 2019 & 2032
- Table 128: South Africa Smart Healthcare Market Volume (K Unit) Forecast, by Application 2019 & 2032
- Table 129: Rest of Middle East and Africa Smart Healthcare Market Revenue (Million) Forecast, by Application 2019 & 2032
- Table 130: Rest of Middle East and Africa Smart Healthcare Market Volume (K Unit) Forecast, by Application 2019 & 2032
- Table 131: Global Smart Healthcare Market Revenue Million Forecast, by Product Type 2019 & 2032
- Table 132: Global Smart Healthcare Market Volume K Unit Forecast, by Product Type 2019 & 2032
- Table 133: Global Smart Healthcare Market Revenue Million Forecast, by Application 2019 & 2032
- Table 134: Global Smart Healthcare Market Volume K Unit Forecast, by Application 2019 & 2032
- Table 135: Global Smart Healthcare Market Revenue Million Forecast, by End User 2019 & 2032
- Table 136: Global Smart Healthcare Market Volume K Unit Forecast, by End User 2019 & 2032
- Table 137: Global Smart Healthcare Market Revenue Million Forecast, by Country 2019 & 2032
- Table 138: Global Smart Healthcare Market Volume K Unit Forecast, by Country 2019 & 2032
- Table 139: Brazil Smart Healthcare Market Revenue (Million) Forecast, by Application 2019 & 2032
- Table 140: Brazil Smart Healthcare Market Volume (K Unit) Forecast, by Application 2019 & 2032
- Table 141: Argentina Smart Healthcare Market Revenue (Million) Forecast, by Application 2019 & 2032
- Table 142: Argentina Smart Healthcare Market Volume (K Unit) Forecast, by Application 2019 & 2032
- Table 143: Rest of South America Smart Healthcare Market Revenue (Million) Forecast, by Application 2019 & 2032
- Table 144: Rest of South America Smart Healthcare Market Volume (K Unit) Forecast, by Application 2019 & 2032
Frequently Asked Questions
1. What is the projected Compound Annual Growth Rate (CAGR) of the Smart Healthcare Market?
The projected CAGR is approximately 8.50%.
2. Which companies are prominent players in the Smart Healthcare Market?
Key companies in the market include Medtronic (Given Imaging Inc ), Life Sense, Oracle Corporation (Cerner Corporation), GE Healthcare, Abbott Laboratories, Siemens Healthineers AG, Next Gen Healthcare, Koninklijke Philips NV, McKesson Corporation, Olympus Corporation, Capsule Technologies Inc , Samsung Healthcare.
3. What are the main segments of the Smart Healthcare Market?
The market segments include Product Type, Application, End User.
4. Can you provide details about the market size?
The market size is estimated to be USD XX Million as of 2022.
5. What are some drivers contributing to market growth?
Technological Advancements in Smart Healthcare Products; Booming Internet of Things (IoT) in the Healthcare Industry.
6. What are the notable trends driving market growth?
The mHealth Segment is Expected to Observe Good Growth in the Market.
7. Are there any restraints impacting market growth?
High Cost of Smart Healthcare Products.
8. Can you provide examples of recent developments in the market?
In March 2022, Intuitive MB launched its medical building operating system, which uses the Internet of Things (IoT), artificial intelligence (AI), and machine learning technologies to create "smart" hospitals and medical office buildings.
9. What pricing options are available for accessing the report?
Pricing options include single-user, multi-user, and enterprise licenses priced at USD 4750, USD 5250, and USD 8750 respectively.
10. Is the market size provided in terms of value or volume?
The market size is provided in terms of value, measured in Million and volume, measured in K Unit.
11. Are there any specific market keywords associated with the report?
Yes, the market keyword associated with the report is "Smart Healthcare Market," which aids in identifying and referencing the specific market segment covered.
12. How do I determine which pricing option suits my needs best?
The pricing options vary based on user requirements and access needs. Individual users may opt for single-user licenses, while businesses requiring broader access may choose multi-user or enterprise licenses for cost-effective access to the report.
13. Are there any additional resources or data provided in the Smart Healthcare Market report?
While the report offers comprehensive insights, it's advisable to review the specific contents or supplementary materials provided to ascertain if additional resources or data are available.
14. How can I stay updated on further developments or reports in the Smart Healthcare Market?
To stay informed about further developments, trends, and reports in the Smart Healthcare Market, consider subscribing to industry newsletters, following relevant companies and organizations, or regularly checking reputable industry news sources and publications.
Methodology
Step 1 - Identification of Relevant Samples Size from Population Database


Step 2 - Approaches for Defining Global Market Size (Value, Volume* & Price*)

Note*: In applicable scenarios
Step 3 - Data Sources
Primary Research
- Web Analytics
- Survey Reports
- Research Institute
- Latest Research Reports
- Opinion Leaders
Secondary Research
- Annual Reports
- White Paper
- Latest Press Release
- Industry Association
- Paid Database
- Investor Presentations

Step 4 - Data Triangulation
Involves using different sources of information in order to increase the validity of a study
These sources are likely to be stakeholders in a program - participants, other researchers, program staff, other community members, and so on.
Then we put all data in single framework & apply various statistical tools to find out the dynamic on the market.
During the analysis stage, feedback from the stakeholder groups would be compared to determine areas of agreement as well as areas of divergence


