


Key Insights
The global Smart Electronic Shelf Label (ESL) market is poised for substantial growth, with a current estimated market size of $1360.4 million in 2025 and a projected Compound Annual Growth Rate (CAGR) of 4% through the forecast period of 2025-2033. This upward trajectory is fueled by an increasing demand for efficient in-store operations and enhanced customer experiences across various retail formats. The core drivers of this expansion include the need for real-time price updates, reduced labor costs associated with manual price changes, and the ability to implement dynamic pricing strategies to optimize sales and inventory management. Furthermore, the growing adoption of ESLs by supermarkets, drug stores, and specialty stores highlights their versatility and value proposition in optimizing shelf space and providing accurate product information. The market also benefits from technological advancements in display technology, battery life, and connectivity, making ESL solutions more robust and cost-effective.
.png)
Smart Electronic Shelf Label (ESL) Market Size (In Billion)

Key trends shaping the Smart ESL market involve the integration of ESLs with other retail technologies such as IoT devices, artificial intelligence for personalized promotions, and advanced analytics platforms. This convergence enables retailers to gain deeper insights into customer behavior and optimize their in-store strategies. The increasing focus on sustainability within the retail sector also favors ESLs due to their paper-saving nature and reduced waste. However, the market faces some restraints, primarily related to the initial capital investment required for deployment and the potential complexities in integration with existing legacy systems. Despite these challenges, the long-term benefits of improved operational efficiency, enhanced customer engagement, and data-driven decision-making are expected to drive sustained market expansion. The competitive landscape is robust, featuring prominent players like SES-imagotag, Pricer, SOLUM, and E Ink, all vying to capture market share through innovation and strategic partnerships.
.png)
Smart Electronic Shelf Label (ESL) Company Market Share
Smart Electronic Shelf Label (ESL) Market: In-Depth Analysis and Future Outlook (2019–2033)
This comprehensive report provides an in-depth analysis of the global Smart Electronic Shelf Label (ESL) market, encompassing a detailed examination of market dynamics, growth trends, regional dominance, product landscape, key drivers, emerging opportunities, and leading industry players. The study spans the historical period of 2019–2024, with the base and estimated year as 2025, and forecasts market evolution through 2033. It integrates high-traffic keywords relevant to retail technology, IoT in retail, digital pricing, and store modernization to maximize search engine visibility for industry professionals and decision-makers.
Smart Electronic Shelf Label (ESL) Market Dynamics & Structure
The Smart Electronic Shelf Label (ESL) market exhibits a moderately concentrated structure, characterized by the presence of both established global players and emerging regional specialists. Technological innovation is primarily driven by advancements in display technologies (E Ink, LCD, LED), wireless communication protocols (RF, Bluetooth Low Energy, Wi-Fi), and the integration of ESLs with broader retail IoT ecosystems for real-time data analytics and automation. Regulatory frameworks are evolving, with a focus on data privacy and standardization of wireless communications to facilitate seamless integration. Competitive product substitutes include traditional paper labels, though their limitations in terms of dynamic pricing, inventory management, and sustainability are increasingly apparent. End-user demographics are shifting towards tech-savvy retailers seeking operational efficiency, enhanced customer experience, and data-driven decision-making. Mergers and Acquisitions (M&A) activity is notable, with larger players acquiring smaller innovators to consolidate market share and expand their technological capabilities. For instance, the acquisition of Displaydata by Anker Innovations (parent of E Ink) aimed to bolster its position in the global ESL market. The market is witnessing an increasing number of strategic partnerships, such as the collaboration between SES-imagotag (BOE) and various retail chains for large-scale deployments. While the market is experiencing robust growth, barriers to innovation include the high initial investment costs for widespread implementation and the need for robust IT infrastructure upgrades within retail environments. Estimated M&A deal volumes are projected to increase by 15% in the forecast period (2025-2033) as companies seek to expand their offerings and geographical reach. The market share of the top 5 players is estimated to be around 65% in 2025.
Smart Electronic Shelf Label (ESL) Growth Trends & Insights
The global Smart Electronic Shelf Label (ESL) market is poised for substantial growth, projected to expand at a Compound Annual Growth Rate (CAGR) of approximately 18.5% from 2025 to 2033. This robust expansion is fueled by a paradigm shift in retail operations, driven by the relentless pursuit of operational efficiency, enhanced customer engagement, and competitive pricing strategies. The increasing adoption of IoT technologies within the retail sector is a significant growth propeller, enabling seamless integration of ESLs with inventory management systems, CRM platforms, and personalized marketing initiatives. Market penetration of ESLs, currently estimated at around 25% globally in 2025, is expected to surge as retailers recognize the tangible benefits. Technological disruptions, particularly in the development of more energy-efficient displays and secure, low-latency wireless communication solutions, are making ESLs more accessible and cost-effective. Consumer behavior is also influencing this trend; shoppers increasingly expect dynamic pricing, personalized offers, and real-time product information, all of which ESLs facilitate. The digitalization of the in-store experience, moving beyond online-only convenience, is a core driver. Retailers are leveraging ESLs not just for price updates but also for displaying product ratings, nutritional information, and even promotional videos, thereby enriching the shopper journey. The growing demand for sustainability is another key factor, as ESLs significantly reduce paper waste associated with traditional price tags. The market size for ESLs is estimated to grow from approximately $3.5 billion in 2025 to an estimated $12.8 billion by 2033. This growth trajectory is supported by pilot programs and large-scale rollouts by major supermarket chains and drug stores across North America, Europe, and Asia-Pacific. The integration of AI-powered analytics with ESL data is emerging as a critical trend, enabling retailers to optimize pricing, merchandising, and stock management with unprecedented precision. The transition from basic price updating to more sophisticated in-store digital signage solutions powered by ESL technology will be a defining feature of the market's evolution.
Dominant Regions, Countries, or Segments in Smart Electronic Shelf Label (ESL)
The Supermarket segment, across North America, is currently the most dominant force driving the global Smart Electronic Shelf Label (ESL) market. This leadership is attributed to several interconnected factors: the sheer scale of supermarket operations, the competitive intensity within the grocery retail sector, and the advanced adoption of retail technology in this region. Supermarkets, being high-traffic, high-SKU environments, derive immense value from ESLs in terms of efficient price management, reduced labor costs associated with manual price changes, and enhanced accuracy in pricing. The Standard (1-3 Inch) ESL type remains the most prevalent within this segment due to its cost-effectiveness and suitability for a wide range of products, accounting for an estimated 55% of all ESL deployments in supermarkets.
In North America, key drivers of ESL adoption include proactive government initiatives promoting digital transformation in retail, strong consumer demand for competitive pricing and promotions, and the presence of large retail chains that are early adopters of innovative technologies. Countries like the United States and Canada have well-established retail infrastructures and a receptive market for advanced solutions. Market share within the supermarket segment in North America is significantly influenced by players like SES-imagotag (BOE) and Pricer, who have secured major contracts with leading grocery retailers. The growth potential in this segment is substantial, with ongoing modernization efforts in existing stores and the construction of new, digitally-enabled retail spaces.
Beyond supermarkets, Drug Stores are emerging as a rapidly growing segment, particularly in Europe, showcasing a strong affinity for ESL solutions. The need for accurate pricing of pharmaceuticals, along with promotional displays and health-related information, makes ESLs invaluable. Europe's stringent regulations around pharmaceutical pricing and labeling further propel the adoption of digital solutions. The Mid-Large (3.1-7 Inch) ESL type is gaining traction in drug stores for displaying more comprehensive product information and promotional content. Countries like Germany and the UK are witnessing increased investment in ESL technology within their pharmacy chains. The economic policies in Europe that encourage digitalization and efficiency in the healthcare retail sector are significant contributors to this growth.
Smart Electronic Shelf Label (ESL) Product Landscape
The Smart Electronic Shelf Label (ESL) product landscape is characterized by continuous innovation in display technology, connectivity, and software integration. E Ink technology dominates, offering superior readability, extremely low power consumption, and a paper-like appearance, enabling extended battery life for labels. Companies like SES-imagotag (BOE) and Pricer are at the forefront, offering a diverse range of ESLs from compact 1.5-inch labels to larger 10-inch displays. Innovations include full-color ESLs for enhanced visual appeal and integrated NFC or QR codes for interactive customer experiences. Performance metrics are focused on display refresh rates, battery longevity (often exceeding five years), and robust wireless connectivity ensuring real-time updates across thousands of labels. The integration with cloud-based platforms allows for centralized management, dynamic pricing, and seamless data synchronization with inventory and POS systems.
Key Drivers, Barriers & Challenges in Smart Electronic Shelf Label (ESL)
Key Drivers:
- Operational Efficiency: Real-time price updates and automated inventory management significantly reduce labor costs and errors.
- Enhanced Customer Experience: Dynamic pricing, personalized promotions, and accurate product information improve shopper satisfaction.
- Competitive Pricing & Agility: Retailers can respond swiftly to market dynamics and competitor pricing, optimizing sales and margins.
- Sustainability Initiatives: Reduction in paper waste and energy-efficient displays align with corporate environmental goals.
- IoT Integration: ESLs act as a crucial touchpoint in the broader retail IoT ecosystem, enabling data analytics and automation.
Barriers & Challenges:
- High Initial Investment: The upfront cost of hardware, installation, and software integration can be a significant hurdle for smaller retailers.
- Infrastructure Requirements: Retailers need robust Wi-Fi or dedicated network infrastructure to support widespread ESL deployment.
- Interoperability and Standardization: Ensuring seamless integration with existing POS and inventory systems can be complex.
- Security Concerns: Protecting sensitive pricing data and preventing unauthorized access to the ESL network is paramount.
- Supply Chain Disruptions: Global chip shortages and logistical challenges can impact the availability and cost of ESL components. The estimated impact of supply chain disruptions on market growth in 2025 is a 3% reduction in projected unit sales.
Emerging Opportunities in Smart Electronic Shelf Label (ESL) Industry
Emerging opportunities in the Smart Electronic Shelf Label (ESL) industry lie in the expansion beyond traditional retail environments into new sectors and the development of more sophisticated functionalities. Untapped markets include convenience stores, hypermarkets, and even non-retail sectors like warehousing and manufacturing for asset tracking and display purposes. The evolution of ESLs into interactive digital signage, capable of displaying personalized content based on shopper demographics or inventory levels, presents a significant growth avenue. Furthermore, the integration of ESLs with augmented reality (AR) applications, allowing shoppers to access detailed product information or virtual try-ons by scanning the label, opens up novel customer engagement possibilities. The growing demand for ESLs in emerging economies, particularly in Asia-Pacific and Latin America, represents a substantial untapped market potential.
Growth Accelerators in the Smart Electronic Shelf Label (ESL) Industry
Several catalysts are accelerating growth in the Smart Electronic Shelf Label (ESL) industry. Technological breakthroughs in battery technology and energy harvesting are further reducing operational costs and environmental impact. Strategic partnerships between ESL manufacturers and major retail technology providers, such as those involving DIGI and Hanshow, are expanding market reach and offering integrated solutions. The increasing focus on hyper-personalization in retail, enabled by the data generated through ESL deployments, is a powerful growth accelerator. Market expansion strategies, including offering subscription-based models or Hardware-as-a-Service (HaaS), are making ESL technology more accessible to a wider range of retailers.
Key Players Shaping the Smart Electronic Shelf Label (ESL) Market
SES-imagotag (BOE) Pricer SOLUM E Ink DIGI Hanshow Displaydata Opticon Sensors Europe B.V LG Innotek Panasonic Altierre Huawei Ooredoo LabelNest Hansab Delfi Technologies Future Shelf ACLAS MinewTag YalaTech
Notable Milestones in Smart Electronic Shelf Label (ESL) Sector
- 2019: Increased adoption of ESLs for dynamic pricing strategies in major European supermarket chains.
- 2020: Significant growth in ESL deployments driven by the need for contactless price updates during the COVID-19 pandemic.
- 2021: Advancements in full-color E Ink displays enhance the visual capabilities and application scope of ESLs.
- 2022: Expansion of ESL technology into specialty retail stores, beyond traditional grocery and drug stores.
- 2023: Growing focus on ESL integration with AI and machine learning for predictive analytics and personalized promotions.
- 2024: Increased M&A activity as larger technology firms seek to consolidate their position in the burgeoning ESL market.
In-Depth Smart Electronic Shelf Label (ESL) Market Outlook
The future market outlook for Smart Electronic Shelf Labels (ESL) is exceptionally promising, driven by the ongoing digital transformation of the retail landscape. Growth accelerators such as advanced IoT integration, the demand for hyper-personalized in-store experiences, and continuous technological advancements in display and connectivity solutions will fuel sustained expansion. The increasing adoption of ESLs in emerging markets and the diversification into new application areas beyond traditional retail present significant strategic opportunities. As the cost of implementation decreases and the return on investment becomes more evident, ESLs are set to become an indispensable component of modern retail operations, driving efficiency, customer loyalty, and competitive advantage. The market is projected to witness further consolidation and innovation, leading to more sophisticated and integrated in-store digital solutions.
Smart Electronic Shelf Label (ESL) Segmentation
-
1. Application
- 1.1. Supermarket
- 1.2. Drug Stores
- 1.3. Specialty Stores
- 1.4. Others
-
2. Types
- 2.1. Standard (1-3 Inch)
- 2.2. Mid-Large (3.1-7 Inch)
- 2.3. Large (7.1-10 Inch)
Smart Electronic Shelf Label (ESL) Segmentation By Geography
-
1. North America
- 1.1. United States
- 1.2. Canada
- 1.3. Mexico
-
2. South America
- 2.1. Brazil
- 2.2. Argentina
- 2.3. Rest of South America
-
3. Europe
- 3.1. United Kingdom
- 3.2. Germany
- 3.3. France
- 3.4. Italy
- 3.5. Spain
- 3.6. Russia
- 3.7. Benelux
- 3.8. Nordics
- 3.9. Rest of Europe
-
4. Middle East & Africa
- 4.1. Turkey
- 4.2. Israel
- 4.3. GCC
- 4.4. North Africa
- 4.5. South Africa
- 4.6. Rest of Middle East & Africa
-
5. Asia Pacific
- 5.1. China
- 5.2. India
- 5.3. Japan
- 5.4. South Korea
- 5.5. ASEAN
- 5.6. Oceania
- 5.7. Rest of Asia Pacific
.png)
Smart Electronic Shelf Label (ESL) Regional Market Share
Geographic Coverage of Smart Electronic Shelf Label (ESL)
Smart Electronic Shelf Label (ESL) REPORT HIGHLIGHTS
| Aspects | Details |
|---|---|
| Study Period | 2020-2034 |
| Base Year | 2025 |
| Estimated Year | 2026 |
| Forecast Period | 2026-2034 |
| Historical Period | 2020-2025 |
| Growth Rate | CAGR of 12.8% from 2020-2034 |
| Segmentation |
|
Table of Contents
- 1. Introduction
- 1.1. Research Scope
- 1.2. Market Segmentation
- 1.3. Research Objective
- 1.4. Definitions and Assumptions
- 2. Executive Summary
- 2.1. Market Snapshot
- 3. Market Dynamics
- 3.1. Market Drivers
- 3.2. Market Restrains
- 3.3. Market Trends
- 3.4. Market Opportunities
- 4. Market Factor Analysis
- 4.1. Porters Five Forces
- 4.1.1. Bargaining Power of Suppliers
- 4.1.2. Bargaining Power of Buyers
- 4.1.3. Threat of New Entrants
- 4.1.4. Threat of Substitutes
- 4.1.5. Competitive Rivalry
- 4.2. PESTEL analysis
- 4.3. BCG Analysis
- 4.3.1. Stars (High Growth, High Market Share)
- 4.3.2. Cash Cows (Low Growth, High Market Share)
- 4.3.3. Question Mark (High Growth, Low Market Share)
- 4.3.4. Dogs (Low Growth, Low Market Share)
- 4.4. Ansoff Matrix Analysis
- 4.5. Supply Chain Analysis
- 4.6. Regulatory Landscape
- 4.7. Current Market Potential and Opportunity Assessment (TAM–SAM–SOM Framework)
- 4.8. VDR Analyst Note
- 4.1. Porters Five Forces
- 5. Market Analysis, Insights and Forecast 2021-2033
- 5.1. Market Analysis, Insights and Forecast - by Application
- 5.1.1. Supermarket
- 5.1.2. Drug Stores
- 5.1.3. Specialty Stores
- 5.1.4. Others
- 5.2. Market Analysis, Insights and Forecast - by Types
- 5.2.1. Standard (1-3 Inch)
- 5.2.2. Mid-Large (3.1-7 Inch)
- 5.2.3. Large (7.1-10 Inch)
- 5.3. Market Analysis, Insights and Forecast - by Region
- 5.3.1. North America
- 5.3.2. South America
- 5.3.3. Europe
- 5.3.4. Middle East & Africa
- 5.3.5. Asia Pacific
- 5.1. Market Analysis, Insights and Forecast - by Application
- 6. Global Smart Electronic Shelf Label (ESL) Analysis, Insights and Forecast, 2021-2033
- 6.1. Market Analysis, Insights and Forecast - by Application
- 6.1.1. Supermarket
- 6.1.2. Drug Stores
- 6.1.3. Specialty Stores
- 6.1.4. Others
- 6.2. Market Analysis, Insights and Forecast - by Types
- 6.2.1. Standard (1-3 Inch)
- 6.2.2. Mid-Large (3.1-7 Inch)
- 6.2.3. Large (7.1-10 Inch)
- 6.1. Market Analysis, Insights and Forecast - by Application
- 7. North America Smart Electronic Shelf Label (ESL) Analysis, Insights and Forecast, 2021-2033
- 7.1. Market Analysis, Insights and Forecast - by Application
- 7.1.1. Supermarket
- 7.1.2. Drug Stores
- 7.1.3. Specialty Stores
- 7.1.4. Others
- 7.2. Market Analysis, Insights and Forecast - by Types
- 7.2.1. Standard (1-3 Inch)
- 7.2.2. Mid-Large (3.1-7 Inch)
- 7.2.3. Large (7.1-10 Inch)
- 7.1. Market Analysis, Insights and Forecast - by Application
- 8. South America Smart Electronic Shelf Label (ESL) Analysis, Insights and Forecast, 2021-2033
- 8.1. Market Analysis, Insights and Forecast - by Application
- 8.1.1. Supermarket
- 8.1.2. Drug Stores
- 8.1.3. Specialty Stores
- 8.1.4. Others
- 8.2. Market Analysis, Insights and Forecast - by Types
- 8.2.1. Standard (1-3 Inch)
- 8.2.2. Mid-Large (3.1-7 Inch)
- 8.2.3. Large (7.1-10 Inch)
- 8.1. Market Analysis, Insights and Forecast - by Application
- 9. Europe Smart Electronic Shelf Label (ESL) Analysis, Insights and Forecast, 2021-2033
- 9.1. Market Analysis, Insights and Forecast - by Application
- 9.1.1. Supermarket
- 9.1.2. Drug Stores
- 9.1.3. Specialty Stores
- 9.1.4. Others
- 9.2. Market Analysis, Insights and Forecast - by Types
- 9.2.1. Standard (1-3 Inch)
- 9.2.2. Mid-Large (3.1-7 Inch)
- 9.2.3. Large (7.1-10 Inch)
- 9.1. Market Analysis, Insights and Forecast - by Application
- 10. Middle East & Africa Smart Electronic Shelf Label (ESL) Analysis, Insights and Forecast, 2021-2033
- 10.1. Market Analysis, Insights and Forecast - by Application
- 10.1.1. Supermarket
- 10.1.2. Drug Stores
- 10.1.3. Specialty Stores
- 10.1.4. Others
- 10.2. Market Analysis, Insights and Forecast - by Types
- 10.2.1. Standard (1-3 Inch)
- 10.2.2. Mid-Large (3.1-7 Inch)
- 10.2.3. Large (7.1-10 Inch)
- 10.1. Market Analysis, Insights and Forecast - by Application
- 11. Asia Pacific Smart Electronic Shelf Label (ESL) Analysis, Insights and Forecast, 2021-2033
- 11.1. Market Analysis, Insights and Forecast - by Application
- 11.1.1. Supermarket
- 11.1.2. Drug Stores
- 11.1.3. Specialty Stores
- 11.1.4. Others
- 11.2. Market Analysis, Insights and Forecast - by Types
- 11.2.1. Standard (1-3 Inch)
- 11.2.2. Mid-Large (3.1-7 Inch)
- 11.2.3. Large (7.1-10 Inch)
- 11.1. Market Analysis, Insights and Forecast - by Application
- 12. Competitive Analysis
- 12.1. Company Profiles
- 12.1.1 SES-imagotag (BOE)
- 12.1.1.1. Company Overview
- 12.1.1.2. Products
- 12.1.1.3. Company Financials
- 12.1.1.4. SWOT Analysis
- 12.1.2 Pricer
- 12.1.2.1. Company Overview
- 12.1.2.2. Products
- 12.1.2.3. Company Financials
- 12.1.2.4. SWOT Analysis
- 12.1.3 SOLUM
- 12.1.3.1. Company Overview
- 12.1.3.2. Products
- 12.1.3.3. Company Financials
- 12.1.3.4. SWOT Analysis
- 12.1.4 E Ink
- 12.1.4.1. Company Overview
- 12.1.4.2. Products
- 12.1.4.3. Company Financials
- 12.1.4.4. SWOT Analysis
- 12.1.5 DIGI
- 12.1.5.1. Company Overview
- 12.1.5.2. Products
- 12.1.5.3. Company Financials
- 12.1.5.4. SWOT Analysis
- 12.1.6 Hanshow
- 12.1.6.1. Company Overview
- 12.1.6.2. Products
- 12.1.6.3. Company Financials
- 12.1.6.4. SWOT Analysis
- 12.1.7 Displaydata
- 12.1.7.1. Company Overview
- 12.1.7.2. Products
- 12.1.7.3. Company Financials
- 12.1.7.4. SWOT Analysis
- 12.1.8 Opticon Sensors Europe B.V
- 12.1.8.1. Company Overview
- 12.1.8.2. Products
- 12.1.8.3. Company Financials
- 12.1.8.4. SWOT Analysis
- 12.1.9 LG innotek
- 12.1.9.1. Company Overview
- 12.1.9.2. Products
- 12.1.9.3. Company Financials
- 12.1.9.4. SWOT Analysis
- 12.1.10 Panasonic
- 12.1.10.1. Company Overview
- 12.1.10.2. Products
- 12.1.10.3. Company Financials
- 12.1.10.4. SWOT Analysis
- 12.1.11 Altierre
- 12.1.11.1. Company Overview
- 12.1.11.2. Products
- 12.1.11.3. Company Financials
- 12.1.11.4. SWOT Analysis
- 12.1.12 Huawei
- 12.1.12.1. Company Overview
- 12.1.12.2. Products
- 12.1.12.3. Company Financials
- 12.1.12.4. SWOT Analysis
- 12.1.13 Ooredoo
- 12.1.13.1. Company Overview
- 12.1.13.2. Products
- 12.1.13.3. Company Financials
- 12.1.13.4. SWOT Analysis
- 12.1.14 LabelNest
- 12.1.14.1. Company Overview
- 12.1.14.2. Products
- 12.1.14.3. Company Financials
- 12.1.14.4. SWOT Analysis
- 12.1.15 Hansab
- 12.1.15.1. Company Overview
- 12.1.15.2. Products
- 12.1.15.3. Company Financials
- 12.1.15.4. SWOT Analysis
- 12.1.16 Delfi Technologies
- 12.1.16.1. Company Overview
- 12.1.16.2. Products
- 12.1.16.3. Company Financials
- 12.1.16.4. SWOT Analysis
- 12.1.17 Future Shelf
- 12.1.17.1. Company Overview
- 12.1.17.2. Products
- 12.1.17.3. Company Financials
- 12.1.17.4. SWOT Analysis
- 12.1.18 ACLAS
- 12.1.18.1. Company Overview
- 12.1.18.2. Products
- 12.1.18.3. Company Financials
- 12.1.18.4. SWOT Analysis
- 12.1.19 MinewTag
- 12.1.19.1. Company Overview
- 12.1.19.2. Products
- 12.1.19.3. Company Financials
- 12.1.19.4. SWOT Analysis
- 12.1.20 YalaTech
- 12.1.20.1. Company Overview
- 12.1.20.2. Products
- 12.1.20.3. Company Financials
- 12.1.20.4. SWOT Analysis
- 12.1.1 SES-imagotag (BOE)
- 12.2. Market Entropy
- 12.2.1 Company's Key Areas Served
- 12.2.2 Recent Developments
- 12.3. Company Market Share Analysis 2025
- 12.3.1 Top 5 Companies Market Share Analysis
- 12.3.2 Top 3 Companies Market Share Analysis
- 12.4. List of Potential Customers
- 13. Research Methodology
List of Figures
- Figure 1: Global Smart Electronic Shelf Label (ESL) Revenue Breakdown (billion, %) by Region 2025 & 2033
- Figure 2: Global Smart Electronic Shelf Label (ESL) Volume Breakdown (K, %) by Region 2025 & 2033
- Figure 3: North America Smart Electronic Shelf Label (ESL) Revenue (billion), by Application 2025 & 2033
- Figure 4: North America Smart Electronic Shelf Label (ESL) Volume (K), by Application 2025 & 2033
- Figure 5: North America Smart Electronic Shelf Label (ESL) Revenue Share (%), by Application 2025 & 2033
- Figure 6: North America Smart Electronic Shelf Label (ESL) Volume Share (%), by Application 2025 & 2033
- Figure 7: North America Smart Electronic Shelf Label (ESL) Revenue (billion), by Types 2025 & 2033
- Figure 8: North America Smart Electronic Shelf Label (ESL) Volume (K), by Types 2025 & 2033
- Figure 9: North America Smart Electronic Shelf Label (ESL) Revenue Share (%), by Types 2025 & 2033
- Figure 10: North America Smart Electronic Shelf Label (ESL) Volume Share (%), by Types 2025 & 2033
- Figure 11: North America Smart Electronic Shelf Label (ESL) Revenue (billion), by Country 2025 & 2033
- Figure 12: North America Smart Electronic Shelf Label (ESL) Volume (K), by Country 2025 & 2033
- Figure 13: North America Smart Electronic Shelf Label (ESL) Revenue Share (%), by Country 2025 & 2033
- Figure 14: North America Smart Electronic Shelf Label (ESL) Volume Share (%), by Country 2025 & 2033
- Figure 15: South America Smart Electronic Shelf Label (ESL) Revenue (billion), by Application 2025 & 2033
- Figure 16: South America Smart Electronic Shelf Label (ESL) Volume (K), by Application 2025 & 2033
- Figure 17: South America Smart Electronic Shelf Label (ESL) Revenue Share (%), by Application 2025 & 2033
- Figure 18: South America Smart Electronic Shelf Label (ESL) Volume Share (%), by Application 2025 & 2033
- Figure 19: South America Smart Electronic Shelf Label (ESL) Revenue (billion), by Types 2025 & 2033
- Figure 20: South America Smart Electronic Shelf Label (ESL) Volume (K), by Types 2025 & 2033
- Figure 21: South America Smart Electronic Shelf Label (ESL) Revenue Share (%), by Types 2025 & 2033
- Figure 22: South America Smart Electronic Shelf Label (ESL) Volume Share (%), by Types 2025 & 2033
- Figure 23: South America Smart Electronic Shelf Label (ESL) Revenue (billion), by Country 2025 & 2033
- Figure 24: South America Smart Electronic Shelf Label (ESL) Volume (K), by Country 2025 & 2033
- Figure 25: South America Smart Electronic Shelf Label (ESL) Revenue Share (%), by Country 2025 & 2033
- Figure 26: South America Smart Electronic Shelf Label (ESL) Volume Share (%), by Country 2025 & 2033
- Figure 27: Europe Smart Electronic Shelf Label (ESL) Revenue (billion), by Application 2025 & 2033
- Figure 28: Europe Smart Electronic Shelf Label (ESL) Volume (K), by Application 2025 & 2033
- Figure 29: Europe Smart Electronic Shelf Label (ESL) Revenue Share (%), by Application 2025 & 2033
- Figure 30: Europe Smart Electronic Shelf Label (ESL) Volume Share (%), by Application 2025 & 2033
- Figure 31: Europe Smart Electronic Shelf Label (ESL) Revenue (billion), by Types 2025 & 2033
- Figure 32: Europe Smart Electronic Shelf Label (ESL) Volume (K), by Types 2025 & 2033
- Figure 33: Europe Smart Electronic Shelf Label (ESL) Revenue Share (%), by Types 2025 & 2033
- Figure 34: Europe Smart Electronic Shelf Label (ESL) Volume Share (%), by Types 2025 & 2033
- Figure 35: Europe Smart Electronic Shelf Label (ESL) Revenue (billion), by Country 2025 & 2033
- Figure 36: Europe Smart Electronic Shelf Label (ESL) Volume (K), by Country 2025 & 2033
- Figure 37: Europe Smart Electronic Shelf Label (ESL) Revenue Share (%), by Country 2025 & 2033
- Figure 38: Europe Smart Electronic Shelf Label (ESL) Volume Share (%), by Country 2025 & 2033
- Figure 39: Middle East & Africa Smart Electronic Shelf Label (ESL) Revenue (billion), by Application 2025 & 2033
- Figure 40: Middle East & Africa Smart Electronic Shelf Label (ESL) Volume (K), by Application 2025 & 2033
- Figure 41: Middle East & Africa Smart Electronic Shelf Label (ESL) Revenue Share (%), by Application 2025 & 2033
- Figure 42: Middle East & Africa Smart Electronic Shelf Label (ESL) Volume Share (%), by Application 2025 & 2033
- Figure 43: Middle East & Africa Smart Electronic Shelf Label (ESL) Revenue (billion), by Types 2025 & 2033
- Figure 44: Middle East & Africa Smart Electronic Shelf Label (ESL) Volume (K), by Types 2025 & 2033
- Figure 45: Middle East & Africa Smart Electronic Shelf Label (ESL) Revenue Share (%), by Types 2025 & 2033
- Figure 46: Middle East & Africa Smart Electronic Shelf Label (ESL) Volume Share (%), by Types 2025 & 2033
- Figure 47: Middle East & Africa Smart Electronic Shelf Label (ESL) Revenue (billion), by Country 2025 & 2033
- Figure 48: Middle East & Africa Smart Electronic Shelf Label (ESL) Volume (K), by Country 2025 & 2033
- Figure 49: Middle East & Africa Smart Electronic Shelf Label (ESL) Revenue Share (%), by Country 2025 & 2033
- Figure 50: Middle East & Africa Smart Electronic Shelf Label (ESL) Volume Share (%), by Country 2025 & 2033
- Figure 51: Asia Pacific Smart Electronic Shelf Label (ESL) Revenue (billion), by Application 2025 & 2033
- Figure 52: Asia Pacific Smart Electronic Shelf Label (ESL) Volume (K), by Application 2025 & 2033
- Figure 53: Asia Pacific Smart Electronic Shelf Label (ESL) Revenue Share (%), by Application 2025 & 2033
- Figure 54: Asia Pacific Smart Electronic Shelf Label (ESL) Volume Share (%), by Application 2025 & 2033
- Figure 55: Asia Pacific Smart Electronic Shelf Label (ESL) Revenue (billion), by Types 2025 & 2033
- Figure 56: Asia Pacific Smart Electronic Shelf Label (ESL) Volume (K), by Types 2025 & 2033
- Figure 57: Asia Pacific Smart Electronic Shelf Label (ESL) Revenue Share (%), by Types 2025 & 2033
- Figure 58: Asia Pacific Smart Electronic Shelf Label (ESL) Volume Share (%), by Types 2025 & 2033
- Figure 59: Asia Pacific Smart Electronic Shelf Label (ESL) Revenue (billion), by Country 2025 & 2033
- Figure 60: Asia Pacific Smart Electronic Shelf Label (ESL) Volume (K), by Country 2025 & 2033
- Figure 61: Asia Pacific Smart Electronic Shelf Label (ESL) Revenue Share (%), by Country 2025 & 2033
- Figure 62: Asia Pacific Smart Electronic Shelf Label (ESL) Volume Share (%), by Country 2025 & 2033
List of Tables
- Table 1: Global Smart Electronic Shelf Label (ESL) Revenue billion Forecast, by Application 2020 & 2033
- Table 2: Global Smart Electronic Shelf Label (ESL) Volume K Forecast, by Application 2020 & 2033
- Table 3: Global Smart Electronic Shelf Label (ESL) Revenue billion Forecast, by Types 2020 & 2033
- Table 4: Global Smart Electronic Shelf Label (ESL) Volume K Forecast, by Types 2020 & 2033
- Table 5: Global Smart Electronic Shelf Label (ESL) Revenue billion Forecast, by Region 2020 & 2033
- Table 6: Global Smart Electronic Shelf Label (ESL) Volume K Forecast, by Region 2020 & 2033
- Table 7: Global Smart Electronic Shelf Label (ESL) Revenue billion Forecast, by Application 2020 & 2033
- Table 8: Global Smart Electronic Shelf Label (ESL) Volume K Forecast, by Application 2020 & 2033
- Table 9: Global Smart Electronic Shelf Label (ESL) Revenue billion Forecast, by Types 2020 & 2033
- Table 10: Global Smart Electronic Shelf Label (ESL) Volume K Forecast, by Types 2020 & 2033
- Table 11: Global Smart Electronic Shelf Label (ESL) Revenue billion Forecast, by Country 2020 & 2033
- Table 12: Global Smart Electronic Shelf Label (ESL) Volume K Forecast, by Country 2020 & 2033
- Table 13: United States Smart Electronic Shelf Label (ESL) Revenue (billion) Forecast, by Application 2020 & 2033
- Table 14: United States Smart Electronic Shelf Label (ESL) Volume (K) Forecast, by Application 2020 & 2033
- Table 15: Canada Smart Electronic Shelf Label (ESL) Revenue (billion) Forecast, by Application 2020 & 2033
- Table 16: Canada Smart Electronic Shelf Label (ESL) Volume (K) Forecast, by Application 2020 & 2033
- Table 17: Mexico Smart Electronic Shelf Label (ESL) Revenue (billion) Forecast, by Application 2020 & 2033
- Table 18: Mexico Smart Electronic Shelf Label (ESL) Volume (K) Forecast, by Application 2020 & 2033
- Table 19: Global Smart Electronic Shelf Label (ESL) Revenue billion Forecast, by Application 2020 & 2033
- Table 20: Global Smart Electronic Shelf Label (ESL) Volume K Forecast, by Application 2020 & 2033
- Table 21: Global Smart Electronic Shelf Label (ESL) Revenue billion Forecast, by Types 2020 & 2033
- Table 22: Global Smart Electronic Shelf Label (ESL) Volume K Forecast, by Types 2020 & 2033
- Table 23: Global Smart Electronic Shelf Label (ESL) Revenue billion Forecast, by Country 2020 & 2033
- Table 24: Global Smart Electronic Shelf Label (ESL) Volume K Forecast, by Country 2020 & 2033
- Table 25: Brazil Smart Electronic Shelf Label (ESL) Revenue (billion) Forecast, by Application 2020 & 2033
- Table 26: Brazil Smart Electronic Shelf Label (ESL) Volume (K) Forecast, by Application 2020 & 2033
- Table 27: Argentina Smart Electronic Shelf Label (ESL) Revenue (billion) Forecast, by Application 2020 & 2033
- Table 28: Argentina Smart Electronic Shelf Label (ESL) Volume (K) Forecast, by Application 2020 & 2033
- Table 29: Rest of South America Smart Electronic Shelf Label (ESL) Revenue (billion) Forecast, by Application 2020 & 2033
- Table 30: Rest of South America Smart Electronic Shelf Label (ESL) Volume (K) Forecast, by Application 2020 & 2033
- Table 31: Global Smart Electronic Shelf Label (ESL) Revenue billion Forecast, by Application 2020 & 2033
- Table 32: Global Smart Electronic Shelf Label (ESL) Volume K Forecast, by Application 2020 & 2033
- Table 33: Global Smart Electronic Shelf Label (ESL) Revenue billion Forecast, by Types 2020 & 2033
- Table 34: Global Smart Electronic Shelf Label (ESL) Volume K Forecast, by Types 2020 & 2033
- Table 35: Global Smart Electronic Shelf Label (ESL) Revenue billion Forecast, by Country 2020 & 2033
- Table 36: Global Smart Electronic Shelf Label (ESL) Volume K Forecast, by Country 2020 & 2033
- Table 37: United Kingdom Smart Electronic Shelf Label (ESL) Revenue (billion) Forecast, by Application 2020 & 2033
- Table 38: United Kingdom Smart Electronic Shelf Label (ESL) Volume (K) Forecast, by Application 2020 & 2033
- Table 39: Germany Smart Electronic Shelf Label (ESL) Revenue (billion) Forecast, by Application 2020 & 2033
- Table 40: Germany Smart Electronic Shelf Label (ESL) Volume (K) Forecast, by Application 2020 & 2033
- Table 41: France Smart Electronic Shelf Label (ESL) Revenue (billion) Forecast, by Application 2020 & 2033
- Table 42: France Smart Electronic Shelf Label (ESL) Volume (K) Forecast, by Application 2020 & 2033
- Table 43: Italy Smart Electronic Shelf Label (ESL) Revenue (billion) Forecast, by Application 2020 & 2033
- Table 44: Italy Smart Electronic Shelf Label (ESL) Volume (K) Forecast, by Application 2020 & 2033
- Table 45: Spain Smart Electronic Shelf Label (ESL) Revenue (billion) Forecast, by Application 2020 & 2033
- Table 46: Spain Smart Electronic Shelf Label (ESL) Volume (K) Forecast, by Application 2020 & 2033
- Table 47: Russia Smart Electronic Shelf Label (ESL) Revenue (billion) Forecast, by Application 2020 & 2033
- Table 48: Russia Smart Electronic Shelf Label (ESL) Volume (K) Forecast, by Application 2020 & 2033
- Table 49: Benelux Smart Electronic Shelf Label (ESL) Revenue (billion) Forecast, by Application 2020 & 2033
- Table 50: Benelux Smart Electronic Shelf Label (ESL) Volume (K) Forecast, by Application 2020 & 2033
- Table 51: Nordics Smart Electronic Shelf Label (ESL) Revenue (billion) Forecast, by Application 2020 & 2033
- Table 52: Nordics Smart Electronic Shelf Label (ESL) Volume (K) Forecast, by Application 2020 & 2033
- Table 53: Rest of Europe Smart Electronic Shelf Label (ESL) Revenue (billion) Forecast, by Application 2020 & 2033
- Table 54: Rest of Europe Smart Electronic Shelf Label (ESL) Volume (K) Forecast, by Application 2020 & 2033
- Table 55: Global Smart Electronic Shelf Label (ESL) Revenue billion Forecast, by Application 2020 & 2033
- Table 56: Global Smart Electronic Shelf Label (ESL) Volume K Forecast, by Application 2020 & 2033
- Table 57: Global Smart Electronic Shelf Label (ESL) Revenue billion Forecast, by Types 2020 & 2033
- Table 58: Global Smart Electronic Shelf Label (ESL) Volume K Forecast, by Types 2020 & 2033
- Table 59: Global Smart Electronic Shelf Label (ESL) Revenue billion Forecast, by Country 2020 & 2033
- Table 60: Global Smart Electronic Shelf Label (ESL) Volume K Forecast, by Country 2020 & 2033
- Table 61: Turkey Smart Electronic Shelf Label (ESL) Revenue (billion) Forecast, by Application 2020 & 2033
- Table 62: Turkey Smart Electronic Shelf Label (ESL) Volume (K) Forecast, by Application 2020 & 2033
- Table 63: Israel Smart Electronic Shelf Label (ESL) Revenue (billion) Forecast, by Application 2020 & 2033
- Table 64: Israel Smart Electronic Shelf Label (ESL) Volume (K) Forecast, by Application 2020 & 2033
- Table 65: GCC Smart Electronic Shelf Label (ESL) Revenue (billion) Forecast, by Application 2020 & 2033
- Table 66: GCC Smart Electronic Shelf Label (ESL) Volume (K) Forecast, by Application 2020 & 2033
- Table 67: North Africa Smart Electronic Shelf Label (ESL) Revenue (billion) Forecast, by Application 2020 & 2033
- Table 68: North Africa Smart Electronic Shelf Label (ESL) Volume (K) Forecast, by Application 2020 & 2033
- Table 69: South Africa Smart Electronic Shelf Label (ESL) Revenue (billion) Forecast, by Application 2020 & 2033
- Table 70: South Africa Smart Electronic Shelf Label (ESL) Volume (K) Forecast, by Application 2020 & 2033
- Table 71: Rest of Middle East & Africa Smart Electronic Shelf Label (ESL) Revenue (billion) Forecast, by Application 2020 & 2033
- Table 72: Rest of Middle East & Africa Smart Electronic Shelf Label (ESL) Volume (K) Forecast, by Application 2020 & 2033
- Table 73: Global Smart Electronic Shelf Label (ESL) Revenue billion Forecast, by Application 2020 & 2033
- Table 74: Global Smart Electronic Shelf Label (ESL) Volume K Forecast, by Application 2020 & 2033
- Table 75: Global Smart Electronic Shelf Label (ESL) Revenue billion Forecast, by Types 2020 & 2033
- Table 76: Global Smart Electronic Shelf Label (ESL) Volume K Forecast, by Types 2020 & 2033
- Table 77: Global Smart Electronic Shelf Label (ESL) Revenue billion Forecast, by Country 2020 & 2033
- Table 78: Global Smart Electronic Shelf Label (ESL) Volume K Forecast, by Country 2020 & 2033
- Table 79: China Smart Electronic Shelf Label (ESL) Revenue (billion) Forecast, by Application 2020 & 2033
- Table 80: China Smart Electronic Shelf Label (ESL) Volume (K) Forecast, by Application 2020 & 2033
- Table 81: India Smart Electronic Shelf Label (ESL) Revenue (billion) Forecast, by Application 2020 & 2033
- Table 82: India Smart Electronic Shelf Label (ESL) Volume (K) Forecast, by Application 2020 & 2033
- Table 83: Japan Smart Electronic Shelf Label (ESL) Revenue (billion) Forecast, by Application 2020 & 2033
- Table 84: Japan Smart Electronic Shelf Label (ESL) Volume (K) Forecast, by Application 2020 & 2033
- Table 85: South Korea Smart Electronic Shelf Label (ESL) Revenue (billion) Forecast, by Application 2020 & 2033
- Table 86: South Korea Smart Electronic Shelf Label (ESL) Volume (K) Forecast, by Application 2020 & 2033
- Table 87: ASEAN Smart Electronic Shelf Label (ESL) Revenue (billion) Forecast, by Application 2020 & 2033
- Table 88: ASEAN Smart Electronic Shelf Label (ESL) Volume (K) Forecast, by Application 2020 & 2033
- Table 89: Oceania Smart Electronic Shelf Label (ESL) Revenue (billion) Forecast, by Application 2020 & 2033
- Table 90: Oceania Smart Electronic Shelf Label (ESL) Volume (K) Forecast, by Application 2020 & 2033
- Table 91: Rest of Asia Pacific Smart Electronic Shelf Label (ESL) Revenue (billion) Forecast, by Application 2020 & 2033
- Table 92: Rest of Asia Pacific Smart Electronic Shelf Label (ESL) Volume (K) Forecast, by Application 2020 & 2033
Frequently Asked Questions
1. What is the projected Compound Annual Growth Rate (CAGR) of the Smart Electronic Shelf Label (ESL)?
The projected CAGR is approximately 12.8%.
2. Which companies are prominent players in the Smart Electronic Shelf Label (ESL)?
Key companies in the market include SES-imagotag (BOE), Pricer, SOLUM, E Ink, DIGI, Hanshow, Displaydata, Opticon Sensors Europe B.V, LG innotek, Panasonic, Altierre, Huawei, Ooredoo, LabelNest, Hansab, Delfi Technologies, Future Shelf, ACLAS, MinewTag, YalaTech.
3. What are the main segments of the Smart Electronic Shelf Label (ESL)?
The market segments include Application, Types.
4. Can you provide details about the market size?
The market size is estimated to be USD 3.8 billion as of 2022.
5. What are some drivers contributing to market growth?
N/A
6. What are the notable trends driving market growth?
N/A
7. Are there any restraints impacting market growth?
N/A
8. Can you provide examples of recent developments in the market?
N/A
9. What pricing options are available for accessing the report?
Pricing options include single-user, multi-user, and enterprise licenses priced at USD 3350.00, USD 5025.00, and USD 6700.00 respectively.
10. Is the market size provided in terms of value or volume?
The market size is provided in terms of value, measured in billion and volume, measured in K.
11. Are there any specific market keywords associated with the report?
Yes, the market keyword associated with the report is "Smart Electronic Shelf Label (ESL)," which aids in identifying and referencing the specific market segment covered.
12. How do I determine which pricing option suits my needs best?
The pricing options vary based on user requirements and access needs. Individual users may opt for single-user licenses, while businesses requiring broader access may choose multi-user or enterprise licenses for cost-effective access to the report.
13. Are there any additional resources or data provided in the Smart Electronic Shelf Label (ESL) report?
While the report offers comprehensive insights, it's advisable to review the specific contents or supplementary materials provided to ascertain if additional resources or data are available.
14. How can I stay updated on further developments or reports in the Smart Electronic Shelf Label (ESL)?
To stay informed about further developments, trends, and reports in the Smart Electronic Shelf Label (ESL), consider subscribing to industry newsletters, following relevant companies and organizations, or regularly checking reputable industry news sources and publications.
Methodology
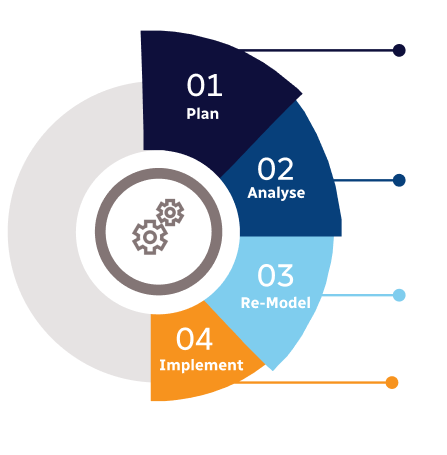
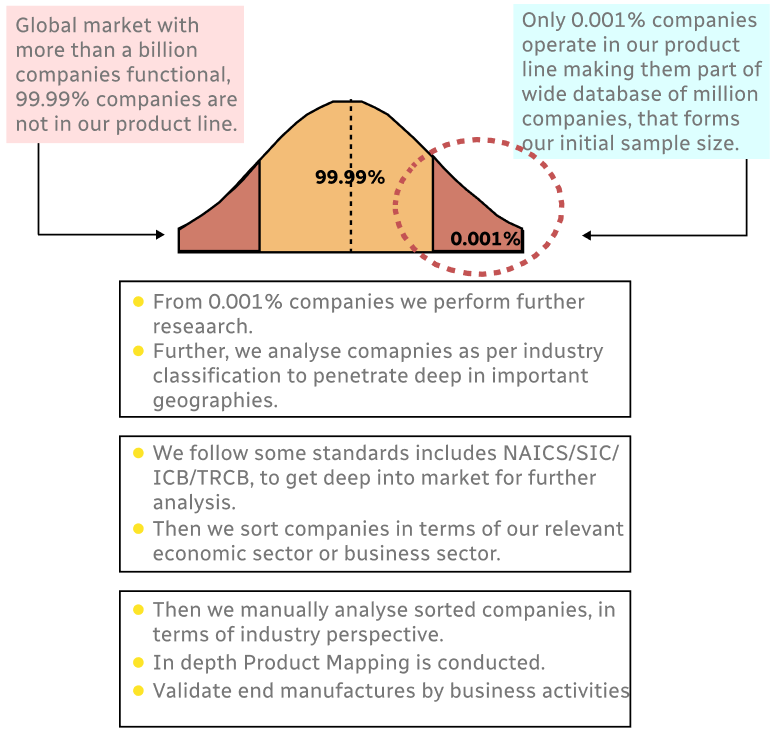
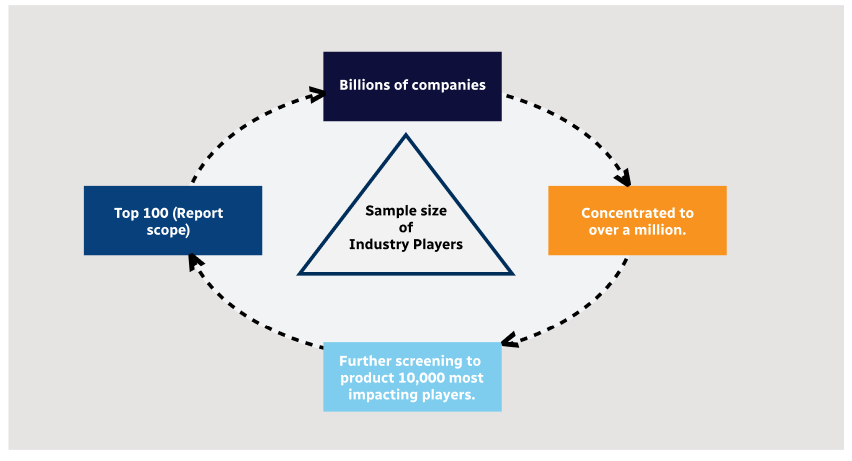
Step 1 - Identification of Relevant Samples Size from Population Database
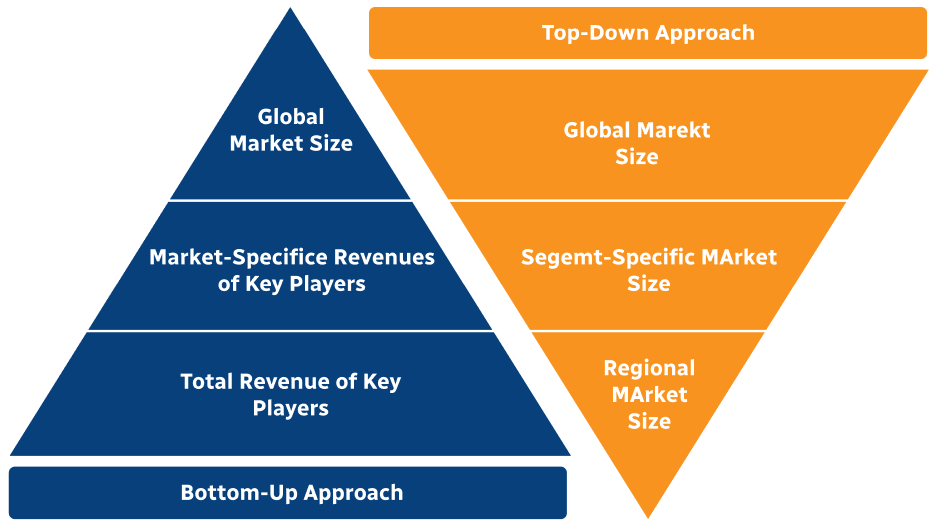
Step 2 - Approaches for Defining Global Market Size (Value, Volume* & Price*)
Note*: In applicable scenarios
Step 3 - Data Sources
Primary Research
- Web Analytics
- Survey Reports
- Research Institute
- Latest Research Reports
- Opinion Leaders
Secondary Research
- Annual Reports
- White Paper
- Latest Press Release
- Industry Association
- Paid Database
- Investor Presentations
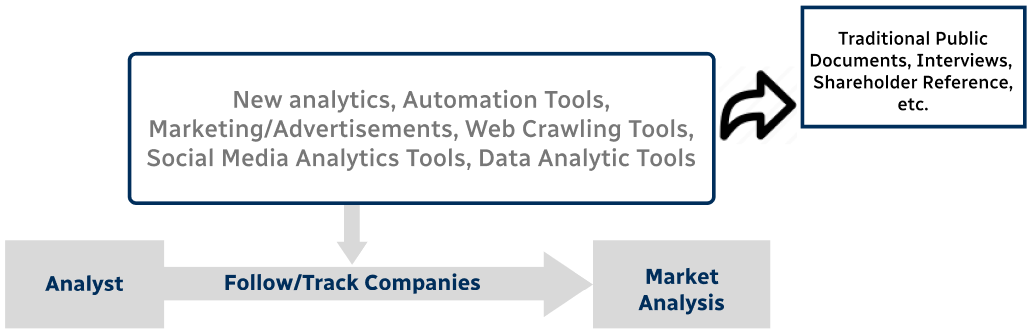
Step 4 - Data Triangulation
Involves using different sources of information in order to increase the validity of a study
These sources are likely to be stakeholders in a program - participants, other researchers, program staff, other community members, and so on.
Then we put all data in single framework & apply various statistical tools to find out the dynamic on the market.
During the analysis stage, feedback from the stakeholder groups would be compared to determine areas of agreement as well as areas of divergence