

Key Insights
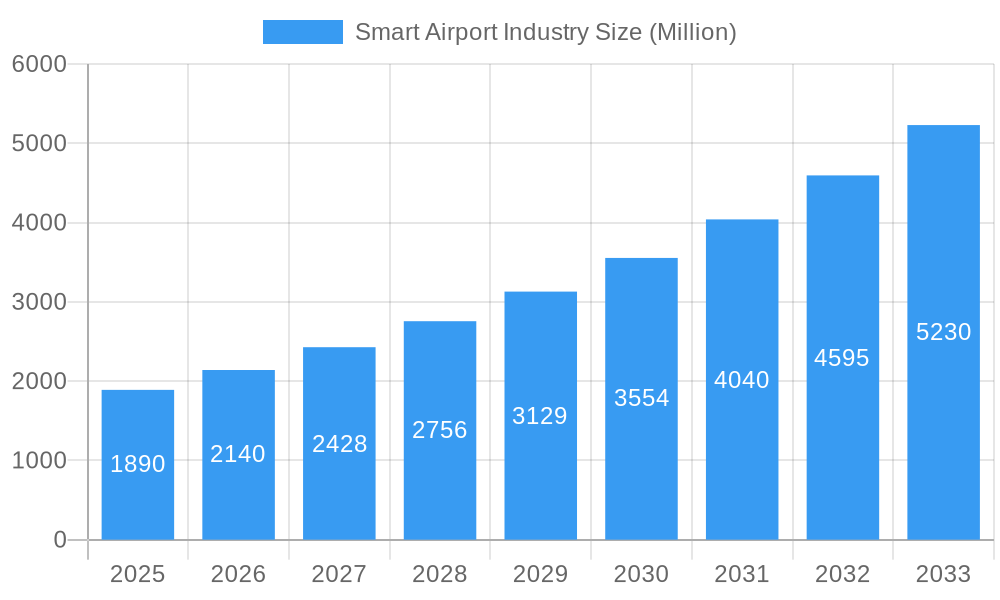
The global smart airport market is experiencing robust growth, projected to reach $1.89 billion in 2025 and maintain a Compound Annual Growth Rate (CAGR) of 13.63% from 2025 to 2033. This expansion is driven by several key factors. Firstly, increasing passenger traffic globally necessitates efficient and streamlined airport operations. Smart technologies, encompassing advanced security systems, improved communication networks, and optimized ground handling processes, directly address this need, enhancing passenger experience and operational efficiency. Secondly, the rising adoption of data analytics and artificial intelligence (AI) is revolutionizing airport management. Real-time data analysis allows for predictive maintenance, improved resource allocation, and proactive responses to potential disruptions, ultimately reducing operational costs and enhancing security. Furthermore, governments worldwide are actively investing in upgrading airport infrastructure to meet the demands of a growing aviation sector, further fueling market growth. The integration of smart technologies is becoming a critical component of these modernization efforts.
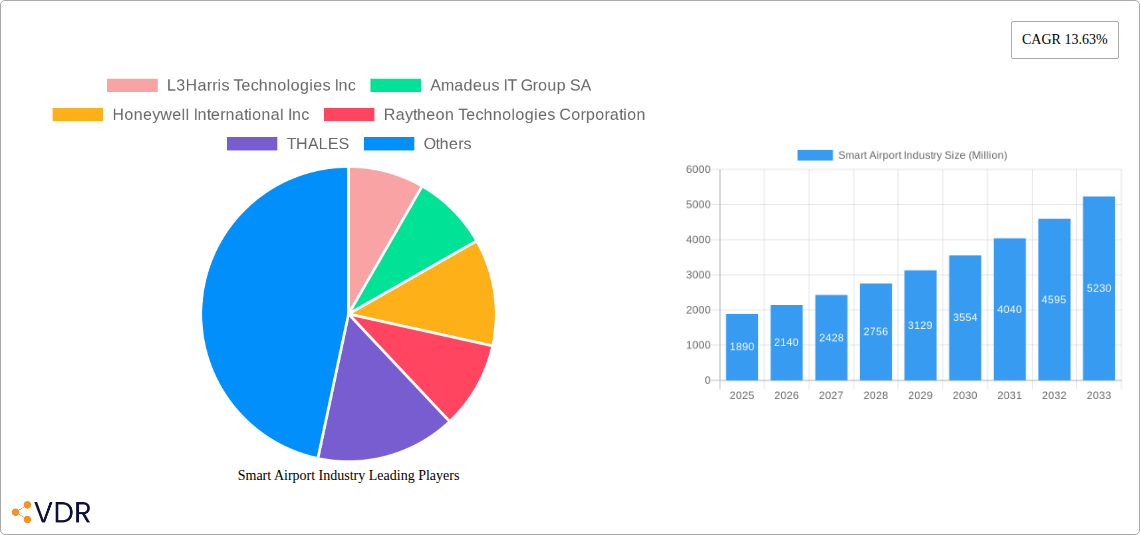
Smart Airport Industry Market Size (In Billion)
Market segmentation reveals significant opportunities across various technology and operational areas. Security systems, communication systems, and air/ground traffic control are key technology segments contributing significantly to market value. From an operational perspective, airside and terminal-side operations are witnessing accelerated smart technology adoption due to their critical roles in ensuring smooth passenger flow and efficient aircraft handling. Leading technology providers, including L3Harris Technologies, Amadeus IT Group, Honeywell, and Thales, are strategically positioned to capitalize on this growth, driven by their investments in innovative solutions and extensive partnerships within the aviation industry. Geographical expansion is another key factor, with North America and Europe currently dominating the market, while Asia-Pacific is poised for significant growth due to rapid infrastructure development and increasing air travel demand in the region.
Smart Airport Industry Company Market Share
Smart Airport Industry Market Report: 2019-2033
This comprehensive report provides an in-depth analysis of the Smart Airport industry, encompassing market dynamics, growth trends, key players, and future outlook. With a study period spanning 2019-2033, a base year of 2025, and a forecast period of 2025-2033, this report is an essential resource for industry professionals, investors, and strategic decision-makers. The report segments the market by technology (Security Systems, Communication Systems, Air and Ground Traffic Control, Passenger, Cargo & Baggage Ground Handling) and airport operation (Landside, Airside, Terminal Side), offering granular insights into market size and growth potential. The total market value is projected to reach xx Million by 2033.
Smart Airport Industry Market Dynamics & Structure
The smart airport market is characterized by moderate concentration, with a few key players holding substantial market influence. The rapid pace of technological innovation, particularly in areas like Artificial Intelligence (AI), the Internet of Things (IoT), and advanced big data analytics, serves as the primary engine for market expansion. Stringent global regulatory frameworks governing aviation security and passenger safety profoundly shape market dynamics, while the availability of direct competitive product substitutes remains limited due to the highly specialized nature of airport technologies. The end-user ecosystem is diverse, encompassing airport operators, airlines, ground handling services, and technology providers.
- Market Concentration: Moderately concentrated, with leading entities collectively dominating a significant market share.
- Key Technological Innovation Drivers: Advanced AI-powered security screening, seamless IoT-enabled infrastructure for real-time data flow, and predictive analytics derived from Big Data to optimize operational efficiency and resource allocation.
- Influential Regulatory Frameworks: Evolving and stringent aviation security mandates, coupled with passenger experience standards, are instrumental in driving the demand for cutting-edge, compliant smart airport solutions.
- Competitive Product Substitutes: The market exhibits limited direct substitutes due to the highly integrated and specialized nature of smart airport technologies, requiring bespoke solutions.
- Diverse End-User Demographics: Primarily airport authorities, global airlines, specialized ground handling companies, and forward-thinking technology solution providers.
- Mergers & Acquisitions (M&A) Trends: A prevailing trend towards strategic alliances and targeted acquisitions aimed at bolstering technological integration, expanding service portfolios, and achieving broader geographical market penetration.
- Innovation and Implementation Barriers: Significant upfront capital investment, complexities in integrating disparate legacy systems, and the paramount importance of robust data security protocols present ongoing challenges.
Smart Airport Industry Growth Trends & Insights
The smart airport sector has witnessed substantial growth during the recent historical period, propelled by escalating global passenger traffic and an intensified imperative for enhanced operational agility and fortified security measures. The market size is projected to achieve significant expansion, driven by the pervasive adoption of smart technologies across all facets of airport operations. This includes elevating the passenger journey through intuitive self-service kiosks and mobile applications, streamlining baggage handling systems for greater efficiency, and bolstering security protocols with advanced AI-driven surveillance and biometric identification. Emerging technological advancements, such as the widespread deployment of 5G networks and the increasing reliance on scalable cloud-based solutions, are acting as potent growth accelerators. Furthermore, shifts in consumer behavior towards a demand for seamless and personalized travel experiences are actively contributing to market expansion. The market penetration of critical smart technologies varies, with robust adoption rates observed in security systems compared to some specialized data analytics platforms.
Dominant Regions, Countries, or Segments in Smart Airport Industry
North America currently holds the largest market share in the smart airport industry, driven by significant investments in airport infrastructure upgrades and technological advancements. However, the Asia-Pacific region is projected to exhibit the highest growth rate during the forecast period, fueled by rapid economic development, rising air travel demand, and government initiatives promoting smart city development.
By Technology:
- Security Systems: Highest market share due to stringent security regulations and increasing threat levels.
- Air and Ground Traffic Control: Significant growth potential driven by increasing air traffic volume and need for efficient air traffic management.
- Passenger, Cargo & Baggage Ground Handling: Rapid adoption of automation and self-service technologies to improve efficiency and passenger experience.
By Airport Operation:
- Airside: Significant investment in technologies for air traffic management and aircraft operations.
- Terminal Side: Focus on improving passenger experience through self-service technologies and personalized services.
Key Drivers:
- Increased Air Passenger Traffic
- Rising Investments in Airport Infrastructure
- Government Initiatives Promoting Smart City Development
- Technological Advancements
Smart Airport Industry Product Landscape
The smart airport product landscape is characterized by a wide range of solutions encompassing security systems (biometric screening, threat detection), communication systems (5G networks, Wi-Fi), air and ground traffic control systems, and passenger services (self-service kiosks, mobile applications). The focus is on enhancing operational efficiency, improving passenger experience, and ensuring high security levels. Unique selling propositions include seamless integration, AI-powered analytics, and enhanced data security. Key technological advancements include the application of AI, IoT, and big data analytics for real-time insights and predictive maintenance.
Key Drivers, Barriers & Challenges in Smart Airport Industry
Key Drivers:
- Growing passenger traffic and increased demand for efficient airport operations.
- Stringent security regulations driving demand for advanced security technologies.
- Government initiatives promoting smart city development and digital transformation.
Challenges and Restraints:
- High initial investment costs associated with implementing smart airport technologies.
- Complexity in integrating various systems and ensuring seamless interoperability.
- Cybersecurity concerns related to the increasing reliance on interconnected systems.
- Supply chain disruptions impacting the availability of critical components. (Impact: xx% delay in project completion in some cases).
- Regulatory hurdles and compliance requirements slowing down adoption. (Estimated impact: xx Million in lost revenue in 2024).
Emerging Opportunities in Smart Airport Industry
- Expansion into untapped markets: Focus on emerging economies with rapidly growing air travel demand.
- Innovative applications: Integration of AI and machine learning for predictive maintenance and optimized resource allocation.
- Evolving consumer preferences: Personalized services and seamless travel experiences through mobile applications and self-service technologies.
Growth Accelerators in the Smart Airport Industry
Transformative technological breakthroughs, with a particular emphasis on AI, IoT, and the ubiquitous presence of 5G connectivity, are fundamental catalysts for sustained long-term market expansion. The establishment of robust strategic partnerships between pioneering technology developers and visionary airport operators is indispensable for the successful deployment and seamless integration of smart airport solutions. Furthermore, strategic market penetration into rapidly developing emerging economies and a concerted focus on implementing sustainable and environmentally conscious solutions will significantly contribute to the overall growth trajectory of the industry.
Key Players Shaping the Smart Airport Industry Market
- L3Harris Technologies Inc
- Amadeus IT Group SA
- Honeywell International Inc
- Raytheon Technologies Corporation
- THALES
- Sabre GLBL Inc
- IBM Corporation
- Cisco Systems Inc
- Siemens AG
- NATS Holdings Limited
- SITA
- T-Systems International GmbH
Notable Milestones in Smart Airport Industry Sector
- February 2023: Smiths Detection secured a significant contract to deploy state-of-the-art checkpoint security technology across five major international airports in New Zealand, enhancing passenger safety and screening efficiency.
- June 2022: Fiumicino Airport in Rome, Italy, successfully implemented an advanced 100% baggage X-ray control system, significantly improving security screening capabilities and compliance with international standards.
- June 2022: SITA, in collaboration with Alstef Group, launched their innovative Swift Drop self-bag drop solution, which saw its initial deployment at the newly inaugurated Felipe Ángeles International Airport in Mexico, aiming to expedite the check-in process for passengers.
In-Depth Smart Airport Industry Market Outlook
The smart airport market is strategically positioned for robust and sustained growth in the foreseeable future. This expansion will be propelled by continuous advancements in cutting-edge technologies, a substantial increase in global investments dedicated to modernizing airport infrastructure, and the ongoing resurgence of air travel. Key strategic opportunities lie in the development and implementation of novel solutions that demonstrably enhance operational efficiency, significantly elevate the passenger experience, and effectively address evolving security challenges. A resolute focus on integrating sustainable operational practices and fully harnessing the transformative potential of AI and machine learning will be paramount for achieving enduring success within this dynamic and rapidly evolving market landscape.
Smart Airport Industry Segmentation
-
1. Technology
- 1.1. Security Systems
- 1.2. Communication Systems
- 1.3. Air and Ground Traffic Control
- 1.4. Passenger, Cargo, and Baggage Ground Handling
-
2. Airport Operation
- 2.1. Landside
- 2.2. Airside
- 2.3. Terminal Side
Smart Airport Industry Segmentation By Geography
-
1. North America
- 1.1. United States
- 1.2. Canada
-
2. Europe
- 2.1. United Kingdom
- 2.2. France
- 2.3. Germany
- 2.4. Italy
- 2.5. Rest of Europe
-
3. Asia Pacific
- 3.1. China
- 3.2. India
- 3.3. Japan
- 3.4. South Korea
- 3.5. Rest of Asia Pacific
-
4. Latin America
- 4.1. Brazil
- 4.2. Rest of Latin America
-
5. Middle East and Africa
- 5.1. Saudi Arabia
- 5.2. United Arab Emirates
- 5.3. Rest of Middle East and Africa
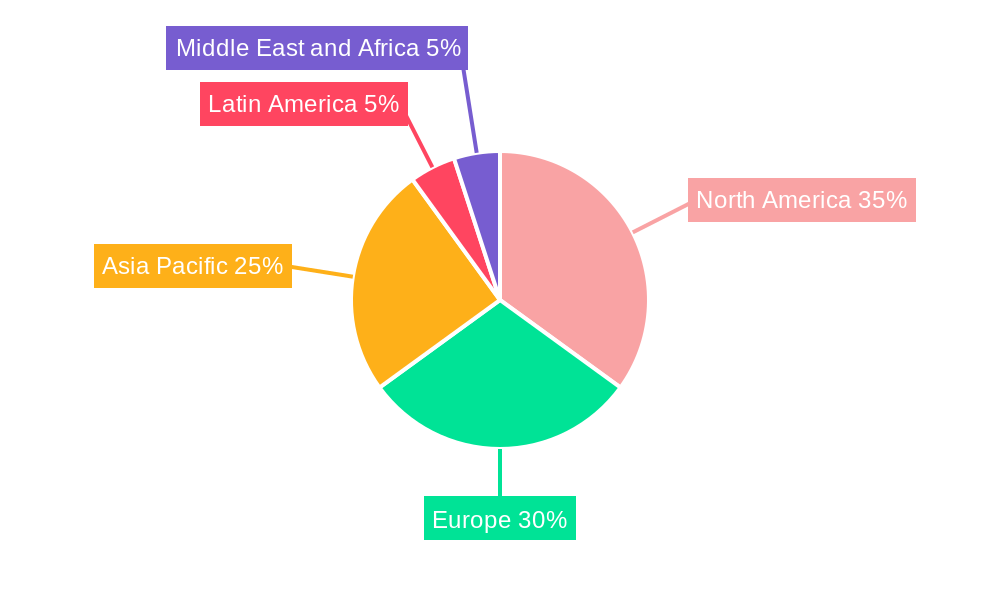
Smart Airport Industry Regional Market Share
Geographic Coverage of Smart Airport Industry
Smart Airport Industry REPORT HIGHLIGHTS
| Aspects | Details |
|---|---|
| Study Period | 2020-2034 |
| Base Year | 2025 |
| Estimated Year | 2026 |
| Forecast Period | 2026-2034 |
| Historical Period | 2020-2025 |
| Growth Rate | CAGR of 13.63% from 2020-2034 |
| Segmentation |
|
Table of Contents
- 1. Introduction
- 1.1. Research Scope
- 1.2. Market Segmentation
- 1.3. Research Objective
- 1.4. Definitions and Assumptions
- 2. Executive Summary
- 2.1. Market Snapshot
- 3. Market Dynamics
- 3.1. Market Drivers
- 3.2. Market Restrains
- 3.3. Market Trends
- 3.4. Market Opportunities
- 4. Market Factor Analysis
- 4.1. Porters Five Forces
- 4.1.1. Bargaining Power of Suppliers
- 4.1.2. Bargaining Power of Buyers
- 4.1.3. Threat of New Entrants
- 4.1.4. Threat of Substitutes
- 4.1.5. Competitive Rivalry
- 4.2. PESTEL analysis
- 4.3. BCG Analysis
- 4.3.1. Stars (High Growth, High Market Share)
- 4.3.2. Cash Cows (Low Growth, High Market Share)
- 4.3.3. Question Mark (High Growth, Low Market Share)
- 4.3.4. Dogs (Low Growth, Low Market Share)
- 4.4. Ansoff Matrix Analysis
- 4.5. Supply Chain Analysis
- 4.6. Regulatory Landscape
- 4.7. Current Market Potential and Opportunity Assessment (TAM–SAM–SOM Framework)
- 4.8. VDR Analyst Note
- 4.1. Porters Five Forces
- 5. Market Analysis, Insights and Forecast 2021-2033
- 5.1. Market Analysis, Insights and Forecast - by Technology
- 5.1.1. Security Systems
- 5.1.2. Communication Systems
- 5.1.3. Air and Ground Traffic Control
- 5.1.4. Passenger, Cargo, and Baggage Ground Handling
- 5.2. Market Analysis, Insights and Forecast - by Airport Operation
- 5.2.1. Landside
- 5.2.2. Airside
- 5.2.3. Terminal Side
- 5.3. Market Analysis, Insights and Forecast - by Region
- 5.3.1. North America
- 5.3.2. Europe
- 5.3.3. Asia Pacific
- 5.3.4. Latin America
- 5.3.5. Middle East and Africa
- 5.1. Market Analysis, Insights and Forecast - by Technology
- 6. Global Smart Airport Industry Analysis, Insights and Forecast, 2021-2033
- 6.1. Market Analysis, Insights and Forecast - by Technology
- 6.1.1. Security Systems
- 6.1.2. Communication Systems
- 6.1.3. Air and Ground Traffic Control
- 6.1.4. Passenger, Cargo, and Baggage Ground Handling
- 6.2. Market Analysis, Insights and Forecast - by Airport Operation
- 6.2.1. Landside
- 6.2.2. Airside
- 6.2.3. Terminal Side
- 6.1. Market Analysis, Insights and Forecast - by Technology
- 7. North America Smart Airport Industry Analysis, Insights and Forecast, 2021-2033
- 7.1. Market Analysis, Insights and Forecast - by Technology
- 7.1.1. Security Systems
- 7.1.2. Communication Systems
- 7.1.3. Air and Ground Traffic Control
- 7.1.4. Passenger, Cargo, and Baggage Ground Handling
- 7.2. Market Analysis, Insights and Forecast - by Airport Operation
- 7.2.1. Landside
- 7.2.2. Airside
- 7.2.3. Terminal Side
- 7.1. Market Analysis, Insights and Forecast - by Technology
- 8. Europe Smart Airport Industry Analysis, Insights and Forecast, 2021-2033
- 8.1. Market Analysis, Insights and Forecast - by Technology
- 8.1.1. Security Systems
- 8.1.2. Communication Systems
- 8.1.3. Air and Ground Traffic Control
- 8.1.4. Passenger, Cargo, and Baggage Ground Handling
- 8.2. Market Analysis, Insights and Forecast - by Airport Operation
- 8.2.1. Landside
- 8.2.2. Airside
- 8.2.3. Terminal Side
- 8.1. Market Analysis, Insights and Forecast - by Technology
- 9. Asia Pacific Smart Airport Industry Analysis, Insights and Forecast, 2021-2033
- 9.1. Market Analysis, Insights and Forecast - by Technology
- 9.1.1. Security Systems
- 9.1.2. Communication Systems
- 9.1.3. Air and Ground Traffic Control
- 9.1.4. Passenger, Cargo, and Baggage Ground Handling
- 9.2. Market Analysis, Insights and Forecast - by Airport Operation
- 9.2.1. Landside
- 9.2.2. Airside
- 9.2.3. Terminal Side
- 9.1. Market Analysis, Insights and Forecast - by Technology
- 10. Latin America Smart Airport Industry Analysis, Insights and Forecast, 2021-2033
- 10.1. Market Analysis, Insights and Forecast - by Technology
- 10.1.1. Security Systems
- 10.1.2. Communication Systems
- 10.1.3. Air and Ground Traffic Control
- 10.1.4. Passenger, Cargo, and Baggage Ground Handling
- 10.2. Market Analysis, Insights and Forecast - by Airport Operation
- 10.2.1. Landside
- 10.2.2. Airside
- 10.2.3. Terminal Side
- 10.1. Market Analysis, Insights and Forecast - by Technology
- 11. Middle East and Africa Smart Airport Industry Analysis, Insights and Forecast, 2021-2033
- 11.1. Market Analysis, Insights and Forecast - by Technology
- 11.1.1. Security Systems
- 11.1.2. Communication Systems
- 11.1.3. Air and Ground Traffic Control
- 11.1.4. Passenger, Cargo, and Baggage Ground Handling
- 11.2. Market Analysis, Insights and Forecast - by Airport Operation
- 11.2.1. Landside
- 11.2.2. Airside
- 11.2.3. Terminal Side
- 11.1. Market Analysis, Insights and Forecast - by Technology
- 12. Competitive Analysis
- 12.1. Company Profiles
- 12.1.1 L3Harris Technologies Inc
- 12.1.1.1. Company Overview
- 12.1.1.2. Products
- 12.1.1.3. Company Financials
- 12.1.1.4. SWOT Analysis
- 12.1.2 Amadeus IT Group SA
- 12.1.2.1. Company Overview
- 12.1.2.2. Products
- 12.1.2.3. Company Financials
- 12.1.2.4. SWOT Analysis
- 12.1.3 Honeywell International Inc
- 12.1.3.1. Company Overview
- 12.1.3.2. Products
- 12.1.3.3. Company Financials
- 12.1.3.4. SWOT Analysis
- 12.1.4 Raytheon Technologies Corporation
- 12.1.4.1. Company Overview
- 12.1.4.2. Products
- 12.1.4.3. Company Financials
- 12.1.4.4. SWOT Analysis
- 12.1.5 THALES
- 12.1.5.1. Company Overview
- 12.1.5.2. Products
- 12.1.5.3. Company Financials
- 12.1.5.4. SWOT Analysis
- 12.1.6 Sabre GLBL Inc
- 12.1.6.1. Company Overview
- 12.1.6.2. Products
- 12.1.6.3. Company Financials
- 12.1.6.4. SWOT Analysis
- 12.1.7 IBM Corporation
- 12.1.7.1. Company Overview
- 12.1.7.2. Products
- 12.1.7.3. Company Financials
- 12.1.7.4. SWOT Analysis
- 12.1.8 Cisco Systems Inc
- 12.1.8.1. Company Overview
- 12.1.8.2. Products
- 12.1.8.3. Company Financials
- 12.1.8.4. SWOT Analysis
- 12.1.9 Siemens AG
- 12.1.9.1. Company Overview
- 12.1.9.2. Products
- 12.1.9.3. Company Financials
- 12.1.9.4. SWOT Analysis
- 12.1.10 NATS Holdings Limited
- 12.1.10.1. Company Overview
- 12.1.10.2. Products
- 12.1.10.3. Company Financials
- 12.1.10.4. SWOT Analysis
- 12.1.11 SITA
- 12.1.11.1. Company Overview
- 12.1.11.2. Products
- 12.1.11.3. Company Financials
- 12.1.11.4. SWOT Analysis
- 12.1.12 T-Systems International GmbH
- 12.1.12.1. Company Overview
- 12.1.12.2. Products
- 12.1.12.3. Company Financials
- 12.1.12.4. SWOT Analysis
- 12.1.1 L3Harris Technologies Inc
- 12.2. Market Entropy
- 12.2.1 Company's Key Areas Served
- 12.2.2 Recent Developments
- 12.3. Company Market Share Analysis 2025
- 12.3.1 Top 5 Companies Market Share Analysis
- 12.3.2 Top 3 Companies Market Share Analysis
- 12.4. List of Potential Customers
- 13. Research Methodology
List of Figures
- Figure 1: Global Smart Airport Industry Revenue Breakdown (Million, %) by Region 2025 & 2033
- Figure 2: North America Smart Airport Industry Revenue (Million), by Technology 2025 & 2033
- Figure 3: North America Smart Airport Industry Revenue Share (%), by Technology 2025 & 2033
- Figure 4: North America Smart Airport Industry Revenue (Million), by Airport Operation 2025 & 2033
- Figure 5: North America Smart Airport Industry Revenue Share (%), by Airport Operation 2025 & 2033
- Figure 6: North America Smart Airport Industry Revenue (Million), by Country 2025 & 2033
- Figure 7: North America Smart Airport Industry Revenue Share (%), by Country 2025 & 2033
- Figure 8: Europe Smart Airport Industry Revenue (Million), by Technology 2025 & 2033
- Figure 9: Europe Smart Airport Industry Revenue Share (%), by Technology 2025 & 2033
- Figure 10: Europe Smart Airport Industry Revenue (Million), by Airport Operation 2025 & 2033
- Figure 11: Europe Smart Airport Industry Revenue Share (%), by Airport Operation 2025 & 2033
- Figure 12: Europe Smart Airport Industry Revenue (Million), by Country 2025 & 2033
- Figure 13: Europe Smart Airport Industry Revenue Share (%), by Country 2025 & 2033
- Figure 14: Asia Pacific Smart Airport Industry Revenue (Million), by Technology 2025 & 2033
- Figure 15: Asia Pacific Smart Airport Industry Revenue Share (%), by Technology 2025 & 2033
- Figure 16: Asia Pacific Smart Airport Industry Revenue (Million), by Airport Operation 2025 & 2033
- Figure 17: Asia Pacific Smart Airport Industry Revenue Share (%), by Airport Operation 2025 & 2033
- Figure 18: Asia Pacific Smart Airport Industry Revenue (Million), by Country 2025 & 2033
- Figure 19: Asia Pacific Smart Airport Industry Revenue Share (%), by Country 2025 & 2033
- Figure 20: Latin America Smart Airport Industry Revenue (Million), by Technology 2025 & 2033
- Figure 21: Latin America Smart Airport Industry Revenue Share (%), by Technology 2025 & 2033
- Figure 22: Latin America Smart Airport Industry Revenue (Million), by Airport Operation 2025 & 2033
- Figure 23: Latin America Smart Airport Industry Revenue Share (%), by Airport Operation 2025 & 2033
- Figure 24: Latin America Smart Airport Industry Revenue (Million), by Country 2025 & 2033
- Figure 25: Latin America Smart Airport Industry Revenue Share (%), by Country 2025 & 2033
- Figure 26: Middle East and Africa Smart Airport Industry Revenue (Million), by Technology 2025 & 2033
- Figure 27: Middle East and Africa Smart Airport Industry Revenue Share (%), by Technology 2025 & 2033
- Figure 28: Middle East and Africa Smart Airport Industry Revenue (Million), by Airport Operation 2025 & 2033
- Figure 29: Middle East and Africa Smart Airport Industry Revenue Share (%), by Airport Operation 2025 & 2033
- Figure 30: Middle East and Africa Smart Airport Industry Revenue (Million), by Country 2025 & 2033
- Figure 31: Middle East and Africa Smart Airport Industry Revenue Share (%), by Country 2025 & 2033
List of Tables
- Table 1: Global Smart Airport Industry Revenue Million Forecast, by Technology 2020 & 2033
- Table 2: Global Smart Airport Industry Revenue Million Forecast, by Airport Operation 2020 & 2033
- Table 3: Global Smart Airport Industry Revenue Million Forecast, by Region 2020 & 2033
- Table 4: Global Smart Airport Industry Revenue Million Forecast, by Technology 2020 & 2033
- Table 5: Global Smart Airport Industry Revenue Million Forecast, by Airport Operation 2020 & 2033
- Table 6: Global Smart Airport Industry Revenue Million Forecast, by Country 2020 & 2033
- Table 7: United States Smart Airport Industry Revenue (Million) Forecast, by Application 2020 & 2033
- Table 8: Canada Smart Airport Industry Revenue (Million) Forecast, by Application 2020 & 2033
- Table 9: Global Smart Airport Industry Revenue Million Forecast, by Technology 2020 & 2033
- Table 10: Global Smart Airport Industry Revenue Million Forecast, by Airport Operation 2020 & 2033
- Table 11: Global Smart Airport Industry Revenue Million Forecast, by Country 2020 & 2033
- Table 12: United Kingdom Smart Airport Industry Revenue (Million) Forecast, by Application 2020 & 2033
- Table 13: France Smart Airport Industry Revenue (Million) Forecast, by Application 2020 & 2033
- Table 14: Germany Smart Airport Industry Revenue (Million) Forecast, by Application 2020 & 2033
- Table 15: Italy Smart Airport Industry Revenue (Million) Forecast, by Application 2020 & 2033
- Table 16: Rest of Europe Smart Airport Industry Revenue (Million) Forecast, by Application 2020 & 2033
- Table 17: Global Smart Airport Industry Revenue Million Forecast, by Technology 2020 & 2033
- Table 18: Global Smart Airport Industry Revenue Million Forecast, by Airport Operation 2020 & 2033
- Table 19: Global Smart Airport Industry Revenue Million Forecast, by Country 2020 & 2033
- Table 20: China Smart Airport Industry Revenue (Million) Forecast, by Application 2020 & 2033
- Table 21: India Smart Airport Industry Revenue (Million) Forecast, by Application 2020 & 2033
- Table 22: Japan Smart Airport Industry Revenue (Million) Forecast, by Application 2020 & 2033
- Table 23: South Korea Smart Airport Industry Revenue (Million) Forecast, by Application 2020 & 2033
- Table 24: Rest of Asia Pacific Smart Airport Industry Revenue (Million) Forecast, by Application 2020 & 2033
- Table 25: Global Smart Airport Industry Revenue Million Forecast, by Technology 2020 & 2033
- Table 26: Global Smart Airport Industry Revenue Million Forecast, by Airport Operation 2020 & 2033
- Table 27: Global Smart Airport Industry Revenue Million Forecast, by Country 2020 & 2033
- Table 28: Brazil Smart Airport Industry Revenue (Million) Forecast, by Application 2020 & 2033
- Table 29: Rest of Latin America Smart Airport Industry Revenue (Million) Forecast, by Application 2020 & 2033
- Table 30: Global Smart Airport Industry Revenue Million Forecast, by Technology 2020 & 2033
- Table 31: Global Smart Airport Industry Revenue Million Forecast, by Airport Operation 2020 & 2033
- Table 32: Global Smart Airport Industry Revenue Million Forecast, by Country 2020 & 2033
- Table 33: Saudi Arabia Smart Airport Industry Revenue (Million) Forecast, by Application 2020 & 2033
- Table 34: United Arab Emirates Smart Airport Industry Revenue (Million) Forecast, by Application 2020 & 2033
- Table 35: Rest of Middle East and Africa Smart Airport Industry Revenue (Million) Forecast, by Application 2020 & 2033
Frequently Asked Questions
1. What is the projected Compound Annual Growth Rate (CAGR) of the Smart Airport Industry?
The projected CAGR is approximately 13.63%.
2. Which companies are prominent players in the Smart Airport Industry?
Key companies in the market include L3Harris Technologies Inc, Amadeus IT Group SA, Honeywell International Inc, Raytheon Technologies Corporation, THALES, Sabre GLBL Inc, IBM Corporation, Cisco Systems Inc, Siemens AG, NATS Holdings Limited, SITA, T-Systems International GmbH.
3. What are the main segments of the Smart Airport Industry?
The market segments include Technology, Airport Operation.
4. Can you provide details about the market size?
The market size is estimated to be USD 1.89 Million as of 2022.
5. What are some drivers contributing to market growth?
N/A
6. What are the notable trends driving market growth?
The Passenger. Cargo & Baggage Ground Handling Segment to Dominate the Market During the Forecasted Period.
7. Are there any restraints impacting market growth?
N/A
8. Can you provide examples of recent developments in the market?
In February 2023, the Aviation Security Service (AvSec) of New Zealand awarded a contract to Smiths Detection, a leader in threat detection and security inspection technologies, to provide cutting-edge checkpoint security technology for its five main international airports: Auckland, Christchurch, Dunedin, Queenstown, and Wellington.
9. What pricing options are available for accessing the report?
Pricing options include single-user, multi-user, and enterprise licenses priced at USD 4750, USD 5250, and USD 8750 respectively.
10. Is the market size provided in terms of value or volume?
The market size is provided in terms of value, measured in Million.
11. Are there any specific market keywords associated with the report?
Yes, the market keyword associated with the report is "Smart Airport Industry," which aids in identifying and referencing the specific market segment covered.
12. How do I determine which pricing option suits my needs best?
The pricing options vary based on user requirements and access needs. Individual users may opt for single-user licenses, while businesses requiring broader access may choose multi-user or enterprise licenses for cost-effective access to the report.
13. Are there any additional resources or data provided in the Smart Airport Industry report?
While the report offers comprehensive insights, it's advisable to review the specific contents or supplementary materials provided to ascertain if additional resources or data are available.
14. How can I stay updated on further developments or reports in the Smart Airport Industry?
To stay informed about further developments, trends, and reports in the Smart Airport Industry, consider subscribing to industry newsletters, following relevant companies and organizations, or regularly checking reputable industry news sources and publications.
Methodology
Step 1 - Identification of Relevant Samples Size from Population Database


Step 2 - Approaches for Defining Global Market Size (Value, Volume* & Price*)

Note*: In applicable scenarios
Step 3 - Data Sources
Primary Research
- Web Analytics
- Survey Reports
- Research Institute
- Latest Research Reports
- Opinion Leaders
Secondary Research
- Annual Reports
- White Paper
- Latest Press Release
- Industry Association
- Paid Database
- Investor Presentations

Step 4 - Data Triangulation
Involves using different sources of information in order to increase the validity of a study
These sources are likely to be stakeholders in a program - participants, other researchers, program staff, other community members, and so on.
Then we put all data in single framework & apply various statistical tools to find out the dynamic on the market.
During the analysis stage, feedback from the stakeholder groups would be compared to determine areas of agreement as well as areas of divergence