

Key Insights
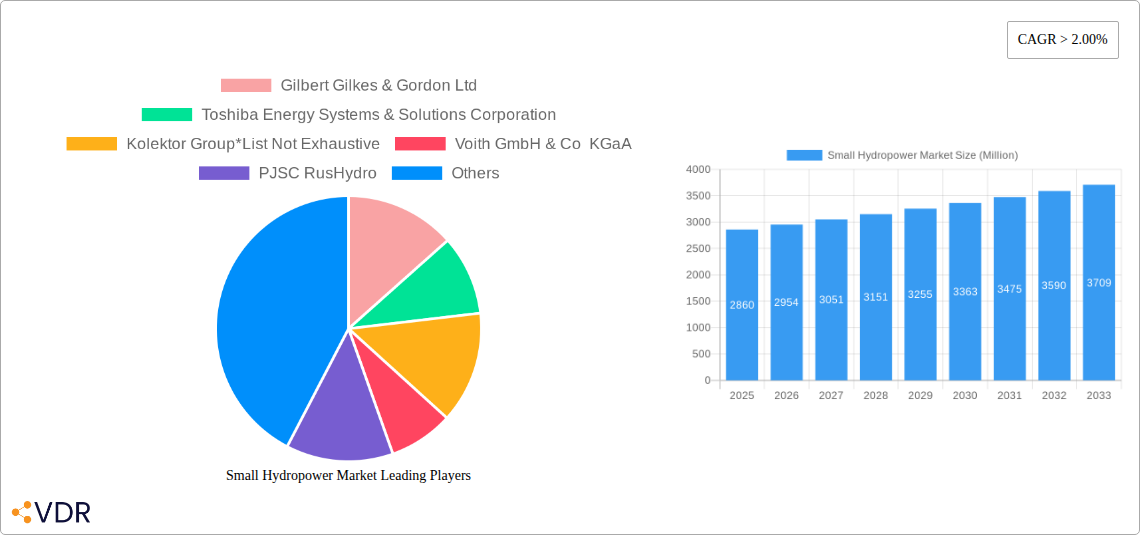
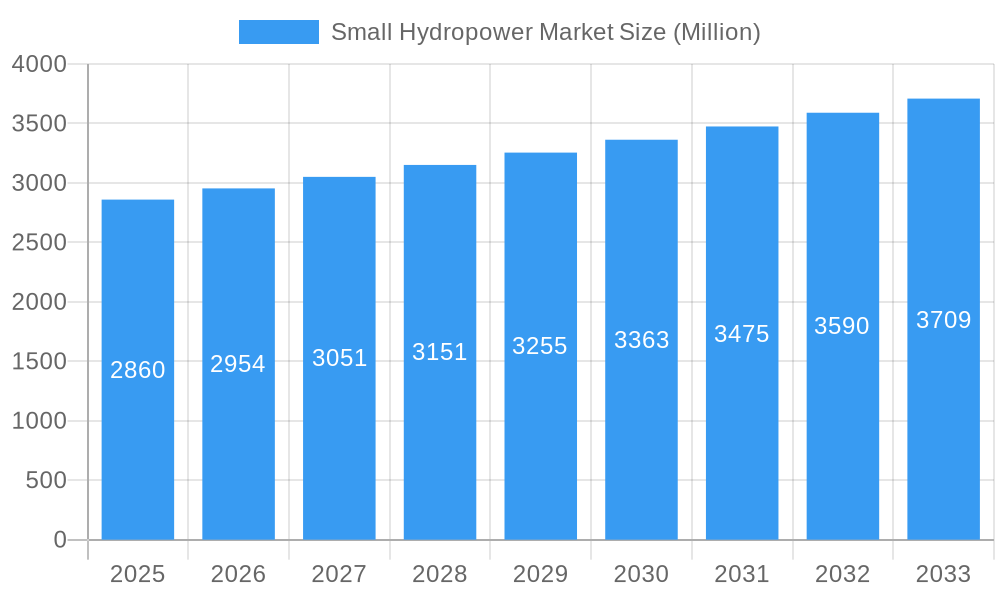
The Small Hydropower Market is poised for significant expansion, projected to reach USD 2.86 billion in 2025, with a robust Compound Annual Growth Rate (CAGR) of 3.3%. This growth trajectory is underpinned by increasing global demand for sustainable and decentralized energy solutions, particularly in regions actively seeking to reduce their carbon footprint and enhance energy independence. The market is driven by governmental support for renewable energy initiatives, technological advancements in turbine efficiency and small-scale infrastructure development, and the inherent cost-effectiveness and reliability of hydropower over its lifespan. Growing investments in upgrading existing power infrastructure and the development of new civil works projects requiring consistent and localized power sources further fuel this expansion. The sector is also benefiting from a growing awareness of the environmental benefits of small hydropower, which offers a cleaner alternative to fossil fuels with minimal ecological impact when managed responsibly.
Small Hydropower Market Market Size (In Billion)
The market is segmented by capacity into "Up to 1 MW," "1-10 MW," and by application into "Power Infrastructure," "Civil Works," and "Other Applications." The "1-10 MW" capacity segment and the "Power Infrastructure" application are anticipated to lead growth, reflecting the trend towards more substantial yet still decentralized power generation for industrial and community needs. Geographically, Asia Pacific is expected to be a dominant region, driven by rapid economic development and substantial investments in renewable energy in countries like China and India. North America and Europe also present significant opportunities, fueled by stringent environmental regulations and a strong emphasis on energy transition. Key players like GE Renewable Energy, Siemens Energy AG, Andritz AG, and Toshiba Energy Systems & Solutions Corporation are actively investing in research and development, innovative solutions, and strategic partnerships to capture market share and address the evolving demands for clean and reliable energy.
Small Hydropower Market Company Market Share
Small Hydropower Market: Unlocking Sustainable Energy Potential (2019-2033)
This comprehensive report provides an in-depth analysis of the global Small Hydropower market, meticulously examining its dynamics, growth trajectories, and future outlook. With a study period spanning from 2019 to 2033, and a base year of 2025, this report leverages extensive data from the historical period of 2019-2024 to deliver precise forecasts for the period 2025-2033. We dissect the market into key segments, including capacity (Up to 1 MW, 1-10 MW) and applications (Power Infrastructure, Civil Works, Other Applications), providing actionable insights for stakeholders. This analysis is critical for understanding the evolving landscape of renewable energy generation, driven by increasing demand for decentralized power solutions and supportive government policies. The report offers a granular view of the market, exploring its parent and child segments to identify unique opportunities and challenges. Discover the significant growth potential of small-scale hydropower as a vital contributor to a sustainable energy future.
Small Hydropower Market Market Dynamics & Structure
The global Small Hydropower market exhibits a moderately concentrated structure, characterized by the presence of established global players and a growing number of regional innovators. Technological innovation, particularly in turbine efficiency and digital monitoring systems, serves as a primary driver for market expansion. Robust regulatory frameworks and supportive government policies, including feed-in tariffs and renewable energy mandates, are crucial for sustained growth. Competitive product substitutes, such as solar PV and wind energy, pose a constant challenge, necessitating continuous improvement in cost-effectiveness and reliability. End-user demographics are shifting towards decentralized energy needs in rural areas and industrial applications seeking grid independence. Mergers and acquisitions (M&A) activity is a notable trend, with larger companies acquiring smaller, innovative firms to expand their technological capabilities and market reach.
- Market Concentration: Dominated by a mix of large multinational corporations and specialized small hydropower developers.
- Technological Innovation: Focus on increasing turbine efficiency, developing modular designs, and integrating smart grid technologies.
- Regulatory Frameworks: Government incentives, streamlined permitting processes, and grid connection policies significantly influence market penetration.
- Competitive Product Substitutes: While small hydropower offers reliable baseload power, it faces competition from intermittent but rapidly declining cost renewables like solar and wind.
- End-User Demographics: Growing demand from developing nations for rural electrification, and from industries seeking stable, green power.
- M&A Trends: Strategic acquisitions are common as companies seek to consolidate market share and access new technologies.
Small Hydropower Market Growth Trends & Insights
The Small Hydropower market is poised for substantial growth, driven by a confluence of factors including escalating global energy demands, the imperative for decarbonization, and advancements in turbine technology. The market size is projected to witness a Compound Annual Growth Rate (CAGR) of approximately 5.8% during the forecast period of 2025–2033, reaching an estimated $25.0 billion by 2033 from an estimated $15.0 billion in 2025. Adoption rates are accelerating, particularly in regions with abundant water resources and supportive government policies aimed at promoting renewable energy sources. Technological disruptions are continuously enhancing the efficiency and cost-effectiveness of small hydropower installations. Consumer behavior shifts are increasingly favoring sustainable and decentralized energy solutions, further fueling market expansion. The market penetration of small hydropower, though significant, still has considerable room for growth, especially in emerging economies.
The evolution of the market size is a testament to its resilience and its crucial role in the renewable energy mix. As nations strive to meet their climate change commitments, small hydropower offers a reliable, consistent, and environmentally friendly alternative to fossil fuels. The adoption rates are not uniform globally, with some regions demonstrating rapid uptake due to specific economic and environmental drivers, while others are still in the nascent stages of development. Technological advancements, such as the development of highly efficient turbines for low-head sites and the integration of advanced monitoring and control systems, are critical in improving the economic viability of small hydropower projects. This also includes innovations in pumped-storage hydropower, which can provide grid stability services.
Furthermore, shifts in consumer behavior are playing a vital role. There is a growing awareness among industries and communities about the benefits of localized, renewable energy generation. Small hydropower plants can provide stable, predictable power, reducing reliance on volatile fossil fuel markets and enhancing energy security. This demand for energy independence and sustainability directly translates into increased interest and investment in small hydropower projects. Market penetration is being further facilitated by the declining costs associated with certain components and the availability of specialized financing mechanisms for renewable energy projects. The ongoing development of mini-hydropower and micro-hydropower systems is also democratizing access to clean energy, extending its reach to even more remote and underserved populations. The overall trajectory indicates a robust and sustained expansion of the small hydropower sector.
Dominant Regions, Countries, or Segments in Small Hydropower Market
The Capacity: 1-10 MW segment is currently the dominant force driving growth within the global Small Hydropower market. This segment benefits from a favorable balance between generating significant power output and remaining within the definition of "small" hydropower, often simplifying regulatory hurdles and permitting processes compared to larger installations. Its adaptability to various site conditions and its ability to cater to the energy needs of medium-sized communities, industrial facilities, and agricultural enterprises make it highly attractive. The market share for this segment is estimated to be around 55% of the total small hydropower market value in 2025, with projections indicating continued dominance through 2033.
Dominant Segment (Capacity): 1-10 MW
- Key Drivers:
- Optimal Power Generation: Offers a substantial power output suitable for diverse applications without the complexities of large-scale projects.
- Regulatory Advantages: Often benefits from less stringent environmental reviews and permitting compared to larger hydropower plants.
- Site Adaptability: Can be implemented across a wider range of river systems and flow conditions.
- Economic Viability: Provides a strong return on investment for communities and businesses seeking reliable, renewable energy.
- Infrastructure Development: Crucial for upgrading and expanding electricity grids in developing regions.
- Key Drivers:
Dominant Application: Power Infrastructure
- Key Drivers:
- Grid Support & Stability: Small hydropower provides a consistent and dispatchable source of renewable energy, enhancing grid stability and reliability.
- Decentralized Power Generation: Enables the development of localized power systems, reducing transmission losses and improving energy access, particularly in remote areas.
- Renewable Energy Targets: Directly contributes to national and regional renewable energy portfolio standards and climate change mitigation goals.
- Demand Growth: Fueled by the increasing global demand for clean and sustainable electricity across various sectors.
- Technological Advancements: Innovations in turbine design and grid integration technologies make it more competitive for grid-connected applications.
- Key Drivers:
The growth potential within this segment is immense, supported by ongoing infrastructure development initiatives globally and a clear policy push towards renewable energy integration. Countries with robust river networks and a proactive approach to hydropower development are leading this charge. For instance, regions in Asia-Pacific and parts of Europe are witnessing significant investments in this capacity range, driven by both national energy security concerns and economic development strategies. The ability of 1-10 MW plants to be developed with relatively shorter construction times and lower capital expenditure per megawatt compared to large-scale hydro further solidifies their dominant position.
Small Hydropower Market Product Landscape
The product landscape in the Small Hydropower market is characterized by continuous innovation focused on enhancing efficiency, reducing environmental impact, and improving cost-effectiveness. Advanced turbine designs, including Kaplan, Francis, and Pelton turbines optimized for specific flow and head conditions, are prevalent. Micro and mini hydropower systems are increasingly featuring integrated digital control and monitoring systems, enabling remote operation and predictive maintenance. The use of advanced materials for turbine blades and casings contributes to increased durability and reduced maintenance requirements. Product differentiation also lies in modular designs that allow for scalable deployment and quicker installation, catering to the diverse needs of both grid-connected and off-grid applications. The performance metrics are consistently being pushed through ongoing research and development, leading to higher energy yields and lower levelized cost of electricity.
Key Drivers, Barriers & Challenges in Small Hydropower Market
Key Drivers:
- Growing Demand for Renewable Energy: Global initiatives to reduce carbon emissions and diversify energy sources are a primary impetus.
- Energy Security & Independence: Small hydropower provides a reliable and domestically sourced energy solution, reducing reliance on imported fuels.
- Technological Advancements: Improved turbine efficiency, modular designs, and smart grid integration are making projects more viable and cost-effective.
- Government Support & Incentives: Favorable policies, subsidies, and tax credits in many countries significantly boost investment in small hydropower.
- Decentralized Power Needs: The increasing requirement for localized and off-grid power solutions, particularly in rural and remote areas.
Barriers & Challenges:
- High Upfront Capital Costs: Initial investment for small hydropower projects can be substantial, posing a challenge for some developers.
- Regulatory & Permitting Hurdles: Complex environmental impact assessments and lengthy approval processes can cause project delays and increase costs.
- Environmental Concerns: While generally cleaner than fossil fuels, hydropower projects can still face scrutiny regarding their impact on aquatic ecosystems, fish migration, and local habitats.
- Site Specificity & Resource Availability: The viability of small hydropower is highly dependent on the availability of suitable water resources with adequate flow and head.
- Competition from Other Renewables: Rapidly falling costs of solar PV and wind energy present strong competitive alternatives in many markets.
- Supply Chain & Logistics: Challenges in sourcing specialized equipment and managing logistics for remote site construction can impact project timelines and costs.
Emerging Opportunities in Small Hydropower Market
Emerging opportunities in the Small Hydropower market are predominantly centered around untapped geographical markets, innovative technological applications, and evolving consumer preferences for sustainable energy. The development of small-scale pumped-storage hydropower systems presents a significant opportunity for grid-scale energy storage, complementing intermittent renewable sources like solar and wind. Furthermore, the integration of small hydropower with other renewable energy technologies, such as solar PV and battery storage, to create hybrid power systems offers enhanced reliability and grid independence. There is also a growing niche for small hydropower in supporting critical infrastructure, such as remote telecommunication towers and water treatment plants, where a stable and consistent power supply is paramount. The increasing focus on rural electrification in developing nations represents a vast untapped market for micro and mini hydropower solutions.
Growth Accelerators in the Small Hydropower Market Industry
Several catalysts are driving long-term growth within the Small Hydropower market. Technological breakthroughs in turbine efficiency, particularly for low-head and variable flow conditions, are expanding the range of viable project sites. Strategic partnerships between technology providers, project developers, and financial institutions are crucial for de-risking investments and accelerating project deployment. Market expansion strategies are increasingly focused on developing standardized, modular solutions that can be rapidly deployed, reducing construction times and costs. The growing emphasis on green finance and sustainable investment portfolios is also directing more capital towards renewable energy projects, including small hydropower. Furthermore, international collaborations and knowledge sharing are fostering the adoption of best practices and accelerating the development of enabling policy frameworks.
Key Players Shaping the Small Hydropower Market Market
- Gilbert Gilkes & Gordon Ltd
- Toshiba Energy Systems & Solutions Corporation
- Kolektor Group
- Voith GmbH & Co KGaA
- PJSC RusHydro
- Siemens Energy AG
- Natel Energy Inc
- GE Renewable Energy
- Andritz AG
- FLOVEL Energy Private Limited
Notable Milestones in Small Hydropower Market Sector
- July 2022: SMEC was hired by KPower Engineering Sdn Bhd (KPEng), together with Tellhow International Engineering & Contracting Co Ltd, to review the design and propose modifications required for three small hydropower plants in East Malaysia. The three hydropower projects at Sungai Bengkoka Upper, Sungai Bengkoka Lower, and Sungai Togohu in Kota Marudu, Sabah, had a planned capacity totaling 29.1 MW. The consortium had taken over from the previous contractor to complete the engineering, design, procurement, construction, and commissioning works, and ORP, a subsidiary of OHP Ventures Sdn Bhd, owns the project.
- July 2022: The Development Bank of the Philippines (DBP) approved USD 12.0 million in funding to support the development of the 4.6 MW Dupinga Mini Hydropower project in Gabaldon, Nueva Ecija, in the Philippines. The DBP's funding for the Dupinga Project helps the government reach its 30% renewable energy goal by 2030.
In-Depth Small Hydropower Market Market Outlook
The future outlook for the Small Hydropower market is exceptionally promising, driven by sustained global efforts towards energy transition and a growing recognition of hydropower's unique advantages. Growth accelerators will continue to include technological advancements in turbine design, leading to greater efficiency and adaptability, and the increasing integration of smart grid technologies for optimized energy management. Strategic partnerships and the expansion of green financing mechanisms will further unlock investment potential. The market is expected to witness a significant expansion in decentralized energy solutions, particularly in developing economies seeking to electrify rural areas. The potential for small-scale pumped hydro storage to bolster grid stability in an era of increasing renewable energy penetration presents a substantial future opportunity, solidifying small hydropower's vital role in a sustainable energy landscape.
Small Hydropower Market Segmentation
-
1. Capacity
- 1.1. Up to 1 MW
- 1.2. 1-10 MW
-
2. Application
- 2.1. Power Infrastructure
- 2.2. Civil Works
- 2.3. Other Applications
Small Hydropower Market Segmentation By Geography
-
1. North America
- 1.1. United States
- 1.2. Canada
- 1.3. Rest of North America
-
2. Europe
- 2.1. Germany
- 2.2. United Kingdom
- 2.3. France
- 2.4. Italy
- 2.5. Spain
- 2.6. Nordic
- 2.7. Turkey
- 2.8. Russia
- 2.9. Rest of Europe
-
3. Asia Pacific
- 3.1. China
- 3.2. India
- 3.3. Japan
- 3.4. South Korea
- 3.5. Malaysia
- 3.6. Thailand
- 3.7. Vietnam
- 3.8. Rest of Asia Pacific
-
4. Middle East and Africa
- 4.1. Saudi Arabia
- 4.2. United Arab Emirates
- 4.3. Nigeria
- 4.4. Egypt
- 4.5. South Africa
- 4.6. Rest of Middle East and Africa
-
5. South America
- 5.1. Brazil
- 5.2. Argentina
- 5.3. Colombia
- 5.4. Rest of South America
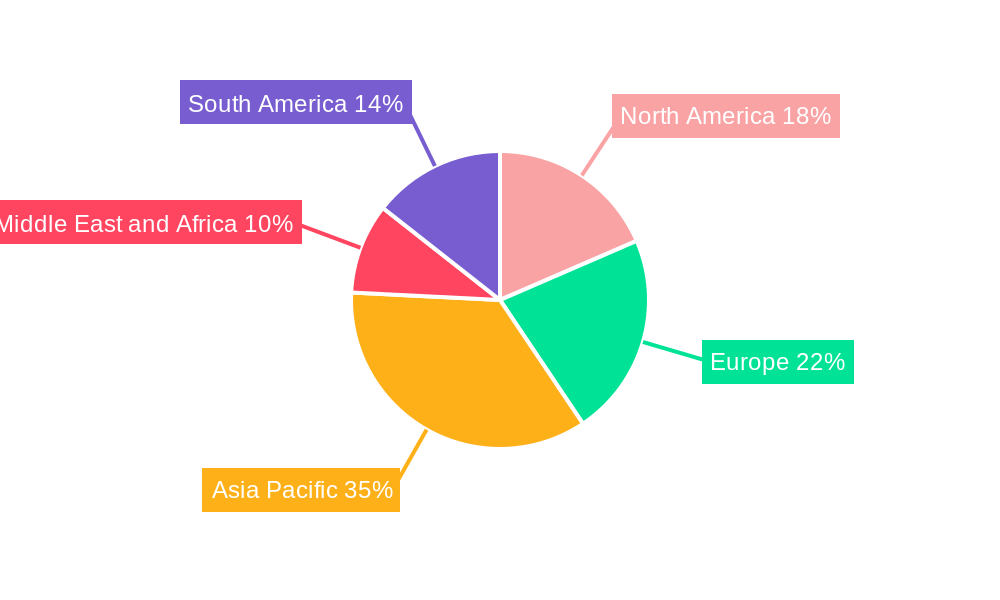
Small Hydropower Market Regional Market Share
Geographic Coverage of Small Hydropower Market
Small Hydropower Market REPORT HIGHLIGHTS
| Aspects | Details |
|---|---|
| Study Period | 2020-2034 |
| Base Year | 2025 |
| Estimated Year | 2026 |
| Forecast Period | 2026-2034 |
| Historical Period | 2020-2025 |
| Growth Rate | CAGR of 2.8% from 2020-2034 |
| Segmentation |
|
Table of Contents
- 1. Introduction
- 1.1. Research Scope
- 1.2. Market Segmentation
- 1.3. Research Objective
- 1.4. Definitions and Assumptions
- 2. Executive Summary
- 2.1. Market Snapshot
- 3. Market Dynamics
- 3.1. Market Drivers
- 3.2. Market Restrains
- 3.3. Market Trends
- 3.4. Market Opportunities
- 4. Market Factor Analysis
- 4.1. Porters Five Forces
- 4.1.1. Bargaining Power of Suppliers
- 4.1.2. Bargaining Power of Buyers
- 4.1.3. Threat of New Entrants
- 4.1.4. Threat of Substitutes
- 4.1.5. Competitive Rivalry
- 4.2. PESTEL analysis
- 4.3. BCG Analysis
- 4.3.1. Stars (High Growth, High Market Share)
- 4.3.2. Cash Cows (Low Growth, High Market Share)
- 4.3.3. Question Mark (High Growth, Low Market Share)
- 4.3.4. Dogs (Low Growth, Low Market Share)
- 4.4. Ansoff Matrix Analysis
- 4.5. Supply Chain Analysis
- 4.6. Regulatory Landscape
- 4.7. Current Market Potential and Opportunity Assessment (TAM–SAM–SOM Framework)
- 4.8. VDR Analyst Note
- 4.1. Porters Five Forces
- 5. Market Analysis, Insights and Forecast 2021-2033
- 5.1. Market Analysis, Insights and Forecast - by Capacity
- 5.1.1. Up to 1 MW
- 5.1.2. 1-10 MW
- 5.2. Market Analysis, Insights and Forecast - by Application
- 5.2.1. Power Infrastructure
- 5.2.2. Civil Works
- 5.2.3. Other Applications
- 5.3. Market Analysis, Insights and Forecast - by Region
- 5.3.1. North America
- 5.3.2. Europe
- 5.3.3. Asia Pacific
- 5.3.4. Middle East and Africa
- 5.3.5. South America
- 5.1. Market Analysis, Insights and Forecast - by Capacity
- 6. Global Small Hydropower Market Analysis, Insights and Forecast, 2021-2033
- 6.1. Market Analysis, Insights and Forecast - by Capacity
- 6.1.1. Up to 1 MW
- 6.1.2. 1-10 MW
- 6.2. Market Analysis, Insights and Forecast - by Application
- 6.2.1. Power Infrastructure
- 6.2.2. Civil Works
- 6.2.3. Other Applications
- 6.1. Market Analysis, Insights and Forecast - by Capacity
- 7. North America Small Hydropower Market Analysis, Insights and Forecast, 2021-2033
- 7.1. Market Analysis, Insights and Forecast - by Capacity
- 7.1.1. Up to 1 MW
- 7.1.2. 1-10 MW
- 7.2. Market Analysis, Insights and Forecast - by Application
- 7.2.1. Power Infrastructure
- 7.2.2. Civil Works
- 7.2.3. Other Applications
- 7.1. Market Analysis, Insights and Forecast - by Capacity
- 8. Europe Small Hydropower Market Analysis, Insights and Forecast, 2021-2033
- 8.1. Market Analysis, Insights and Forecast - by Capacity
- 8.1.1. Up to 1 MW
- 8.1.2. 1-10 MW
- 8.2. Market Analysis, Insights and Forecast - by Application
- 8.2.1. Power Infrastructure
- 8.2.2. Civil Works
- 8.2.3. Other Applications
- 8.1. Market Analysis, Insights and Forecast - by Capacity
- 9. Asia Pacific Small Hydropower Market Analysis, Insights and Forecast, 2021-2033
- 9.1. Market Analysis, Insights and Forecast - by Capacity
- 9.1.1. Up to 1 MW
- 9.1.2. 1-10 MW
- 9.2. Market Analysis, Insights and Forecast - by Application
- 9.2.1. Power Infrastructure
- 9.2.2. Civil Works
- 9.2.3. Other Applications
- 9.1. Market Analysis, Insights and Forecast - by Capacity
- 10. Middle East and Africa Small Hydropower Market Analysis, Insights and Forecast, 2021-2033
- 10.1. Market Analysis, Insights and Forecast - by Capacity
- 10.1.1. Up to 1 MW
- 10.1.2. 1-10 MW
- 10.2. Market Analysis, Insights and Forecast - by Application
- 10.2.1. Power Infrastructure
- 10.2.2. Civil Works
- 10.2.3. Other Applications
- 10.1. Market Analysis, Insights and Forecast - by Capacity
- 11. South America Small Hydropower Market Analysis, Insights and Forecast, 2021-2033
- 11.1. Market Analysis, Insights and Forecast - by Capacity
- 11.1.1. Up to 1 MW
- 11.1.2. 1-10 MW
- 11.2. Market Analysis, Insights and Forecast - by Application
- 11.2.1. Power Infrastructure
- 11.2.2. Civil Works
- 11.2.3. Other Applications
- 11.1. Market Analysis, Insights and Forecast - by Capacity
- 12. Competitive Analysis
- 12.1. Company Profiles
- 12.1.1 Gilbert Gilkes & Gordon Ltd
- 12.1.1.1. Company Overview
- 12.1.1.2. Products
- 12.1.1.3. Company Financials
- 12.1.1.4. SWOT Analysis
- 12.1.2 Toshiba Energy Systems & Solutions Corporation
- 12.1.2.1. Company Overview
- 12.1.2.2. Products
- 12.1.2.3. Company Financials
- 12.1.2.4. SWOT Analysis
- 12.1.3 Kolektor Group*List Not Exhaustive
- 12.1.3.1. Company Overview
- 12.1.3.2. Products
- 12.1.3.3. Company Financials
- 12.1.3.4. SWOT Analysis
- 12.1.4 Voith GmbH & Co KGaA
- 12.1.4.1. Company Overview
- 12.1.4.2. Products
- 12.1.4.3. Company Financials
- 12.1.4.4. SWOT Analysis
- 12.1.5 PJSC RusHydro
- 12.1.5.1. Company Overview
- 12.1.5.2. Products
- 12.1.5.3. Company Financials
- 12.1.5.4. SWOT Analysis
- 12.1.6 Siemens Energy AG
- 12.1.6.1. Company Overview
- 12.1.6.2. Products
- 12.1.6.3. Company Financials
- 12.1.6.4. SWOT Analysis
- 12.1.7 Natel Energy Inc
- 12.1.7.1. Company Overview
- 12.1.7.2. Products
- 12.1.7.3. Company Financials
- 12.1.7.4. SWOT Analysis
- 12.1.8 GE Renewable Energy
- 12.1.8.1. Company Overview
- 12.1.8.2. Products
- 12.1.8.3. Company Financials
- 12.1.8.4. SWOT Analysis
- 12.1.9 Andritz AG
- 12.1.9.1. Company Overview
- 12.1.9.2. Products
- 12.1.9.3. Company Financials
- 12.1.9.4. SWOT Analysis
- 12.1.10 FLOVEL Energy Private Limited
- 12.1.10.1. Company Overview
- 12.1.10.2. Products
- 12.1.10.3. Company Financials
- 12.1.10.4. SWOT Analysis
- 12.1.1 Gilbert Gilkes & Gordon Ltd
- 12.2. Market Entropy
- 12.2.1 Company's Key Areas Served
- 12.2.2 Recent Developments
- 12.3. Company Market Share Analysis 2025
- 12.3.1 Top 5 Companies Market Share Analysis
- 12.3.2 Top 3 Companies Market Share Analysis
- 12.4. List of Potential Customers
- 13. Research Methodology
List of Figures
- Figure 1: Global Small Hydropower Market Revenue Breakdown (billion, %) by Region 2025 & 2033
- Figure 2: Global Small Hydropower Market Volume Breakdown (gigawatt, %) by Region 2025 & 2033
- Figure 3: North America Small Hydropower Market Revenue (billion), by Capacity 2025 & 2033
- Figure 4: North America Small Hydropower Market Volume (gigawatt), by Capacity 2025 & 2033
- Figure 5: North America Small Hydropower Market Revenue Share (%), by Capacity 2025 & 2033
- Figure 6: North America Small Hydropower Market Volume Share (%), by Capacity 2025 & 2033
- Figure 7: North America Small Hydropower Market Revenue (billion), by Application 2025 & 2033
- Figure 8: North America Small Hydropower Market Volume (gigawatt), by Application 2025 & 2033
- Figure 9: North America Small Hydropower Market Revenue Share (%), by Application 2025 & 2033
- Figure 10: North America Small Hydropower Market Volume Share (%), by Application 2025 & 2033
- Figure 11: North America Small Hydropower Market Revenue (billion), by Country 2025 & 2033
- Figure 12: North America Small Hydropower Market Volume (gigawatt), by Country 2025 & 2033
- Figure 13: North America Small Hydropower Market Revenue Share (%), by Country 2025 & 2033
- Figure 14: North America Small Hydropower Market Volume Share (%), by Country 2025 & 2033
- Figure 15: Europe Small Hydropower Market Revenue (billion), by Capacity 2025 & 2033
- Figure 16: Europe Small Hydropower Market Volume (gigawatt), by Capacity 2025 & 2033
- Figure 17: Europe Small Hydropower Market Revenue Share (%), by Capacity 2025 & 2033
- Figure 18: Europe Small Hydropower Market Volume Share (%), by Capacity 2025 & 2033
- Figure 19: Europe Small Hydropower Market Revenue (billion), by Application 2025 & 2033
- Figure 20: Europe Small Hydropower Market Volume (gigawatt), by Application 2025 & 2033
- Figure 21: Europe Small Hydropower Market Revenue Share (%), by Application 2025 & 2033
- Figure 22: Europe Small Hydropower Market Volume Share (%), by Application 2025 & 2033
- Figure 23: Europe Small Hydropower Market Revenue (billion), by Country 2025 & 2033
- Figure 24: Europe Small Hydropower Market Volume (gigawatt), by Country 2025 & 2033
- Figure 25: Europe Small Hydropower Market Revenue Share (%), by Country 2025 & 2033
- Figure 26: Europe Small Hydropower Market Volume Share (%), by Country 2025 & 2033
- Figure 27: Asia Pacific Small Hydropower Market Revenue (billion), by Capacity 2025 & 2033
- Figure 28: Asia Pacific Small Hydropower Market Volume (gigawatt), by Capacity 2025 & 2033
- Figure 29: Asia Pacific Small Hydropower Market Revenue Share (%), by Capacity 2025 & 2033
- Figure 30: Asia Pacific Small Hydropower Market Volume Share (%), by Capacity 2025 & 2033
- Figure 31: Asia Pacific Small Hydropower Market Revenue (billion), by Application 2025 & 2033
- Figure 32: Asia Pacific Small Hydropower Market Volume (gigawatt), by Application 2025 & 2033
- Figure 33: Asia Pacific Small Hydropower Market Revenue Share (%), by Application 2025 & 2033
- Figure 34: Asia Pacific Small Hydropower Market Volume Share (%), by Application 2025 & 2033
- Figure 35: Asia Pacific Small Hydropower Market Revenue (billion), by Country 2025 & 2033
- Figure 36: Asia Pacific Small Hydropower Market Volume (gigawatt), by Country 2025 & 2033
- Figure 37: Asia Pacific Small Hydropower Market Revenue Share (%), by Country 2025 & 2033
- Figure 38: Asia Pacific Small Hydropower Market Volume Share (%), by Country 2025 & 2033
- Figure 39: Middle East and Africa Small Hydropower Market Revenue (billion), by Capacity 2025 & 2033
- Figure 40: Middle East and Africa Small Hydropower Market Volume (gigawatt), by Capacity 2025 & 2033
- Figure 41: Middle East and Africa Small Hydropower Market Revenue Share (%), by Capacity 2025 & 2033
- Figure 42: Middle East and Africa Small Hydropower Market Volume Share (%), by Capacity 2025 & 2033
- Figure 43: Middle East and Africa Small Hydropower Market Revenue (billion), by Application 2025 & 2033
- Figure 44: Middle East and Africa Small Hydropower Market Volume (gigawatt), by Application 2025 & 2033
- Figure 45: Middle East and Africa Small Hydropower Market Revenue Share (%), by Application 2025 & 2033
- Figure 46: Middle East and Africa Small Hydropower Market Volume Share (%), by Application 2025 & 2033
- Figure 47: Middle East and Africa Small Hydropower Market Revenue (billion), by Country 2025 & 2033
- Figure 48: Middle East and Africa Small Hydropower Market Volume (gigawatt), by Country 2025 & 2033
- Figure 49: Middle East and Africa Small Hydropower Market Revenue Share (%), by Country 2025 & 2033
- Figure 50: Middle East and Africa Small Hydropower Market Volume Share (%), by Country 2025 & 2033
- Figure 51: South America Small Hydropower Market Revenue (billion), by Capacity 2025 & 2033
- Figure 52: South America Small Hydropower Market Volume (gigawatt), by Capacity 2025 & 2033
- Figure 53: South America Small Hydropower Market Revenue Share (%), by Capacity 2025 & 2033
- Figure 54: South America Small Hydropower Market Volume Share (%), by Capacity 2025 & 2033
- Figure 55: South America Small Hydropower Market Revenue (billion), by Application 2025 & 2033
- Figure 56: South America Small Hydropower Market Volume (gigawatt), by Application 2025 & 2033
- Figure 57: South America Small Hydropower Market Revenue Share (%), by Application 2025 & 2033
- Figure 58: South America Small Hydropower Market Volume Share (%), by Application 2025 & 2033
- Figure 59: South America Small Hydropower Market Revenue (billion), by Country 2025 & 2033
- Figure 60: South America Small Hydropower Market Volume (gigawatt), by Country 2025 & 2033
- Figure 61: South America Small Hydropower Market Revenue Share (%), by Country 2025 & 2033
- Figure 62: South America Small Hydropower Market Volume Share (%), by Country 2025 & 2033
List of Tables
- Table 1: Global Small Hydropower Market Revenue billion Forecast, by Capacity 2020 & 2033
- Table 2: Global Small Hydropower Market Volume gigawatt Forecast, by Capacity 2020 & 2033
- Table 3: Global Small Hydropower Market Revenue billion Forecast, by Application 2020 & 2033
- Table 4: Global Small Hydropower Market Volume gigawatt Forecast, by Application 2020 & 2033
- Table 5: Global Small Hydropower Market Revenue billion Forecast, by Region 2020 & 2033
- Table 6: Global Small Hydropower Market Volume gigawatt Forecast, by Region 2020 & 2033
- Table 7: Global Small Hydropower Market Revenue billion Forecast, by Capacity 2020 & 2033
- Table 8: Global Small Hydropower Market Volume gigawatt Forecast, by Capacity 2020 & 2033
- Table 9: Global Small Hydropower Market Revenue billion Forecast, by Application 2020 & 2033
- Table 10: Global Small Hydropower Market Volume gigawatt Forecast, by Application 2020 & 2033
- Table 11: Global Small Hydropower Market Revenue billion Forecast, by Country 2020 & 2033
- Table 12: Global Small Hydropower Market Volume gigawatt Forecast, by Country 2020 & 2033
- Table 13: United States Small Hydropower Market Revenue (billion) Forecast, by Application 2020 & 2033
- Table 14: United States Small Hydropower Market Volume (gigawatt) Forecast, by Application 2020 & 2033
- Table 15: Canada Small Hydropower Market Revenue (billion) Forecast, by Application 2020 & 2033
- Table 16: Canada Small Hydropower Market Volume (gigawatt) Forecast, by Application 2020 & 2033
- Table 17: Rest of North America Small Hydropower Market Revenue (billion) Forecast, by Application 2020 & 2033
- Table 18: Rest of North America Small Hydropower Market Volume (gigawatt) Forecast, by Application 2020 & 2033
- Table 19: Global Small Hydropower Market Revenue billion Forecast, by Capacity 2020 & 2033
- Table 20: Global Small Hydropower Market Volume gigawatt Forecast, by Capacity 2020 & 2033
- Table 21: Global Small Hydropower Market Revenue billion Forecast, by Application 2020 & 2033
- Table 22: Global Small Hydropower Market Volume gigawatt Forecast, by Application 2020 & 2033
- Table 23: Global Small Hydropower Market Revenue billion Forecast, by Country 2020 & 2033
- Table 24: Global Small Hydropower Market Volume gigawatt Forecast, by Country 2020 & 2033
- Table 25: Germany Small Hydropower Market Revenue (billion) Forecast, by Application 2020 & 2033
- Table 26: Germany Small Hydropower Market Volume (gigawatt) Forecast, by Application 2020 & 2033
- Table 27: United Kingdom Small Hydropower Market Revenue (billion) Forecast, by Application 2020 & 2033
- Table 28: United Kingdom Small Hydropower Market Volume (gigawatt) Forecast, by Application 2020 & 2033
- Table 29: France Small Hydropower Market Revenue (billion) Forecast, by Application 2020 & 2033
- Table 30: France Small Hydropower Market Volume (gigawatt) Forecast, by Application 2020 & 2033
- Table 31: Italy Small Hydropower Market Revenue (billion) Forecast, by Application 2020 & 2033
- Table 32: Italy Small Hydropower Market Volume (gigawatt) Forecast, by Application 2020 & 2033
- Table 33: Spain Small Hydropower Market Revenue (billion) Forecast, by Application 2020 & 2033
- Table 34: Spain Small Hydropower Market Volume (gigawatt) Forecast, by Application 2020 & 2033
- Table 35: Nordic Small Hydropower Market Revenue (billion) Forecast, by Application 2020 & 2033
- Table 36: Nordic Small Hydropower Market Volume (gigawatt) Forecast, by Application 2020 & 2033
- Table 37: Turkey Small Hydropower Market Revenue (billion) Forecast, by Application 2020 & 2033
- Table 38: Turkey Small Hydropower Market Volume (gigawatt) Forecast, by Application 2020 & 2033
- Table 39: Russia Small Hydropower Market Revenue (billion) Forecast, by Application 2020 & 2033
- Table 40: Russia Small Hydropower Market Volume (gigawatt) Forecast, by Application 2020 & 2033
- Table 41: Rest of Europe Small Hydropower Market Revenue (billion) Forecast, by Application 2020 & 2033
- Table 42: Rest of Europe Small Hydropower Market Volume (gigawatt) Forecast, by Application 2020 & 2033
- Table 43: Global Small Hydropower Market Revenue billion Forecast, by Capacity 2020 & 2033
- Table 44: Global Small Hydropower Market Volume gigawatt Forecast, by Capacity 2020 & 2033
- Table 45: Global Small Hydropower Market Revenue billion Forecast, by Application 2020 & 2033
- Table 46: Global Small Hydropower Market Volume gigawatt Forecast, by Application 2020 & 2033
- Table 47: Global Small Hydropower Market Revenue billion Forecast, by Country 2020 & 2033
- Table 48: Global Small Hydropower Market Volume gigawatt Forecast, by Country 2020 & 2033
- Table 49: China Small Hydropower Market Revenue (billion) Forecast, by Application 2020 & 2033
- Table 50: China Small Hydropower Market Volume (gigawatt) Forecast, by Application 2020 & 2033
- Table 51: India Small Hydropower Market Revenue (billion) Forecast, by Application 2020 & 2033
- Table 52: India Small Hydropower Market Volume (gigawatt) Forecast, by Application 2020 & 2033
- Table 53: Japan Small Hydropower Market Revenue (billion) Forecast, by Application 2020 & 2033
- Table 54: Japan Small Hydropower Market Volume (gigawatt) Forecast, by Application 2020 & 2033
- Table 55: South Korea Small Hydropower Market Revenue (billion) Forecast, by Application 2020 & 2033
- Table 56: South Korea Small Hydropower Market Volume (gigawatt) Forecast, by Application 2020 & 2033
- Table 57: Malaysia Small Hydropower Market Revenue (billion) Forecast, by Application 2020 & 2033
- Table 58: Malaysia Small Hydropower Market Volume (gigawatt) Forecast, by Application 2020 & 2033
- Table 59: Thailand Small Hydropower Market Revenue (billion) Forecast, by Application 2020 & 2033
- Table 60: Thailand Small Hydropower Market Volume (gigawatt) Forecast, by Application 2020 & 2033
- Table 61: Vietnam Small Hydropower Market Revenue (billion) Forecast, by Application 2020 & 2033
- Table 62: Vietnam Small Hydropower Market Volume (gigawatt) Forecast, by Application 2020 & 2033
- Table 63: Rest of Asia Pacific Small Hydropower Market Revenue (billion) Forecast, by Application 2020 & 2033
- Table 64: Rest of Asia Pacific Small Hydropower Market Volume (gigawatt) Forecast, by Application 2020 & 2033
- Table 65: Global Small Hydropower Market Revenue billion Forecast, by Capacity 2020 & 2033
- Table 66: Global Small Hydropower Market Volume gigawatt Forecast, by Capacity 2020 & 2033
- Table 67: Global Small Hydropower Market Revenue billion Forecast, by Application 2020 & 2033
- Table 68: Global Small Hydropower Market Volume gigawatt Forecast, by Application 2020 & 2033
- Table 69: Global Small Hydropower Market Revenue billion Forecast, by Country 2020 & 2033
- Table 70: Global Small Hydropower Market Volume gigawatt Forecast, by Country 2020 & 2033
- Table 71: Saudi Arabia Small Hydropower Market Revenue (billion) Forecast, by Application 2020 & 2033
- Table 72: Saudi Arabia Small Hydropower Market Volume (gigawatt) Forecast, by Application 2020 & 2033
- Table 73: United Arab Emirates Small Hydropower Market Revenue (billion) Forecast, by Application 2020 & 2033
- Table 74: United Arab Emirates Small Hydropower Market Volume (gigawatt) Forecast, by Application 2020 & 2033
- Table 75: Nigeria Small Hydropower Market Revenue (billion) Forecast, by Application 2020 & 2033
- Table 76: Nigeria Small Hydropower Market Volume (gigawatt) Forecast, by Application 2020 & 2033
- Table 77: Egypt Small Hydropower Market Revenue (billion) Forecast, by Application 2020 & 2033
- Table 78: Egypt Small Hydropower Market Volume (gigawatt) Forecast, by Application 2020 & 2033
- Table 79: South Africa Small Hydropower Market Revenue (billion) Forecast, by Application 2020 & 2033
- Table 80: South Africa Small Hydropower Market Volume (gigawatt) Forecast, by Application 2020 & 2033
- Table 81: Rest of Middle East and Africa Small Hydropower Market Revenue (billion) Forecast, by Application 2020 & 2033
- Table 82: Rest of Middle East and Africa Small Hydropower Market Volume (gigawatt) Forecast, by Application 2020 & 2033
- Table 83: Global Small Hydropower Market Revenue billion Forecast, by Capacity 2020 & 2033
- Table 84: Global Small Hydropower Market Volume gigawatt Forecast, by Capacity 2020 & 2033
- Table 85: Global Small Hydropower Market Revenue billion Forecast, by Application 2020 & 2033
- Table 86: Global Small Hydropower Market Volume gigawatt Forecast, by Application 2020 & 2033
- Table 87: Global Small Hydropower Market Revenue billion Forecast, by Country 2020 & 2033
- Table 88: Global Small Hydropower Market Volume gigawatt Forecast, by Country 2020 & 2033
- Table 89: Brazil Small Hydropower Market Revenue (billion) Forecast, by Application 2020 & 2033
- Table 90: Brazil Small Hydropower Market Volume (gigawatt) Forecast, by Application 2020 & 2033
- Table 91: Argentina Small Hydropower Market Revenue (billion) Forecast, by Application 2020 & 2033
- Table 92: Argentina Small Hydropower Market Volume (gigawatt) Forecast, by Application 2020 & 2033
- Table 93: Colombia Small Hydropower Market Revenue (billion) Forecast, by Application 2020 & 2033
- Table 94: Colombia Small Hydropower Market Volume (gigawatt) Forecast, by Application 2020 & 2033
- Table 95: Rest of South America Small Hydropower Market Revenue (billion) Forecast, by Application 2020 & 2033
- Table 96: Rest of South America Small Hydropower Market Volume (gigawatt) Forecast, by Application 2020 & 2033
Frequently Asked Questions
1. What is the projected Compound Annual Growth Rate (CAGR) of the Small Hydropower Market?
The projected CAGR is approximately 2.8%.
2. Which companies are prominent players in the Small Hydropower Market?
Key companies in the market include Gilbert Gilkes & Gordon Ltd, Toshiba Energy Systems & Solutions Corporation, Kolektor Group*List Not Exhaustive, Voith GmbH & Co KGaA, PJSC RusHydro, Siemens Energy AG, Natel Energy Inc, GE Renewable Energy, Andritz AG, FLOVEL Energy Private Limited.
3. What are the main segments of the Small Hydropower Market?
The market segments include Capacity, Application.
4. Can you provide details about the market size?
The market size is estimated to be USD 2.18 billion as of 2022.
5. What are some drivers contributing to market growth?
4.; Growing Emphasis on Renewable Energy Integration4.; Significant Hydropower Potential.
6. What are the notable trends driving market growth?
The 1-10 MW Segment Expected to Dominate the Market.
7. Are there any restraints impacting market growth?
4.; Competition From Other Energy Storage Technologies.
8. Can you provide examples of recent developments in the market?
July 2022: SMEC was hired by KPower Engineering Sdn Bhd (KPEng), together with Tellhow International Engineering & Contracting Co Ltd, to review the design and propose modifications required for three small hydropower plants in East Malaysia. The three hydropower projects at Sungai Bengkoka Upper, Sungai Bengkoka Lower, and Sungai Togohu in Kota Marudu, Sabah, had a planned capacity totaling 29.1 MW. The consortium had taken over from the previous contractor to complete the engineering, design, procurement, construction, and commissioning works, and ORP, a subsidiary of OHP Ventures Sdn Bhd, owns the project.
9. What pricing options are available for accessing the report?
Pricing options include single-user, multi-user, and enterprise licenses priced at USD 4750, USD 5250, and USD 8750 respectively.
10. Is the market size provided in terms of value or volume?
The market size is provided in terms of value, measured in billion and volume, measured in gigawatt.
11. Are there any specific market keywords associated with the report?
Yes, the market keyword associated with the report is "Small Hydropower Market," which aids in identifying and referencing the specific market segment covered.
12. How do I determine which pricing option suits my needs best?
The pricing options vary based on user requirements and access needs. Individual users may opt for single-user licenses, while businesses requiring broader access may choose multi-user or enterprise licenses for cost-effective access to the report.
13. Are there any additional resources or data provided in the Small Hydropower Market report?
While the report offers comprehensive insights, it's advisable to review the specific contents or supplementary materials provided to ascertain if additional resources or data are available.
14. How can I stay updated on further developments or reports in the Small Hydropower Market?
To stay informed about further developments, trends, and reports in the Small Hydropower Market, consider subscribing to industry newsletters, following relevant companies and organizations, or regularly checking reputable industry news sources and publications.
Methodology
Step 1 - Identification of Relevant Samples Size from Population Database


Step 2 - Approaches for Defining Global Market Size (Value, Volume* & Price*)

Note*: In applicable scenarios
Step 3 - Data Sources
Primary Research
- Web Analytics
- Survey Reports
- Research Institute
- Latest Research Reports
- Opinion Leaders
Secondary Research
- Annual Reports
- White Paper
- Latest Press Release
- Industry Association
- Paid Database
- Investor Presentations

Step 4 - Data Triangulation
Involves using different sources of information in order to increase the validity of a study
These sources are likely to be stakeholders in a program - participants, other researchers, program staff, other community members, and so on.
Then we put all data in single framework & apply various statistical tools to find out the dynamic on the market.
During the analysis stage, feedback from the stakeholder groups would be compared to determine areas of agreement as well as areas of divergence