

Key Insights
The global security labels market, valued at $24.93 billion in 2025, is projected to experience robust growth, driven by increasing demand for product authentication and anti-counterfeiting measures across diverse industries. The market's Compound Annual Growth Rate (CAGR) of 5.19% from 2019 to 2024 indicates a steady expansion trajectory, expected to continue through 2033. Key drivers include the rising prevalence of e-commerce and the need for secure supply chains, prompting businesses to adopt sophisticated security labeling solutions to combat counterfeiting and protect their brand reputation. Furthermore, advancements in printing technologies, such as digital printing, are enabling the creation of highly customized and tamper-evident labels, further fueling market growth. While the market faces potential restraints from fluctuating raw material prices and economic downturns, the escalating demand for security features in various sectors, including pharmaceuticals, electronics, and food & beverage, is anticipated to offset these challenges. The market is segmented by raw material (metal, plastic/polymer), mechanism (pressure sensitive, shrink sleeve), product type (warning/security, branding, weatherproof), printing technology (analog, digital), and end-user industry (electronics, food & beverage, automotive, healthcare). The diverse application areas and technological advancements ensure the continued expansion and diversification of the security labels market.
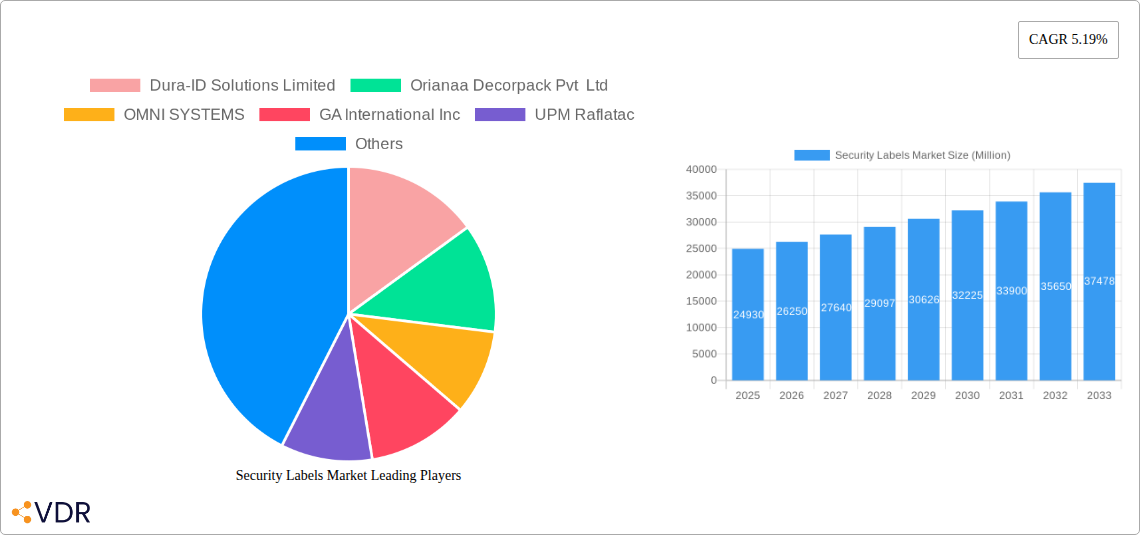
Security Labels Market Market Size (In Billion)
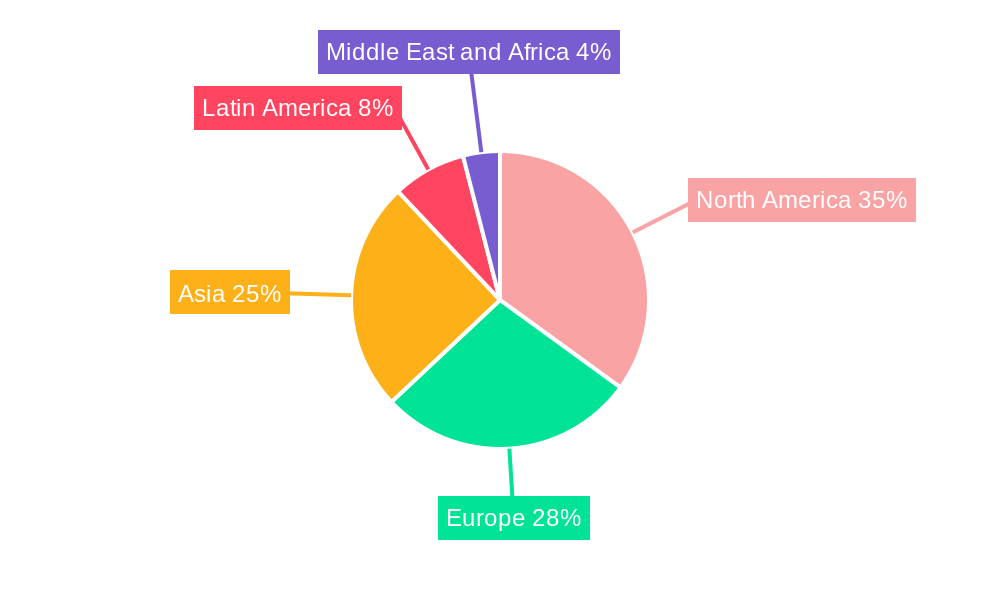
The significant growth is particularly evident in regions with expanding manufacturing and e-commerce sectors, such as Asia-Pacific and North America. North America, with its established industrial base and stringent regulatory environment demanding product traceability and security, currently holds a substantial market share. However, Asia-Pacific is projected to witness the fastest growth rate due to rapid industrialization, increasing consumer awareness, and a growing demand for counterfeit-resistant products. The competitive landscape is characterized by both large multinational corporations and specialized label manufacturers, each offering a wide range of security label solutions tailored to specific industry needs. Strategic partnerships, mergers and acquisitions, and continuous innovation in label materials and technologies are key strategies employed by market players to enhance their market position and capitalize on the growing demand for secure labeling solutions.
Security Labels Market Company Market Share
Security Labels Market Report: 2019-2033
This comprehensive report provides an in-depth analysis of the global Security Labels Market, encompassing market dynamics, growth trends, regional dominance, product landscape, key players, and future outlook. The study period covers 2019-2033, with 2025 as the base year and a forecast period of 2025-2033. The report segments the market by raw material (Metal Labels, Plastic/Polymer Labels), mechanism (Pressure Sensitive Labelling, Shrink Sleeve Labelling, Other Mechanism), product type (Warning/Security Labels, Branding Labels, Weatherproof Labels, Equipment Asset Tags, Other Product Types), printing technology (Analog Printing, Digital Printing), and end-user industry (Electronics Industry, Food & Beverage, Automotive, Healthcare, Other End-user Industry). The market size is presented in million units.
Security Labels Market Market Dynamics & Structure
The Security Labels Market is characterized by moderate concentration, with key players like 3M Company, Avery Dennison Corporation, and CCL Industries Inc. holding significant market share (xx%). Technological innovation, particularly in RFID and digital printing, is a primary growth driver. Stringent regulatory frameworks concerning product authenticity and traceability across various industries (e.g., pharmaceuticals, electronics) are further boosting demand. Competitive substitutes include traditional tamper-evident seals and other security mechanisms, but the advantages of security labels in terms of cost-effectiveness and ease of application maintain their market dominance. The end-user demographics are diverse, spanning various industries with varying levels of adoption. The market has witnessed significant M&A activity in recent years, with xx major deals recorded between 2019 and 2024.
- Market Concentration: Moderately concentrated, with top 5 players holding xx% market share.
- Technological Innovation: RFID integration, digital printing advancements drive growth.
- Regulatory Framework: Stringent regulations in various industries mandate security labeling.
- Competitive Substitutes: Traditional security mechanisms face competition from versatile labels.
- End-User Demographics: Diverse industries driving varied adoption rates.
- M&A Trends: Significant increase in mergers and acquisitions (xx deals between 2019-2024).
- Innovation Barriers: High R&D costs and complex integration with existing systems.
Security Labels Market Growth Trends & Insights
The global Security Labels Market exhibited a CAGR of xx% during the historical period (2019-2024) and is projected to grow at a CAGR of xx% during the forecast period (2025-2033), reaching a market size of xx million units by 2033. This growth is fueled by increasing counterfeiting concerns, rising demand for product authentication, and the adoption of advanced labeling technologies in various sectors. The market penetration rate is currently at xx%, with significant potential for further growth in developing economies. Technological disruptions, such as the integration of smart labels and blockchain technology for enhanced security features, are accelerating market expansion. Consumer preference shifts towards greater product transparency and traceability are driving market demand.
Dominant Regions, Countries, or Segments in Security Labels Market
North America currently holds the largest market share (xx%) in the Security Labels Market, driven by stringent regulatory compliance and high adoption rates in industries such as pharmaceuticals and electronics. Europe follows closely, with a market share of xx%. Within the segments, Plastic/Polymer Labels dominate by raw material (xx% market share), owing to their versatility and cost-effectiveness. Pressure Sensitive Labelling is the leading mechanism (xx% market share), while Warning/Security Labels constitute the largest product type segment (xx%). The Electronics Industry exhibits the highest demand among end-user industries (xx% market share), followed by the Food & Beverage sector.
- North America: Largest market share due to stringent regulations and high adoption.
- Europe: Strong market presence with significant growth potential.
- Plastic/Polymer Labels: Dominates raw material segment due to versatility and cost.
- Pressure Sensitive Labelling: Leading mechanism due to ease of application.
- Warning/Security Labels: Highest demand among product types due to safety and security concerns.
- Electronics Industry: Largest end-user segment due to high-value products and counterfeiting risks.
Security Labels Market Product Landscape
The Security Labels Market is witnessing continuous innovation in materials, printing technologies, and functionalities. Products now incorporate features like RFID tags for real-time tracking, tamper-evident holograms for authentication, and variable data printing for enhanced security. Unique selling propositions include enhanced durability, improved readability, and integration with advanced tracking systems. Technological advancements focus on improved security features, ease of application, and cost reduction.
Key Drivers, Barriers & Challenges in Security Labels Market
Key Drivers: Increasing counterfeit product concerns, stringent government regulations, rising demand for product authentication, and technological advancements in labeling solutions.
Challenges: Supply chain disruptions impacting raw material availability and lead times. Strict regulatory compliance requirements impose high costs and complexity. Intense competition among established players and new entrants creates pricing pressure.
Emerging Opportunities in Security Labels Market
Emerging opportunities lie in the untapped markets of developing economies, particularly in Asia and Africa. The growth of e-commerce and increased demand for secure product delivery are creating new avenues for security label applications. Innovative applications such as smart packaging, integration with IoT devices, and the adoption of sustainable and eco-friendly materials are driving market expansion.
Growth Accelerators in the Security Labels Market Industry
Technological breakthroughs, particularly in RFID technology and digital printing, are significant growth drivers. Strategic partnerships between label manufacturers and technology providers are facilitating the development of innovative solutions. Market expansion strategies focusing on emerging economies and new industry applications will accelerate future growth.
Key Players Shaping the Security Labels Market Market
- Dura-ID Solutions Limited
- Orianaa Decorpack Pvt Ltd
- OMNI SYSTEMS
- GA International Inc
- UPM Raflatac
- DuPont de Nemours Inc
- Brook + Whittle Ltd
- 3M Company
- CCL Industries Inc
- Avery Dennison Corporation
- Asean Pack
- Computer Imprintable Label Systems Ltd (CISL Ltd)
- LabelTac com
- Brady Corporation
Notable Milestones in Security Labels Market Sector
- April 2024: ProMach acquires Etiflex, expanding its pressure-sensitive and RFID label capabilities.
- November 2023: All4Labels launches INTEGRITAG, a dedicated security and intelligent label solutions entity.
- April 2023: CCL Industries acquires eAgile Inc. and Alert Systems ApS, strengthening its intelligent label technology portfolio.
In-Depth Security Labels Market Market Outlook
The Security Labels Market is poised for robust growth in the coming years, driven by increasing demand for product authentication and traceability across various industries. Strategic partnerships, technological innovation, and market expansion into new geographies will be critical to unlocking the market’s full potential. The adoption of advanced technologies like RFID, blockchain, and smart packaging will further propel market expansion, creating opportunities for both established players and new entrants.
Security Labels Market Segmentation
-
1. Raw Material
- 1.1. Metal Labels
- 1.2. Plastic/Polymer Labels
-
2. Mechanism
- 2.1. Pressure Sensitive Labelling
- 2.2. Shrink Sleeve Labelling
- 2.3. Other Mechanism
-
3. Product Type
- 3.1. Warning/Security Labels
- 3.2. Branding Labels
- 3.3. Weatherproof Labels
- 3.4. Equipment Asset Tags
- 3.5. Other Product Types
-
4. Printing Technology
- 4.1. Analog Printing
- 4.2. Digital Printing
-
5. End-user Industry
- 5.1. Electronics Industry
- 5.2. Food & Beverage
- 5.3. Automotive
- 5.4. Healthcare
- 5.5. Other End-user Industry
Security Labels Market Segmentation By Geography
-
1. North America
- 1.1. United States
- 1.2. Canada
-
2. Europe
- 2.1. Germany
- 2.2. United Kingdom
- 2.3. France
- 2.4. Spain
-
3. Asia
- 3.1. China
- 3.2. Japan
- 3.3. India
- 3.4. South Korea
- 4. Australia and New Zealand
-
5. Latin America
- 5.1. Brazil
- 5.2. Mexico
- 5.3. Argentina
-
6. Middle East and Africa
- 6.1. United Arab Emirates
- 6.2. Saudi Arabia
- 6.3. South Africa
Security Labels Market Regional Market Share
Geographic Coverage of Security Labels Market
Security Labels Market REPORT HIGHLIGHTS
| Aspects | Details |
|---|---|
| Study Period | 2020-2034 |
| Base Year | 2025 |
| Estimated Year | 2026 |
| Forecast Period | 2026-2034 |
| Historical Period | 2020-2025 |
| Growth Rate | CAGR of 5.19% from 2020-2034 |
| Segmentation |
|
Table of Contents
- 1. Introduction
- 1.1. Research Scope
- 1.2. Market Segmentation
- 1.3. Research Objective
- 1.4. Definitions and Assumptions
- 2. Executive Summary
- 2.1. Market Snapshot
- 3. Market Dynamics
- 3.1. Market Drivers
- 3.2. Market Restrains
- 3.3. Market Trends
- 3.4. Market Opportunities
- 4. Market Factor Analysis
- 4.1. Porters Five Forces
- 4.1.1. Bargaining Power of Suppliers
- 4.1.2. Bargaining Power of Buyers
- 4.1.3. Threat of New Entrants
- 4.1.4. Threat of Substitutes
- 4.1.5. Competitive Rivalry
- 4.2. PESTEL analysis
- 4.3. BCG Analysis
- 4.3.1. Stars (High Growth, High Market Share)
- 4.3.2. Cash Cows (Low Growth, High Market Share)
- 4.3.3. Question Mark (High Growth, Low Market Share)
- 4.3.4. Dogs (Low Growth, Low Market Share)
- 4.4. Ansoff Matrix Analysis
- 4.5. Supply Chain Analysis
- 4.6. Regulatory Landscape
- 4.7. Current Market Potential and Opportunity Assessment (TAM–SAM–SOM Framework)
- 4.8. VDR Analyst Note
- 4.1. Porters Five Forces
- 5. Market Analysis, Insights and Forecast 2021-2033
- 5.1. Market Analysis, Insights and Forecast - by Raw Material
- 5.1.1. Metal Labels
- 5.1.2. Plastic/Polymer Labels
- 5.2. Market Analysis, Insights and Forecast - by Mechanism
- 5.2.1. Pressure Sensitive Labelling
- 5.2.2. Shrink Sleeve Labelling
- 5.2.3. Other Mechanism
- 5.3. Market Analysis, Insights and Forecast - by Product Type
- 5.3.1. Warning/Security Labels
- 5.3.2. Branding Labels
- 5.3.3. Weatherproof Labels
- 5.3.4. Equipment Asset Tags
- 5.3.5. Other Product Types
- 5.4. Market Analysis, Insights and Forecast - by Printing Technology
- 5.4.1. Analog Printing
- 5.4.2. Digital Printing
- 5.5. Market Analysis, Insights and Forecast - by End-user Industry
- 5.5.1. Electronics Industry
- 5.5.2. Food & Beverage
- 5.5.3. Automotive
- 5.5.4. Healthcare
- 5.5.5. Other End-user Industry
- 5.6. Market Analysis, Insights and Forecast - by Region
- 5.6.1. North America
- 5.6.2. Europe
- 5.6.3. Asia
- 5.6.4. Australia and New Zealand
- 5.6.5. Latin America
- 5.6.6. Middle East and Africa
- 5.1. Market Analysis, Insights and Forecast - by Raw Material
- 6. Global Security Labels Market Analysis, Insights and Forecast, 2021-2033
- 6.1. Market Analysis, Insights and Forecast - by Raw Material
- 6.1.1. Metal Labels
- 6.1.2. Plastic/Polymer Labels
- 6.2. Market Analysis, Insights and Forecast - by Mechanism
- 6.2.1. Pressure Sensitive Labelling
- 6.2.2. Shrink Sleeve Labelling
- 6.2.3. Other Mechanism
- 6.3. Market Analysis, Insights and Forecast - by Product Type
- 6.3.1. Warning/Security Labels
- 6.3.2. Branding Labels
- 6.3.3. Weatherproof Labels
- 6.3.4. Equipment Asset Tags
- 6.3.5. Other Product Types
- 6.4. Market Analysis, Insights and Forecast - by Printing Technology
- 6.4.1. Analog Printing
- 6.4.2. Digital Printing
- 6.5. Market Analysis, Insights and Forecast - by End-user Industry
- 6.5.1. Electronics Industry
- 6.5.2. Food & Beverage
- 6.5.3. Automotive
- 6.5.4. Healthcare
- 6.5.5. Other End-user Industry
- 6.1. Market Analysis, Insights and Forecast - by Raw Material
- 7. North America Security Labels Market Analysis, Insights and Forecast, 2021-2033
- 7.1. Market Analysis, Insights and Forecast - by Raw Material
- 7.1.1. Metal Labels
- 7.1.2. Plastic/Polymer Labels
- 7.2. Market Analysis, Insights and Forecast - by Mechanism
- 7.2.1. Pressure Sensitive Labelling
- 7.2.2. Shrink Sleeve Labelling
- 7.2.3. Other Mechanism
- 7.3. Market Analysis, Insights and Forecast - by Product Type
- 7.3.1. Warning/Security Labels
- 7.3.2. Branding Labels
- 7.3.3. Weatherproof Labels
- 7.3.4. Equipment Asset Tags
- 7.3.5. Other Product Types
- 7.4. Market Analysis, Insights and Forecast - by Printing Technology
- 7.4.1. Analog Printing
- 7.4.2. Digital Printing
- 7.5. Market Analysis, Insights and Forecast - by End-user Industry
- 7.5.1. Electronics Industry
- 7.5.2. Food & Beverage
- 7.5.3. Automotive
- 7.5.4. Healthcare
- 7.5.5. Other End-user Industry
- 7.1. Market Analysis, Insights and Forecast - by Raw Material
- 8. Europe Security Labels Market Analysis, Insights and Forecast, 2021-2033
- 8.1. Market Analysis, Insights and Forecast - by Raw Material
- 8.1.1. Metal Labels
- 8.1.2. Plastic/Polymer Labels
- 8.2. Market Analysis, Insights and Forecast - by Mechanism
- 8.2.1. Pressure Sensitive Labelling
- 8.2.2. Shrink Sleeve Labelling
- 8.2.3. Other Mechanism
- 8.3. Market Analysis, Insights and Forecast - by Product Type
- 8.3.1. Warning/Security Labels
- 8.3.2. Branding Labels
- 8.3.3. Weatherproof Labels
- 8.3.4. Equipment Asset Tags
- 8.3.5. Other Product Types
- 8.4. Market Analysis, Insights and Forecast - by Printing Technology
- 8.4.1. Analog Printing
- 8.4.2. Digital Printing
- 8.5. Market Analysis, Insights and Forecast - by End-user Industry
- 8.5.1. Electronics Industry
- 8.5.2. Food & Beverage
- 8.5.3. Automotive
- 8.5.4. Healthcare
- 8.5.5. Other End-user Industry
- 8.1. Market Analysis, Insights and Forecast - by Raw Material
- 9. Asia Security Labels Market Analysis, Insights and Forecast, 2021-2033
- 9.1. Market Analysis, Insights and Forecast - by Raw Material
- 9.1.1. Metal Labels
- 9.1.2. Plastic/Polymer Labels
- 9.2. Market Analysis, Insights and Forecast - by Mechanism
- 9.2.1. Pressure Sensitive Labelling
- 9.2.2. Shrink Sleeve Labelling
- 9.2.3. Other Mechanism
- 9.3. Market Analysis, Insights and Forecast - by Product Type
- 9.3.1. Warning/Security Labels
- 9.3.2. Branding Labels
- 9.3.3. Weatherproof Labels
- 9.3.4. Equipment Asset Tags
- 9.3.5. Other Product Types
- 9.4. Market Analysis, Insights and Forecast - by Printing Technology
- 9.4.1. Analog Printing
- 9.4.2. Digital Printing
- 9.5. Market Analysis, Insights and Forecast - by End-user Industry
- 9.5.1. Electronics Industry
- 9.5.2. Food & Beverage
- 9.5.3. Automotive
- 9.5.4. Healthcare
- 9.5.5. Other End-user Industry
- 9.1. Market Analysis, Insights and Forecast - by Raw Material
- 10. Australia and New Zealand Security Labels Market Analysis, Insights and Forecast, 2021-2033
- 10.1. Market Analysis, Insights and Forecast - by Raw Material
- 10.1.1. Metal Labels
- 10.1.2. Plastic/Polymer Labels
- 10.2. Market Analysis, Insights and Forecast - by Mechanism
- 10.2.1. Pressure Sensitive Labelling
- 10.2.2. Shrink Sleeve Labelling
- 10.2.3. Other Mechanism
- 10.3. Market Analysis, Insights and Forecast - by Product Type
- 10.3.1. Warning/Security Labels
- 10.3.2. Branding Labels
- 10.3.3. Weatherproof Labels
- 10.3.4. Equipment Asset Tags
- 10.3.5. Other Product Types
- 10.4. Market Analysis, Insights and Forecast - by Printing Technology
- 10.4.1. Analog Printing
- 10.4.2. Digital Printing
- 10.5. Market Analysis, Insights and Forecast - by End-user Industry
- 10.5.1. Electronics Industry
- 10.5.2. Food & Beverage
- 10.5.3. Automotive
- 10.5.4. Healthcare
- 10.5.5. Other End-user Industry
- 10.1. Market Analysis, Insights and Forecast - by Raw Material
- 11. Latin America Security Labels Market Analysis, Insights and Forecast, 2021-2033
- 11.1. Market Analysis, Insights and Forecast - by Raw Material
- 11.1.1. Metal Labels
- 11.1.2. Plastic/Polymer Labels
- 11.2. Market Analysis, Insights and Forecast - by Mechanism
- 11.2.1. Pressure Sensitive Labelling
- 11.2.2. Shrink Sleeve Labelling
- 11.2.3. Other Mechanism
- 11.3. Market Analysis, Insights and Forecast - by Product Type
- 11.3.1. Warning/Security Labels
- 11.3.2. Branding Labels
- 11.3.3. Weatherproof Labels
- 11.3.4. Equipment Asset Tags
- 11.3.5. Other Product Types
- 11.4. Market Analysis, Insights and Forecast - by Printing Technology
- 11.4.1. Analog Printing
- 11.4.2. Digital Printing
- 11.5. Market Analysis, Insights and Forecast - by End-user Industry
- 11.5.1. Electronics Industry
- 11.5.2. Food & Beverage
- 11.5.3. Automotive
- 11.5.4. Healthcare
- 11.5.5. Other End-user Industry
- 11.1. Market Analysis, Insights and Forecast - by Raw Material
- 12. Middle East and Africa Security Labels Market Analysis, Insights and Forecast, 2021-2033
- 12.1. Market Analysis, Insights and Forecast - by Raw Material
- 12.1.1. Metal Labels
- 12.1.2. Plastic/Polymer Labels
- 12.2. Market Analysis, Insights and Forecast - by Mechanism
- 12.2.1. Pressure Sensitive Labelling
- 12.2.2. Shrink Sleeve Labelling
- 12.2.3. Other Mechanism
- 12.3. Market Analysis, Insights and Forecast - by Product Type
- 12.3.1. Warning/Security Labels
- 12.3.2. Branding Labels
- 12.3.3. Weatherproof Labels
- 12.3.4. Equipment Asset Tags
- 12.3.5. Other Product Types
- 12.4. Market Analysis, Insights and Forecast - by Printing Technology
- 12.4.1. Analog Printing
- 12.4.2. Digital Printing
- 12.5. Market Analysis, Insights and Forecast - by End-user Industry
- 12.5.1. Electronics Industry
- 12.5.2. Food & Beverage
- 12.5.3. Automotive
- 12.5.4. Healthcare
- 12.5.5. Other End-user Industry
- 12.1. Market Analysis, Insights and Forecast - by Raw Material
- 13. Competitive Analysis
- 13.1. Company Profiles
- 13.1.1 Dura-ID Solutions Limited
- 13.1.1.1. Company Overview
- 13.1.1.2. Products
- 13.1.1.3. Company Financials
- 13.1.1.4. SWOT Analysis
- 13.1.2 Orianaa Decorpack Pvt Ltd
- 13.1.2.1. Company Overview
- 13.1.2.2. Products
- 13.1.2.3. Company Financials
- 13.1.2.4. SWOT Analysis
- 13.1.3 OMNI SYSTEMS
- 13.1.3.1. Company Overview
- 13.1.3.2. Products
- 13.1.3.3. Company Financials
- 13.1.3.4. SWOT Analysis
- 13.1.4 GA International Inc
- 13.1.4.1. Company Overview
- 13.1.4.2. Products
- 13.1.4.3. Company Financials
- 13.1.4.4. SWOT Analysis
- 13.1.5 UPM Raflatac
- 13.1.5.1. Company Overview
- 13.1.5.2. Products
- 13.1.5.3. Company Financials
- 13.1.5.4. SWOT Analysis
- 13.1.6 DuPont de Nemours Inc
- 13.1.6.1. Company Overview
- 13.1.6.2. Products
- 13.1.6.3. Company Financials
- 13.1.6.4. SWOT Analysis
- 13.1.7 Brook + Whittle Ltd
- 13.1.7.1. Company Overview
- 13.1.7.2. Products
- 13.1.7.3. Company Financials
- 13.1.7.4. SWOT Analysis
- 13.1.8 3M Company
- 13.1.8.1. Company Overview
- 13.1.8.2. Products
- 13.1.8.3. Company Financials
- 13.1.8.4. SWOT Analysis
- 13.1.9 CCL Industries Inc
- 13.1.9.1. Company Overview
- 13.1.9.2. Products
- 13.1.9.3. Company Financials
- 13.1.9.4. SWOT Analysis
- 13.1.10 Avery Dennison Corporation
- 13.1.10.1. Company Overview
- 13.1.10.2. Products
- 13.1.10.3. Company Financials
- 13.1.10.4. SWOT Analysis
- 13.1.11 Asean Pack
- 13.1.11.1. Company Overview
- 13.1.11.2. Products
- 13.1.11.3. Company Financials
- 13.1.11.4. SWOT Analysis
- 13.1.12 Computer Imprintable Label Systems Ltd (CISL Ltd)
- 13.1.12.1. Company Overview
- 13.1.12.2. Products
- 13.1.12.3. Company Financials
- 13.1.12.4. SWOT Analysis
- 13.1.13 LabelTac com
- 13.1.13.1. Company Overview
- 13.1.13.2. Products
- 13.1.13.3. Company Financials
- 13.1.13.4. SWOT Analysis
- 13.1.14 Brady Corporation
- 13.1.14.1. Company Overview
- 13.1.14.2. Products
- 13.1.14.3. Company Financials
- 13.1.14.4. SWOT Analysis
- 13.1.1 Dura-ID Solutions Limited
- 13.2. Market Entropy
- 13.2.1 Company's Key Areas Served
- 13.2.2 Recent Developments
- 13.3. Company Market Share Analysis 2025
- 13.3.1 Top 5 Companies Market Share Analysis
- 13.3.2 Top 3 Companies Market Share Analysis
- 13.4. List of Potential Customers
- 14. Research Methodology
List of Figures
- Figure 1: Global Security Labels Market Revenue Breakdown (Million, %) by Region 2025 & 2033
- Figure 2: North America Security Labels Market Revenue (Million), by Raw Material 2025 & 2033
- Figure 3: North America Security Labels Market Revenue Share (%), by Raw Material 2025 & 2033
- Figure 4: North America Security Labels Market Revenue (Million), by Mechanism 2025 & 2033
- Figure 5: North America Security Labels Market Revenue Share (%), by Mechanism 2025 & 2033
- Figure 6: North America Security Labels Market Revenue (Million), by Product Type 2025 & 2033
- Figure 7: North America Security Labels Market Revenue Share (%), by Product Type 2025 & 2033
- Figure 8: North America Security Labels Market Revenue (Million), by Printing Technology 2025 & 2033
- Figure 9: North America Security Labels Market Revenue Share (%), by Printing Technology 2025 & 2033
- Figure 10: North America Security Labels Market Revenue (Million), by End-user Industry 2025 & 2033
- Figure 11: North America Security Labels Market Revenue Share (%), by End-user Industry 2025 & 2033
- Figure 12: North America Security Labels Market Revenue (Million), by Country 2025 & 2033
- Figure 13: North America Security Labels Market Revenue Share (%), by Country 2025 & 2033
- Figure 14: Europe Security Labels Market Revenue (Million), by Raw Material 2025 & 2033
- Figure 15: Europe Security Labels Market Revenue Share (%), by Raw Material 2025 & 2033
- Figure 16: Europe Security Labels Market Revenue (Million), by Mechanism 2025 & 2033
- Figure 17: Europe Security Labels Market Revenue Share (%), by Mechanism 2025 & 2033
- Figure 18: Europe Security Labels Market Revenue (Million), by Product Type 2025 & 2033
- Figure 19: Europe Security Labels Market Revenue Share (%), by Product Type 2025 & 2033
- Figure 20: Europe Security Labels Market Revenue (Million), by Printing Technology 2025 & 2033
- Figure 21: Europe Security Labels Market Revenue Share (%), by Printing Technology 2025 & 2033
- Figure 22: Europe Security Labels Market Revenue (Million), by End-user Industry 2025 & 2033
- Figure 23: Europe Security Labels Market Revenue Share (%), by End-user Industry 2025 & 2033
- Figure 24: Europe Security Labels Market Revenue (Million), by Country 2025 & 2033
- Figure 25: Europe Security Labels Market Revenue Share (%), by Country 2025 & 2033
- Figure 26: Asia Security Labels Market Revenue (Million), by Raw Material 2025 & 2033
- Figure 27: Asia Security Labels Market Revenue Share (%), by Raw Material 2025 & 2033
- Figure 28: Asia Security Labels Market Revenue (Million), by Mechanism 2025 & 2033
- Figure 29: Asia Security Labels Market Revenue Share (%), by Mechanism 2025 & 2033
- Figure 30: Asia Security Labels Market Revenue (Million), by Product Type 2025 & 2033
- Figure 31: Asia Security Labels Market Revenue Share (%), by Product Type 2025 & 2033
- Figure 32: Asia Security Labels Market Revenue (Million), by Printing Technology 2025 & 2033
- Figure 33: Asia Security Labels Market Revenue Share (%), by Printing Technology 2025 & 2033
- Figure 34: Asia Security Labels Market Revenue (Million), by End-user Industry 2025 & 2033
- Figure 35: Asia Security Labels Market Revenue Share (%), by End-user Industry 2025 & 2033
- Figure 36: Asia Security Labels Market Revenue (Million), by Country 2025 & 2033
- Figure 37: Asia Security Labels Market Revenue Share (%), by Country 2025 & 2033
- Figure 38: Australia and New Zealand Security Labels Market Revenue (Million), by Raw Material 2025 & 2033
- Figure 39: Australia and New Zealand Security Labels Market Revenue Share (%), by Raw Material 2025 & 2033
- Figure 40: Australia and New Zealand Security Labels Market Revenue (Million), by Mechanism 2025 & 2033
- Figure 41: Australia and New Zealand Security Labels Market Revenue Share (%), by Mechanism 2025 & 2033
- Figure 42: Australia and New Zealand Security Labels Market Revenue (Million), by Product Type 2025 & 2033
- Figure 43: Australia and New Zealand Security Labels Market Revenue Share (%), by Product Type 2025 & 2033
- Figure 44: Australia and New Zealand Security Labels Market Revenue (Million), by Printing Technology 2025 & 2033
- Figure 45: Australia and New Zealand Security Labels Market Revenue Share (%), by Printing Technology 2025 & 2033
- Figure 46: Australia and New Zealand Security Labels Market Revenue (Million), by End-user Industry 2025 & 2033
- Figure 47: Australia and New Zealand Security Labels Market Revenue Share (%), by End-user Industry 2025 & 2033
- Figure 48: Australia and New Zealand Security Labels Market Revenue (Million), by Country 2025 & 2033
- Figure 49: Australia and New Zealand Security Labels Market Revenue Share (%), by Country 2025 & 2033
- Figure 50: Latin America Security Labels Market Revenue (Million), by Raw Material 2025 & 2033
- Figure 51: Latin America Security Labels Market Revenue Share (%), by Raw Material 2025 & 2033
- Figure 52: Latin America Security Labels Market Revenue (Million), by Mechanism 2025 & 2033
- Figure 53: Latin America Security Labels Market Revenue Share (%), by Mechanism 2025 & 2033
- Figure 54: Latin America Security Labels Market Revenue (Million), by Product Type 2025 & 2033
- Figure 55: Latin America Security Labels Market Revenue Share (%), by Product Type 2025 & 2033
- Figure 56: Latin America Security Labels Market Revenue (Million), by Printing Technology 2025 & 2033
- Figure 57: Latin America Security Labels Market Revenue Share (%), by Printing Technology 2025 & 2033
- Figure 58: Latin America Security Labels Market Revenue (Million), by End-user Industry 2025 & 2033
- Figure 59: Latin America Security Labels Market Revenue Share (%), by End-user Industry 2025 & 2033
- Figure 60: Latin America Security Labels Market Revenue (Million), by Country 2025 & 2033
- Figure 61: Latin America Security Labels Market Revenue Share (%), by Country 2025 & 2033
- Figure 62: Middle East and Africa Security Labels Market Revenue (Million), by Raw Material 2025 & 2033
- Figure 63: Middle East and Africa Security Labels Market Revenue Share (%), by Raw Material 2025 & 2033
- Figure 64: Middle East and Africa Security Labels Market Revenue (Million), by Mechanism 2025 & 2033
- Figure 65: Middle East and Africa Security Labels Market Revenue Share (%), by Mechanism 2025 & 2033
- Figure 66: Middle East and Africa Security Labels Market Revenue (Million), by Product Type 2025 & 2033
- Figure 67: Middle East and Africa Security Labels Market Revenue Share (%), by Product Type 2025 & 2033
- Figure 68: Middle East and Africa Security Labels Market Revenue (Million), by Printing Technology 2025 & 2033
- Figure 69: Middle East and Africa Security Labels Market Revenue Share (%), by Printing Technology 2025 & 2033
- Figure 70: Middle East and Africa Security Labels Market Revenue (Million), by End-user Industry 2025 & 2033
- Figure 71: Middle East and Africa Security Labels Market Revenue Share (%), by End-user Industry 2025 & 2033
- Figure 72: Middle East and Africa Security Labels Market Revenue (Million), by Country 2025 & 2033
- Figure 73: Middle East and Africa Security Labels Market Revenue Share (%), by Country 2025 & 2033
List of Tables
- Table 1: Global Security Labels Market Revenue Million Forecast, by Raw Material 2020 & 2033
- Table 2: Global Security Labels Market Revenue Million Forecast, by Mechanism 2020 & 2033
- Table 3: Global Security Labels Market Revenue Million Forecast, by Product Type 2020 & 2033
- Table 4: Global Security Labels Market Revenue Million Forecast, by Printing Technology 2020 & 2033
- Table 5: Global Security Labels Market Revenue Million Forecast, by End-user Industry 2020 & 2033
- Table 6: Global Security Labels Market Revenue Million Forecast, by Region 2020 & 2033
- Table 7: Global Security Labels Market Revenue Million Forecast, by Raw Material 2020 & 2033
- Table 8: Global Security Labels Market Revenue Million Forecast, by Mechanism 2020 & 2033
- Table 9: Global Security Labels Market Revenue Million Forecast, by Product Type 2020 & 2033
- Table 10: Global Security Labels Market Revenue Million Forecast, by Printing Technology 2020 & 2033
- Table 11: Global Security Labels Market Revenue Million Forecast, by End-user Industry 2020 & 2033
- Table 12: Global Security Labels Market Revenue Million Forecast, by Country 2020 & 2033
- Table 13: United States Security Labels Market Revenue (Million) Forecast, by Application 2020 & 2033
- Table 14: Canada Security Labels Market Revenue (Million) Forecast, by Application 2020 & 2033
- Table 15: Global Security Labels Market Revenue Million Forecast, by Raw Material 2020 & 2033
- Table 16: Global Security Labels Market Revenue Million Forecast, by Mechanism 2020 & 2033
- Table 17: Global Security Labels Market Revenue Million Forecast, by Product Type 2020 & 2033
- Table 18: Global Security Labels Market Revenue Million Forecast, by Printing Technology 2020 & 2033
- Table 19: Global Security Labels Market Revenue Million Forecast, by End-user Industry 2020 & 2033
- Table 20: Global Security Labels Market Revenue Million Forecast, by Country 2020 & 2033
- Table 21: Germany Security Labels Market Revenue (Million) Forecast, by Application 2020 & 2033
- Table 22: United Kingdom Security Labels Market Revenue (Million) Forecast, by Application 2020 & 2033
- Table 23: France Security Labels Market Revenue (Million) Forecast, by Application 2020 & 2033
- Table 24: Spain Security Labels Market Revenue (Million) Forecast, by Application 2020 & 2033
- Table 25: Global Security Labels Market Revenue Million Forecast, by Raw Material 2020 & 2033
- Table 26: Global Security Labels Market Revenue Million Forecast, by Mechanism 2020 & 2033
- Table 27: Global Security Labels Market Revenue Million Forecast, by Product Type 2020 & 2033
- Table 28: Global Security Labels Market Revenue Million Forecast, by Printing Technology 2020 & 2033
- Table 29: Global Security Labels Market Revenue Million Forecast, by End-user Industry 2020 & 2033
- Table 30: Global Security Labels Market Revenue Million Forecast, by Country 2020 & 2033
- Table 31: China Security Labels Market Revenue (Million) Forecast, by Application 2020 & 2033
- Table 32: Japan Security Labels Market Revenue (Million) Forecast, by Application 2020 & 2033
- Table 33: India Security Labels Market Revenue (Million) Forecast, by Application 2020 & 2033
- Table 34: South Korea Security Labels Market Revenue (Million) Forecast, by Application 2020 & 2033
- Table 35: Global Security Labels Market Revenue Million Forecast, by Raw Material 2020 & 2033
- Table 36: Global Security Labels Market Revenue Million Forecast, by Mechanism 2020 & 2033
- Table 37: Global Security Labels Market Revenue Million Forecast, by Product Type 2020 & 2033
- Table 38: Global Security Labels Market Revenue Million Forecast, by Printing Technology 2020 & 2033
- Table 39: Global Security Labels Market Revenue Million Forecast, by End-user Industry 2020 & 2033
- Table 40: Global Security Labels Market Revenue Million Forecast, by Country 2020 & 2033
- Table 41: Global Security Labels Market Revenue Million Forecast, by Raw Material 2020 & 2033
- Table 42: Global Security Labels Market Revenue Million Forecast, by Mechanism 2020 & 2033
- Table 43: Global Security Labels Market Revenue Million Forecast, by Product Type 2020 & 2033
- Table 44: Global Security Labels Market Revenue Million Forecast, by Printing Technology 2020 & 2033
- Table 45: Global Security Labels Market Revenue Million Forecast, by End-user Industry 2020 & 2033
- Table 46: Global Security Labels Market Revenue Million Forecast, by Country 2020 & 2033
- Table 47: Brazil Security Labels Market Revenue (Million) Forecast, by Application 2020 & 2033
- Table 48: Mexico Security Labels Market Revenue (Million) Forecast, by Application 2020 & 2033
- Table 49: Argentina Security Labels Market Revenue (Million) Forecast, by Application 2020 & 2033
- Table 50: Global Security Labels Market Revenue Million Forecast, by Raw Material 2020 & 2033
- Table 51: Global Security Labels Market Revenue Million Forecast, by Mechanism 2020 & 2033
- Table 52: Global Security Labels Market Revenue Million Forecast, by Product Type 2020 & 2033
- Table 53: Global Security Labels Market Revenue Million Forecast, by Printing Technology 2020 & 2033
- Table 54: Global Security Labels Market Revenue Million Forecast, by End-user Industry 2020 & 2033
- Table 55: Global Security Labels Market Revenue Million Forecast, by Country 2020 & 2033
- Table 56: United Arab Emirates Security Labels Market Revenue (Million) Forecast, by Application 2020 & 2033
- Table 57: Saudi Arabia Security Labels Market Revenue (Million) Forecast, by Application 2020 & 2033
- Table 58: South Africa Security Labels Market Revenue (Million) Forecast, by Application 2020 & 2033
Frequently Asked Questions
1. What is the projected Compound Annual Growth Rate (CAGR) of the Security Labels Market?
The projected CAGR is approximately 5.19%.
2. Which companies are prominent players in the Security Labels Market?
Key companies in the market include Dura-ID Solutions Limited, Orianaa Decorpack Pvt Ltd, OMNI SYSTEMS, GA International Inc, UPM Raflatac, DuPont de Nemours Inc, Brook + Whittle Ltd, 3M Company, CCL Industries Inc, Avery Dennison Corporation, Asean Pack, Computer Imprintable Label Systems Ltd (CISL Ltd), LabelTac com, Brady Corporation.
3. What are the main segments of the Security Labels Market?
The market segments include Raw Material, Mechanism, Product Type, Printing Technology, End-user Industry.
4. Can you provide details about the market size?
The market size is estimated to be USD 24.93 Million as of 2022.
5. What are some drivers contributing to market growth?
Food and Beverage is Expected to Register Significant Growth; APAC to Witness Significant Growth.
6. What are the notable trends driving market growth?
Warning/Security Labels is Expected to Register a Significant Growth.
7. Are there any restraints impacting market growth?
Increasing Cost of Raw Materials.
8. Can you provide examples of recent developments in the market?
April 2024: ProMach, a prominent global player in the manufacturing and distribution of processing and packaging equipment, announced the acquisition of Etiflex, a well-known producer of pressure-sensitive and RFID labels. This acquisition enhances ProMach's labeling and coding expertise across North America and marks the company's initial foray into the Mexican market.
9. What pricing options are available for accessing the report?
Pricing options include single-user, multi-user, and enterprise licenses priced at USD 4750, USD 5250, and USD 8750 respectively.
10. Is the market size provided in terms of value or volume?
The market size is provided in terms of value, measured in Million.
11. Are there any specific market keywords associated with the report?
Yes, the market keyword associated with the report is "Security Labels Market," which aids in identifying and referencing the specific market segment covered.
12. How do I determine which pricing option suits my needs best?
The pricing options vary based on user requirements and access needs. Individual users may opt for single-user licenses, while businesses requiring broader access may choose multi-user or enterprise licenses for cost-effective access to the report.
13. Are there any additional resources or data provided in the Security Labels Market report?
While the report offers comprehensive insights, it's advisable to review the specific contents or supplementary materials provided to ascertain if additional resources or data are available.
14. How can I stay updated on further developments or reports in the Security Labels Market?
To stay informed about further developments, trends, and reports in the Security Labels Market, consider subscribing to industry newsletters, following relevant companies and organizations, or regularly checking reputable industry news sources and publications.
Methodology
Step 1 - Identification of Relevant Samples Size from Population Database


Step 2 - Approaches for Defining Global Market Size (Value, Volume* & Price*)

Note*: In applicable scenarios
Step 3 - Data Sources
Primary Research
- Web Analytics
- Survey Reports
- Research Institute
- Latest Research Reports
- Opinion Leaders
Secondary Research
- Annual Reports
- White Paper
- Latest Press Release
- Industry Association
- Paid Database
- Investor Presentations

Step 4 - Data Triangulation
Involves using different sources of information in order to increase the validity of a study
These sources are likely to be stakeholders in a program - participants, other researchers, program staff, other community members, and so on.
Then we put all data in single framework & apply various statistical tools to find out the dynamic on the market.
During the analysis stage, feedback from the stakeholder groups would be compared to determine areas of agreement as well as areas of divergence