

Key Insights
The Scandinavian commercial property market, comprising Denmark, Norway, and Sweden, demonstrates a compelling investment proposition. The market is projected to expand at a Compound Annual Growth Rate (CAGR) of 3.75%, reaching a size of 234.9 million by the base year 2025. Key growth drivers include robust economic performance in technology and renewable energy sectors, fueling demand for office and industrial spaces. Urbanization and population increases in major cities like Oslo, Stockholm, and Copenhagen are boosting property values and rental yields. A growing emphasis on sustainable development and green building practices presents opportunities in renovations and new constructions. While interest rate fluctuations and economic slowdowns are considerations, the market outlook remains positive, supported by a resilient economy and consistent domestic and international investment. The market is diversified by property type (offices, retail, industrial, logistics, multi-family, hospitality) and geography, offering varied investment avenues.
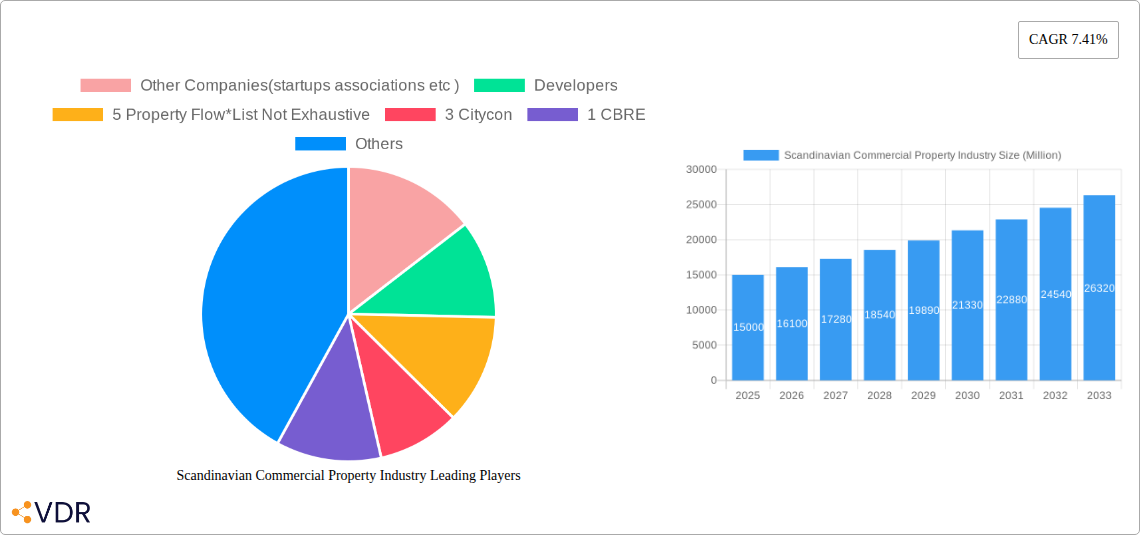
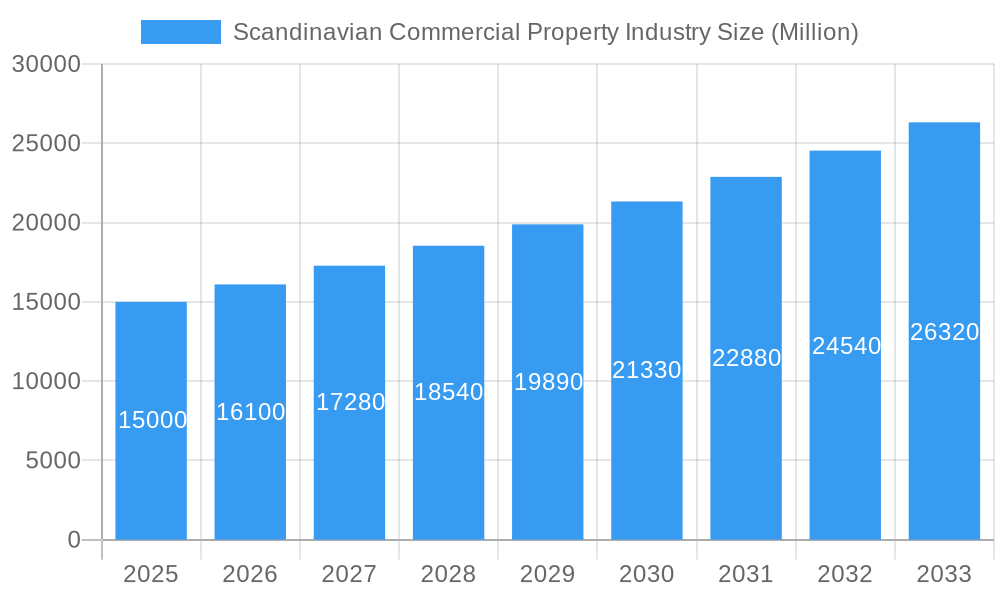
Scandinavian Commercial Property Industry Market Size (In Million)
Prominent international firms such as CBRE and Cushman & Wakefield, alongside established local players like Jeudan A/S and Vasakronan AB, highlight the significant global interest and maturity of the Scandinavian commercial real estate sector. The presence of emerging startups and smaller developers indicates a dynamic and innovative industry landscape, ensuring a spectrum of investment opportunities and strategic approaches that contribute to sustained growth and evolution.
Scandinavian Commercial Property Industry Company Market Share
Scandinavian Commercial Property Industry: Market Analysis & Forecast (2019-2033)
This comprehensive report provides a detailed analysis of the Scandinavian commercial property market, encompassing Denmark, Norway, and Sweden, with a focus on key cities like Oslo, Stockholm, and Copenhagen. The study period spans from 2019 to 2033, with 2025 serving as the base and estimated year. The report utilizes a robust methodology, incorporating historical data (2019-2024), current market conditions (2025), and a forecast for the period 2025-2033. This in-depth analysis is crucial for investors, developers, real estate agencies, and industry professionals seeking to navigate the dynamic landscape of the Scandinavian commercial property market.
Scandinavian Commercial Property Industry Market Dynamics & Structure
This section analyzes the market concentration, technological innovation, regulatory frameworks, competitive landscape, and M&A trends within the Scandinavian commercial property industry. We delve into the interplay of various factors influencing market dynamics, providing both quantitative and qualitative insights.
Market Concentration & Competition: The Scandinavian commercial property market exhibits a moderately concentrated structure, with several large players alongside numerous smaller firms and startups. Market share is largely split between national and international players, with local knowledge often proving a key competitive advantage. The level of competition varies across property types and geographical locations.
- Market Share (2025 Estimate): Top 5 players hold approximately xx% of the total market.
- M&A Activity (2019-2024): xx billion in total deal value, with a noticeable increase in activity in the latter half of the period.
- Innovation Barriers: High regulatory hurdles, limited access to capital for smaller firms, and slow adoption of new technologies present some barriers.
Regulatory Framework & Technological Innovation: Stringent environmental regulations and sustainable building standards are shaping the market. Technological innovations, such as PropTech solutions and smart building technologies, are gradually gaining traction, although adoption rates remain relatively low compared to other regions.
Scandinavian Commercial Property Industry Growth Trends & Insights
This section provides a comprehensive analysis of market size evolution, adoption rates, technological disruptions, and consumer behavior shifts within the Scandinavian commercial property sector. Utilizing both qualitative and quantitative data, including Compound Annual Growth Rates (CAGR) and market penetration rates, this section reveals significant market insights. The analysis covers all major segments – offices, retail, industrial, logistics, multi-family, and hospitality – across Denmark, Norway, and Sweden.
- Market Size (2025): xx Billion
- CAGR (2025-2033): xx%
- Market Penetration (key technologies): xx% for smart building technologies, xx% for PropTech solutions by 2033.
- Consumer Behavior: A shift towards sustainable and flexible workspaces is observed, particularly within the office segment, leading to increased demand for green buildings and co-working spaces.
The market experienced significant growth during the historical period (2019-2024), particularly driven by strong economic performance and low-interest rates. However, external factors such as global economic uncertainty and rising interest rates have introduced some challenges.
Dominant Regions, Countries, or Segments in Scandinavian Commercial Property Industry
This section identifies the leading regions, countries, and property segments driving market growth. The analysis focuses on market share, growth potential, and key driving forces within each sector.
Dominant Segment: The Industrial and Logistics sector shows the highest growth potential, fueled by e-commerce expansion and increasing demand for warehousing space.
- Key Drivers (Industrial/Logistics): E-commerce boom, optimized supply chains, and government investment in infrastructure.
- Dominant Country: Sweden presents the largest market size, driven by strong economic fundamentals and a robust technological ecosystem.
- Dominant City: Copenhagen’s strong economic activity and strategic location make it a key market.
Other key segments: Office space demand is influenced by evolving work models, retail is challenged by e-commerce, and multi-family housing faces shortages in major cities, creating a compelling investment opportunity.
Scandinavian Commercial Property Industry Product Landscape
The Scandinavian commercial property market is characterized by a focus on sustainable and energy-efficient buildings, incorporating smart building technologies and advanced materials. Innovation is driving the development of flexible and adaptable spaces to cater to evolving business needs. A trend towards incorporating wellness features and enhancing tenant experiences is also noticeable.
Key Drivers, Barriers & Challenges in Scandinavian Commercial Property Industry
Key Drivers: Strong economic fundamentals in Scandinavia, government support for sustainable development, and increasing demand for modern, flexible workspaces are key growth drivers. The expanding e-commerce sector further boosts demand for logistics and warehousing space.
Challenges & Restraints: Rising interest rates, supply chain disruptions, and skilled labor shortages pose significant challenges. Strict environmental regulations and permitting processes can delay project timelines and increase costs. Competition from established players and new entrants creates additional pressure on margins. Estimated impact of these challenges on market growth is a reduction of xx% by 2033.
Emerging Opportunities in Scandinavian Commercial Property Industry
The development of green buildings, co-working spaces, and flexible office solutions presents significant opportunities. The growing interest in sustainable investments attracts both domestic and foreign capital. Demand for logistics and warehousing space, driven by e-commerce growth, offers further investment potential. The increasing focus on urban regeneration and revitalization projects also presents numerous opportunities for developers.
Growth Accelerators in the Scandinavian Commercial Property Industry Industry
Technological advancements in building management systems and PropTech solutions are expected to significantly increase efficiency and reduce operating costs. Strategic partnerships between developers, technology companies, and investors are key to driving innovation and accelerating market growth. Expanding into new markets and focusing on underserved segments will also drive long-term growth.
Key Players Shaping the Scandinavian Commercial Property Industry Market
- Other Companies (startups, associations, etc.)
- Developers:
- Property Flow (5)
- 3 Citycon
- 1 CBRE (CBRE)
- 5 BPT Group
- 2 Jeudan A/S (Jeudan A/S)
- 1 Vasakronan AB (Vasakronan AB)
- 4 Cushman and Wakefield (Cushman & Wakefield)
- Real Estate Agencies:
- 3 Colliers International (Colliers International)
- 2 Europages
- 4 NREP (Logicenters) (NREP)
- 2 Nordkap
- 3 Spotscale
- 4 WEC360
- 1 Stronghold
Notable Milestones in Scandinavian Commercial Property Industry Sector
- 2020: Increased focus on sustainable building practices and green certifications.
- 2021: Launch of several PropTech platforms aimed at improving property management efficiency.
- 2022: Significant M&A activity, leading to consolidation within the market.
- 2023: Government initiatives promoting the development of affordable housing.
- 2024: Growing adoption of smart building technologies.
In-Depth Scandinavian Commercial Property Industry Market Outlook
The Scandinavian commercial property market is poised for continued growth, driven by strong economic fundamentals, increased investment in sustainable development, and the ongoing adoption of new technologies. The focus on flexible and adaptable spaces, coupled with the increasing demand for logistics and warehousing, creates significant opportunities for investors and developers. Strategic partnerships and innovative solutions will be key to navigating the evolving market landscape and capturing significant market share in the years to come. The forecast predicts a robust market expansion, with several sub-sectors experiencing particularly strong growth.
Scandinavian Commercial Property Industry Segmentation
-
1. Type
- 1.1. Offices
- 1.2. Retail
- 1.3. Industrial
- 1.4. Logistics
- 1.5. Multi-family
- 1.6. Hospitality
-
2. Countries
- 2.1. Denmark
- 2.2. Norway
- 2.3. Sweden
-
3. Key Cities
- 3.1. Oslo
- 3.2. Stockholm
- 3.3. Copenhagen
Scandinavian Commercial Property Industry Segmentation By Geography
-
1. North America
- 1.1. United States
- 1.2. Canada
- 1.3. Mexico
-
2. South America
- 2.1. Brazil
- 2.2. Argentina
- 2.3. Rest of South America
-
3. Europe
- 3.1. United Kingdom
- 3.2. Germany
- 3.3. France
- 3.4. Italy
- 3.5. Spain
- 3.6. Russia
- 3.7. Benelux
- 3.8. Nordics
- 3.9. Rest of Europe
-
4. Middle East & Africa
- 4.1. Turkey
- 4.2. Israel
- 4.3. GCC
- 4.4. North Africa
- 4.5. South Africa
- 4.6. Rest of Middle East & Africa
-
5. Asia Pacific
- 5.1. China
- 5.2. India
- 5.3. Japan
- 5.4. South Korea
- 5.5. ASEAN
- 5.6. Oceania
- 5.7. Rest of Asia Pacific
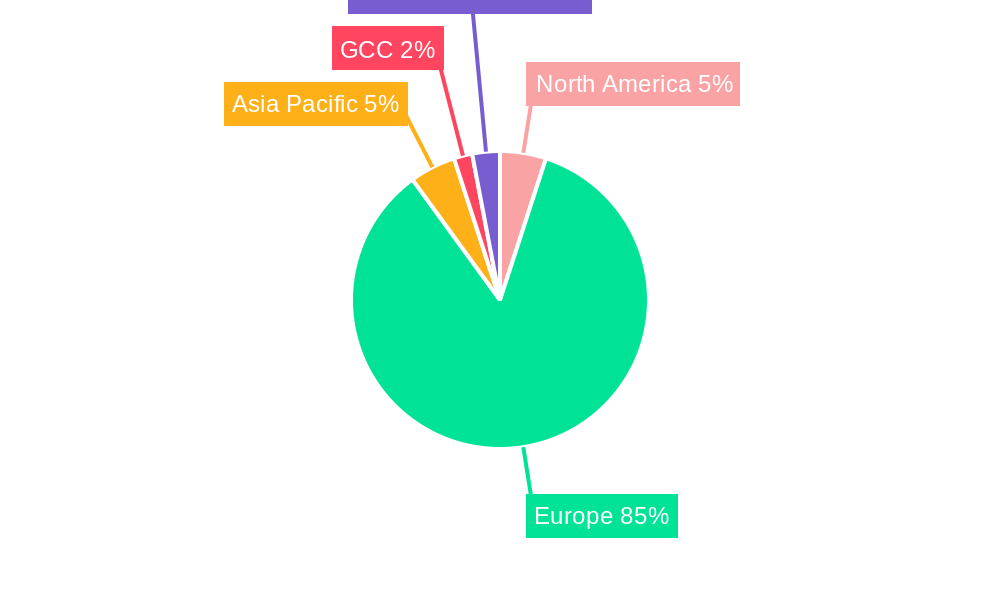
Scandinavian Commercial Property Industry Regional Market Share
Geographic Coverage of Scandinavian Commercial Property Industry
Scandinavian Commercial Property Industry REPORT HIGHLIGHTS
| Aspects | Details |
|---|---|
| Study Period | 2020-2034 |
| Base Year | 2025 |
| Estimated Year | 2026 |
| Forecast Period | 2026-2034 |
| Historical Period | 2020-2025 |
| Growth Rate | CAGR of 3.75% from 2020-2034 |
| Segmentation |
|
Table of Contents
- 1. Introduction
- 1.1. Research Scope
- 1.2. Market Segmentation
- 1.3. Research Objective
- 1.4. Definitions and Assumptions
- 2. Executive Summary
- 2.1. Market Snapshot
- 3. Market Dynamics
- 3.1. Market Drivers
- 3.2. Market Restrains
- 3.3. Market Trends
- 3.4. Market Opportunities
- 4. Market Factor Analysis
- 4.1. Porters Five Forces
- 4.1.1. Bargaining Power of Suppliers
- 4.1.2. Bargaining Power of Buyers
- 4.1.3. Threat of New Entrants
- 4.1.4. Threat of Substitutes
- 4.1.5. Competitive Rivalry
- 4.2. PESTEL analysis
- 4.3. BCG Analysis
- 4.3.1. Stars (High Growth, High Market Share)
- 4.3.2. Cash Cows (Low Growth, High Market Share)
- 4.3.3. Question Mark (High Growth, Low Market Share)
- 4.3.4. Dogs (Low Growth, Low Market Share)
- 4.4. Ansoff Matrix Analysis
- 4.5. Supply Chain Analysis
- 4.6. Regulatory Landscape
- 4.7. Current Market Potential and Opportunity Assessment (TAM–SAM–SOM Framework)
- 4.8. VDR Analyst Note
- 4.1. Porters Five Forces
- 5. Market Analysis, Insights and Forecast 2021-2033
- 5.1. Market Analysis, Insights and Forecast - by Type
- 5.1.1. Offices
- 5.1.2. Retail
- 5.1.3. Industrial
- 5.1.4. Logistics
- 5.1.5. Multi-family
- 5.1.6. Hospitality
- 5.2. Market Analysis, Insights and Forecast - by Countries
- 5.2.1. Denmark
- 5.2.2. Norway
- 5.2.3. Sweden
- 5.3. Market Analysis, Insights and Forecast - by Key Cities
- 5.3.1. Oslo
- 5.3.2. Stockholm
- 5.3.3. Copenhagen
- 5.4. Market Analysis, Insights and Forecast - by Region
- 5.4.1. North America
- 5.4.2. South America
- 5.4.3. Europe
- 5.4.4. Middle East & Africa
- 5.4.5. Asia Pacific
- 5.1. Market Analysis, Insights and Forecast - by Type
- 6. Global Scandinavian Commercial Property Industry Analysis, Insights and Forecast, 2021-2033
- 6.1. Market Analysis, Insights and Forecast - by Type
- 6.1.1. Offices
- 6.1.2. Retail
- 6.1.3. Industrial
- 6.1.4. Logistics
- 6.1.5. Multi-family
- 6.1.6. Hospitality
- 6.2. Market Analysis, Insights and Forecast - by Countries
- 6.2.1. Denmark
- 6.2.2. Norway
- 6.2.3. Sweden
- 6.3. Market Analysis, Insights and Forecast - by Key Cities
- 6.3.1. Oslo
- 6.3.2. Stockholm
- 6.3.3. Copenhagen
- 6.1. Market Analysis, Insights and Forecast - by Type
- 7. North America Scandinavian Commercial Property Industry Analysis, Insights and Forecast, 2021-2033
- 7.1. Market Analysis, Insights and Forecast - by Type
- 7.1.1. Offices
- 7.1.2. Retail
- 7.1.3. Industrial
- 7.1.4. Logistics
- 7.1.5. Multi-family
- 7.1.6. Hospitality
- 7.2. Market Analysis, Insights and Forecast - by Countries
- 7.2.1. Denmark
- 7.2.2. Norway
- 7.2.3. Sweden
- 7.3. Market Analysis, Insights and Forecast - by Key Cities
- 7.3.1. Oslo
- 7.3.2. Stockholm
- 7.3.3. Copenhagen
- 7.1. Market Analysis, Insights and Forecast - by Type
- 8. South America Scandinavian Commercial Property Industry Analysis, Insights and Forecast, 2021-2033
- 8.1. Market Analysis, Insights and Forecast - by Type
- 8.1.1. Offices
- 8.1.2. Retail
- 8.1.3. Industrial
- 8.1.4. Logistics
- 8.1.5. Multi-family
- 8.1.6. Hospitality
- 8.2. Market Analysis, Insights and Forecast - by Countries
- 8.2.1. Denmark
- 8.2.2. Norway
- 8.2.3. Sweden
- 8.3. Market Analysis, Insights and Forecast - by Key Cities
- 8.3.1. Oslo
- 8.3.2. Stockholm
- 8.3.3. Copenhagen
- 8.1. Market Analysis, Insights and Forecast - by Type
- 9. Europe Scandinavian Commercial Property Industry Analysis, Insights and Forecast, 2021-2033
- 9.1. Market Analysis, Insights and Forecast - by Type
- 9.1.1. Offices
- 9.1.2. Retail
- 9.1.3. Industrial
- 9.1.4. Logistics
- 9.1.5. Multi-family
- 9.1.6. Hospitality
- 9.2. Market Analysis, Insights and Forecast - by Countries
- 9.2.1. Denmark
- 9.2.2. Norway
- 9.2.3. Sweden
- 9.3. Market Analysis, Insights and Forecast - by Key Cities
- 9.3.1. Oslo
- 9.3.2. Stockholm
- 9.3.3. Copenhagen
- 9.1. Market Analysis, Insights and Forecast - by Type
- 10. Middle East & Africa Scandinavian Commercial Property Industry Analysis, Insights and Forecast, 2021-2033
- 10.1. Market Analysis, Insights and Forecast - by Type
- 10.1.1. Offices
- 10.1.2. Retail
- 10.1.3. Industrial
- 10.1.4. Logistics
- 10.1.5. Multi-family
- 10.1.6. Hospitality
- 10.2. Market Analysis, Insights and Forecast - by Countries
- 10.2.1. Denmark
- 10.2.2. Norway
- 10.2.3. Sweden
- 10.3. Market Analysis, Insights and Forecast - by Key Cities
- 10.3.1. Oslo
- 10.3.2. Stockholm
- 10.3.3. Copenhagen
- 10.1. Market Analysis, Insights and Forecast - by Type
- 11. Asia Pacific Scandinavian Commercial Property Industry Analysis, Insights and Forecast, 2021-2033
- 11.1. Market Analysis, Insights and Forecast - by Type
- 11.1.1. Offices
- 11.1.2. Retail
- 11.1.3. Industrial
- 11.1.4. Logistics
- 11.1.5. Multi-family
- 11.1.6. Hospitality
- 11.2. Market Analysis, Insights and Forecast - by Countries
- 11.2.1. Denmark
- 11.2.2. Norway
- 11.2.3. Sweden
- 11.3. Market Analysis, Insights and Forecast - by Key Cities
- 11.3.1. Oslo
- 11.3.2. Stockholm
- 11.3.3. Copenhagen
- 11.1. Market Analysis, Insights and Forecast - by Type
- 12. Competitive Analysis
- 12.1. Company Profiles
- 12.1.1 Other Companies(startups associations etc )
- 12.1.1.1. Company Overview
- 12.1.1.2. Products
- 12.1.1.3. Company Financials
- 12.1.1.4. SWOT Analysis
- 12.1.2 Developers
- 12.1.2.1. Company Overview
- 12.1.2.2. Products
- 12.1.2.3. Company Financials
- 12.1.2.4. SWOT Analysis
- 12.1.3 5 Property Flow*List Not Exhaustive
- 12.1.3.1. Company Overview
- 12.1.3.2. Products
- 12.1.3.3. Company Financials
- 12.1.3.4. SWOT Analysis
- 12.1.4 3 Citycon
- 12.1.4.1. Company Overview
- 12.1.4.2. Products
- 12.1.4.3. Company Financials
- 12.1.4.4. SWOT Analysis
- 12.1.5 1 CBRE
- 12.1.5.1. Company Overview
- 12.1.5.2. Products
- 12.1.5.3. Company Financials
- 12.1.5.4. SWOT Analysis
- 12.1.6 5 BPT Group
- 12.1.6.1. Company Overview
- 12.1.6.2. Products
- 12.1.6.3. Company Financials
- 12.1.6.4. SWOT Analysis
- 12.1.7 2 Jeudan A/S
- 12.1.7.1. Company Overview
- 12.1.7.2. Products
- 12.1.7.3. Company Financials
- 12.1.7.4. SWOT Analysis
- 12.1.8 1 Vasakronan AB
- 12.1.8.1. Company Overview
- 12.1.8.2. Products
- 12.1.8.3. Company Financials
- 12.1.8.4. SWOT Analysis
- 12.1.9 4 Cushman and wakefield
- 12.1.9.1. Company Overview
- 12.1.9.2. Products
- 12.1.9.3. Company Financials
- 12.1.9.4. SWOT Analysis
- 12.1.10 Real Estate Agencies
- 12.1.10.1. Company Overview
- 12.1.10.2. Products
- 12.1.10.3. Company Financials
- 12.1.10.4. SWOT Analysis
- 12.1.11 3 Colliers international
- 12.1.11.1. Company Overview
- 12.1.11.2. Products
- 12.1.11.3. Company Financials
- 12.1.11.4. SWOT Analysis
- 12.1.12 2 Europages
- 12.1.12.1. Company Overview
- 12.1.12.2. Products
- 12.1.12.3. Company Financials
- 12.1.12.4. SWOT Analysis
- 12.1.13 4 NREP (Logicenters)
- 12.1.13.1. Company Overview
- 12.1.13.2. Products
- 12.1.13.3. Company Financials
- 12.1.13.4. SWOT Analysis
- 12.1.14 2 Nordkap
- 12.1.14.1. Company Overview
- 12.1.14.2. Products
- 12.1.14.3. Company Financials
- 12.1.14.4. SWOT Analysis
- 12.1.15 3 Spotscale
- 12.1.15.1. Company Overview
- 12.1.15.2. Products
- 12.1.15.3. Company Financials
- 12.1.15.4. SWOT Analysis
- 12.1.16 4 WEC360
- 12.1.16.1. Company Overview
- 12.1.16.2. Products
- 12.1.16.3. Company Financials
- 12.1.16.4. SWOT Analysis
- 12.1.17 1 Stronghold
- 12.1.17.1. Company Overview
- 12.1.17.2. Products
- 12.1.17.3. Company Financials
- 12.1.17.4. SWOT Analysis
- 12.1.1 Other Companies(startups associations etc )
- 12.2. Market Entropy
- 12.2.1 Company's Key Areas Served
- 12.2.2 Recent Developments
- 12.3. Company Market Share Analysis 2025
- 12.3.1 Top 5 Companies Market Share Analysis
- 12.3.2 Top 3 Companies Market Share Analysis
- 12.4. List of Potential Customers
- 13. Research Methodology
List of Figures
- Figure 1: Global Scandinavian Commercial Property Industry Revenue Breakdown (million, %) by Region 2025 & 2033
- Figure 2: North America Scandinavian Commercial Property Industry Revenue (million), by Type 2025 & 2033
- Figure 3: North America Scandinavian Commercial Property Industry Revenue Share (%), by Type 2025 & 2033
- Figure 4: North America Scandinavian Commercial Property Industry Revenue (million), by Countries 2025 & 2033
- Figure 5: North America Scandinavian Commercial Property Industry Revenue Share (%), by Countries 2025 & 2033
- Figure 6: North America Scandinavian Commercial Property Industry Revenue (million), by Key Cities 2025 & 2033
- Figure 7: North America Scandinavian Commercial Property Industry Revenue Share (%), by Key Cities 2025 & 2033
- Figure 8: North America Scandinavian Commercial Property Industry Revenue (million), by Country 2025 & 2033
- Figure 9: North America Scandinavian Commercial Property Industry Revenue Share (%), by Country 2025 & 2033
- Figure 10: South America Scandinavian Commercial Property Industry Revenue (million), by Type 2025 & 2033
- Figure 11: South America Scandinavian Commercial Property Industry Revenue Share (%), by Type 2025 & 2033
- Figure 12: South America Scandinavian Commercial Property Industry Revenue (million), by Countries 2025 & 2033
- Figure 13: South America Scandinavian Commercial Property Industry Revenue Share (%), by Countries 2025 & 2033
- Figure 14: South America Scandinavian Commercial Property Industry Revenue (million), by Key Cities 2025 & 2033
- Figure 15: South America Scandinavian Commercial Property Industry Revenue Share (%), by Key Cities 2025 & 2033
- Figure 16: South America Scandinavian Commercial Property Industry Revenue (million), by Country 2025 & 2033
- Figure 17: South America Scandinavian Commercial Property Industry Revenue Share (%), by Country 2025 & 2033
- Figure 18: Europe Scandinavian Commercial Property Industry Revenue (million), by Type 2025 & 2033
- Figure 19: Europe Scandinavian Commercial Property Industry Revenue Share (%), by Type 2025 & 2033
- Figure 20: Europe Scandinavian Commercial Property Industry Revenue (million), by Countries 2025 & 2033
- Figure 21: Europe Scandinavian Commercial Property Industry Revenue Share (%), by Countries 2025 & 2033
- Figure 22: Europe Scandinavian Commercial Property Industry Revenue (million), by Key Cities 2025 & 2033
- Figure 23: Europe Scandinavian Commercial Property Industry Revenue Share (%), by Key Cities 2025 & 2033
- Figure 24: Europe Scandinavian Commercial Property Industry Revenue (million), by Country 2025 & 2033
- Figure 25: Europe Scandinavian Commercial Property Industry Revenue Share (%), by Country 2025 & 2033
- Figure 26: Middle East & Africa Scandinavian Commercial Property Industry Revenue (million), by Type 2025 & 2033
- Figure 27: Middle East & Africa Scandinavian Commercial Property Industry Revenue Share (%), by Type 2025 & 2033
- Figure 28: Middle East & Africa Scandinavian Commercial Property Industry Revenue (million), by Countries 2025 & 2033
- Figure 29: Middle East & Africa Scandinavian Commercial Property Industry Revenue Share (%), by Countries 2025 & 2033
- Figure 30: Middle East & Africa Scandinavian Commercial Property Industry Revenue (million), by Key Cities 2025 & 2033
- Figure 31: Middle East & Africa Scandinavian Commercial Property Industry Revenue Share (%), by Key Cities 2025 & 2033
- Figure 32: Middle East & Africa Scandinavian Commercial Property Industry Revenue (million), by Country 2025 & 2033
- Figure 33: Middle East & Africa Scandinavian Commercial Property Industry Revenue Share (%), by Country 2025 & 2033
- Figure 34: Asia Pacific Scandinavian Commercial Property Industry Revenue (million), by Type 2025 & 2033
- Figure 35: Asia Pacific Scandinavian Commercial Property Industry Revenue Share (%), by Type 2025 & 2033
- Figure 36: Asia Pacific Scandinavian Commercial Property Industry Revenue (million), by Countries 2025 & 2033
- Figure 37: Asia Pacific Scandinavian Commercial Property Industry Revenue Share (%), by Countries 2025 & 2033
- Figure 38: Asia Pacific Scandinavian Commercial Property Industry Revenue (million), by Key Cities 2025 & 2033
- Figure 39: Asia Pacific Scandinavian Commercial Property Industry Revenue Share (%), by Key Cities 2025 & 2033
- Figure 40: Asia Pacific Scandinavian Commercial Property Industry Revenue (million), by Country 2025 & 2033
- Figure 41: Asia Pacific Scandinavian Commercial Property Industry Revenue Share (%), by Country 2025 & 2033
List of Tables
- Table 1: Global Scandinavian Commercial Property Industry Revenue million Forecast, by Type 2020 & 2033
- Table 2: Global Scandinavian Commercial Property Industry Revenue million Forecast, by Countries 2020 & 2033
- Table 3: Global Scandinavian Commercial Property Industry Revenue million Forecast, by Key Cities 2020 & 2033
- Table 4: Global Scandinavian Commercial Property Industry Revenue million Forecast, by Region 2020 & 2033
- Table 5: Global Scandinavian Commercial Property Industry Revenue million Forecast, by Type 2020 & 2033
- Table 6: Global Scandinavian Commercial Property Industry Revenue million Forecast, by Countries 2020 & 2033
- Table 7: Global Scandinavian Commercial Property Industry Revenue million Forecast, by Key Cities 2020 & 2033
- Table 8: Global Scandinavian Commercial Property Industry Revenue million Forecast, by Country 2020 & 2033
- Table 9: United States Scandinavian Commercial Property Industry Revenue (million) Forecast, by Application 2020 & 2033
- Table 10: Canada Scandinavian Commercial Property Industry Revenue (million) Forecast, by Application 2020 & 2033
- Table 11: Mexico Scandinavian Commercial Property Industry Revenue (million) Forecast, by Application 2020 & 2033
- Table 12: Global Scandinavian Commercial Property Industry Revenue million Forecast, by Type 2020 & 2033
- Table 13: Global Scandinavian Commercial Property Industry Revenue million Forecast, by Countries 2020 & 2033
- Table 14: Global Scandinavian Commercial Property Industry Revenue million Forecast, by Key Cities 2020 & 2033
- Table 15: Global Scandinavian Commercial Property Industry Revenue million Forecast, by Country 2020 & 2033
- Table 16: Brazil Scandinavian Commercial Property Industry Revenue (million) Forecast, by Application 2020 & 2033
- Table 17: Argentina Scandinavian Commercial Property Industry Revenue (million) Forecast, by Application 2020 & 2033
- Table 18: Rest of South America Scandinavian Commercial Property Industry Revenue (million) Forecast, by Application 2020 & 2033
- Table 19: Global Scandinavian Commercial Property Industry Revenue million Forecast, by Type 2020 & 2033
- Table 20: Global Scandinavian Commercial Property Industry Revenue million Forecast, by Countries 2020 & 2033
- Table 21: Global Scandinavian Commercial Property Industry Revenue million Forecast, by Key Cities 2020 & 2033
- Table 22: Global Scandinavian Commercial Property Industry Revenue million Forecast, by Country 2020 & 2033
- Table 23: United Kingdom Scandinavian Commercial Property Industry Revenue (million) Forecast, by Application 2020 & 2033
- Table 24: Germany Scandinavian Commercial Property Industry Revenue (million) Forecast, by Application 2020 & 2033
- Table 25: France Scandinavian Commercial Property Industry Revenue (million) Forecast, by Application 2020 & 2033
- Table 26: Italy Scandinavian Commercial Property Industry Revenue (million) Forecast, by Application 2020 & 2033
- Table 27: Spain Scandinavian Commercial Property Industry Revenue (million) Forecast, by Application 2020 & 2033
- Table 28: Russia Scandinavian Commercial Property Industry Revenue (million) Forecast, by Application 2020 & 2033
- Table 29: Benelux Scandinavian Commercial Property Industry Revenue (million) Forecast, by Application 2020 & 2033
- Table 30: Nordics Scandinavian Commercial Property Industry Revenue (million) Forecast, by Application 2020 & 2033
- Table 31: Rest of Europe Scandinavian Commercial Property Industry Revenue (million) Forecast, by Application 2020 & 2033
- Table 32: Global Scandinavian Commercial Property Industry Revenue million Forecast, by Type 2020 & 2033
- Table 33: Global Scandinavian Commercial Property Industry Revenue million Forecast, by Countries 2020 & 2033
- Table 34: Global Scandinavian Commercial Property Industry Revenue million Forecast, by Key Cities 2020 & 2033
- Table 35: Global Scandinavian Commercial Property Industry Revenue million Forecast, by Country 2020 & 2033
- Table 36: Turkey Scandinavian Commercial Property Industry Revenue (million) Forecast, by Application 2020 & 2033
- Table 37: Israel Scandinavian Commercial Property Industry Revenue (million) Forecast, by Application 2020 & 2033
- Table 38: GCC Scandinavian Commercial Property Industry Revenue (million) Forecast, by Application 2020 & 2033
- Table 39: North Africa Scandinavian Commercial Property Industry Revenue (million) Forecast, by Application 2020 & 2033
- Table 40: South Africa Scandinavian Commercial Property Industry Revenue (million) Forecast, by Application 2020 & 2033
- Table 41: Rest of Middle East & Africa Scandinavian Commercial Property Industry Revenue (million) Forecast, by Application 2020 & 2033
- Table 42: Global Scandinavian Commercial Property Industry Revenue million Forecast, by Type 2020 & 2033
- Table 43: Global Scandinavian Commercial Property Industry Revenue million Forecast, by Countries 2020 & 2033
- Table 44: Global Scandinavian Commercial Property Industry Revenue million Forecast, by Key Cities 2020 & 2033
- Table 45: Global Scandinavian Commercial Property Industry Revenue million Forecast, by Country 2020 & 2033
- Table 46: China Scandinavian Commercial Property Industry Revenue (million) Forecast, by Application 2020 & 2033
- Table 47: India Scandinavian Commercial Property Industry Revenue (million) Forecast, by Application 2020 & 2033
- Table 48: Japan Scandinavian Commercial Property Industry Revenue (million) Forecast, by Application 2020 & 2033
- Table 49: South Korea Scandinavian Commercial Property Industry Revenue (million) Forecast, by Application 2020 & 2033
- Table 50: ASEAN Scandinavian Commercial Property Industry Revenue (million) Forecast, by Application 2020 & 2033
- Table 51: Oceania Scandinavian Commercial Property Industry Revenue (million) Forecast, by Application 2020 & 2033
- Table 52: Rest of Asia Pacific Scandinavian Commercial Property Industry Revenue (million) Forecast, by Application 2020 & 2033
Frequently Asked Questions
1. What is the projected Compound Annual Growth Rate (CAGR) of the Scandinavian Commercial Property Industry?
The projected CAGR is approximately 3.75%.
2. Which companies are prominent players in the Scandinavian Commercial Property Industry?
Key companies in the market include Other Companies(startups associations etc ), Developers, 5 Property Flow*List Not Exhaustive, 3 Citycon, 1 CBRE, 5 BPT Group, 2 Jeudan A/S, 1 Vasakronan AB, 4 Cushman and wakefield, Real Estate Agencies, 3 Colliers international, 2 Europages, 4 NREP (Logicenters), 2 Nordkap, 3 Spotscale, 4 WEC360, 1 Stronghold.
3. What are the main segments of the Scandinavian Commercial Property Industry?
The market segments include Type, Countries, Key Cities.
4. Can you provide details about the market size?
The market size is estimated to be USD 234.9 million as of 2022.
5. What are some drivers contributing to market growth?
Overall economic growth driving the market; The growth of business and industries driving the market.
6. What are the notable trends driving market growth?
Increase in Transaction Volume in the Office Market of Scandinavian Countries.
7. Are there any restraints impacting market growth?
Fluctuating economic conditions hindering the growth of the market; Difficulty in landownership and leasing rights affecting the market.
8. Can you provide examples of recent developments in the market?
N/A
9. What pricing options are available for accessing the report?
Pricing options include single-user, multi-user, and enterprise licenses priced at USD 3800, USD 4500, and USD 5800 respectively.
10. Is the market size provided in terms of value or volume?
The market size is provided in terms of value, measured in million.
11. Are there any specific market keywords associated with the report?
Yes, the market keyword associated with the report is "Scandinavian Commercial Property Industry," which aids in identifying and referencing the specific market segment covered.
12. How do I determine which pricing option suits my needs best?
The pricing options vary based on user requirements and access needs. Individual users may opt for single-user licenses, while businesses requiring broader access may choose multi-user or enterprise licenses for cost-effective access to the report.
13. Are there any additional resources or data provided in the Scandinavian Commercial Property Industry report?
While the report offers comprehensive insights, it's advisable to review the specific contents or supplementary materials provided to ascertain if additional resources or data are available.
14. How can I stay updated on further developments or reports in the Scandinavian Commercial Property Industry?
To stay informed about further developments, trends, and reports in the Scandinavian Commercial Property Industry, consider subscribing to industry newsletters, following relevant companies and organizations, or regularly checking reputable industry news sources and publications.
Methodology
Step 1 - Identification of Relevant Samples Size from Population Database


Step 2 - Approaches for Defining Global Market Size (Value, Volume* & Price*)

Note*: In applicable scenarios
Step 3 - Data Sources
Primary Research
- Web Analytics
- Survey Reports
- Research Institute
- Latest Research Reports
- Opinion Leaders
Secondary Research
- Annual Reports
- White Paper
- Latest Press Release
- Industry Association
- Paid Database
- Investor Presentations

Step 4 - Data Triangulation
Involves using different sources of information in order to increase the validity of a study
These sources are likely to be stakeholders in a program - participants, other researchers, program staff, other community members, and so on.
Then we put all data in single framework & apply various statistical tools to find out the dynamic on the market.
During the analysis stage, feedback from the stakeholder groups would be compared to determine areas of agreement as well as areas of divergence