

Key Insights
The global retail bag market, estimated at $18.97 billion in 2025, is projected to grow at a compound annual growth rate (CAGR) of 5.66% from 2025 to 2033. Key growth drivers include the surge in e-commerce, necessitating robust packaging and shipping solutions. Growing environmental consciousness fuels demand for sustainable materials such as paper, jute, cotton, and recycled PET (rPET). The expanding grocery and food service sectors, coupled with increasing awareness of plastic pollution, are accelerating the adoption of biodegradable and compostable alternatives. While North America and Europe currently lead in market share, the Asia-Pacific region is expected to witness substantial expansion due to its thriving retail and e-commerce sectors. The market is characterized by intense competition from major players like Mondi Group PLC, Smurfit Kappa Group PLC, and Novolex Holdings Inc., as well as specialized sustainable packaging providers. Despite challenges such as fluctuating raw material costs and regulatory pressures, the outlook remains positive, driven by retail growth and the demand for eco-friendly solutions.
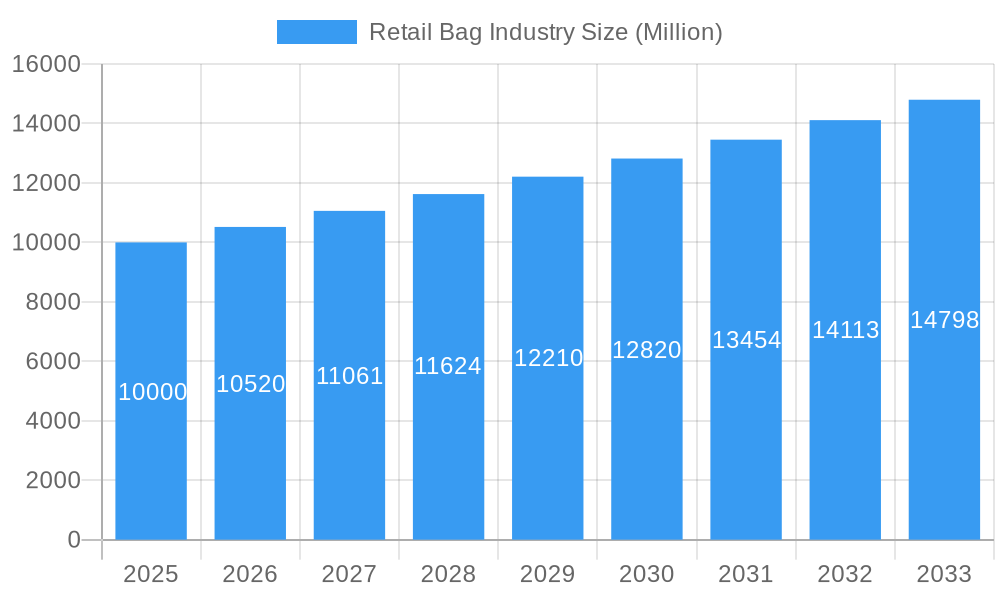
Retail Bag Industry Market Size (In Billion)
Segmentation reveals a diverse market landscape. Plastic bags, including PET and rPET, maintain a significant share due to their cost-effectiveness and durability, though this is anticipated to decrease as sustainability initiatives gain traction. Segments comprising paper and other materials like jute, cotton, and canvas are projected to exhibit the highest growth rates, underscoring a definitive shift towards sustainable packaging. Grocery stores and food service industries are primary consumers of retail bags, presenting substantial growth opportunities. The "Other End-Users" category, encompassing diverse retail outlets and online businesses, contributes significantly and is expected to expand in tandem with the burgeoning e-commerce sector. Strategic partnerships, product innovation, and a strong focus on sustainability are crucial for success in this dynamic market.
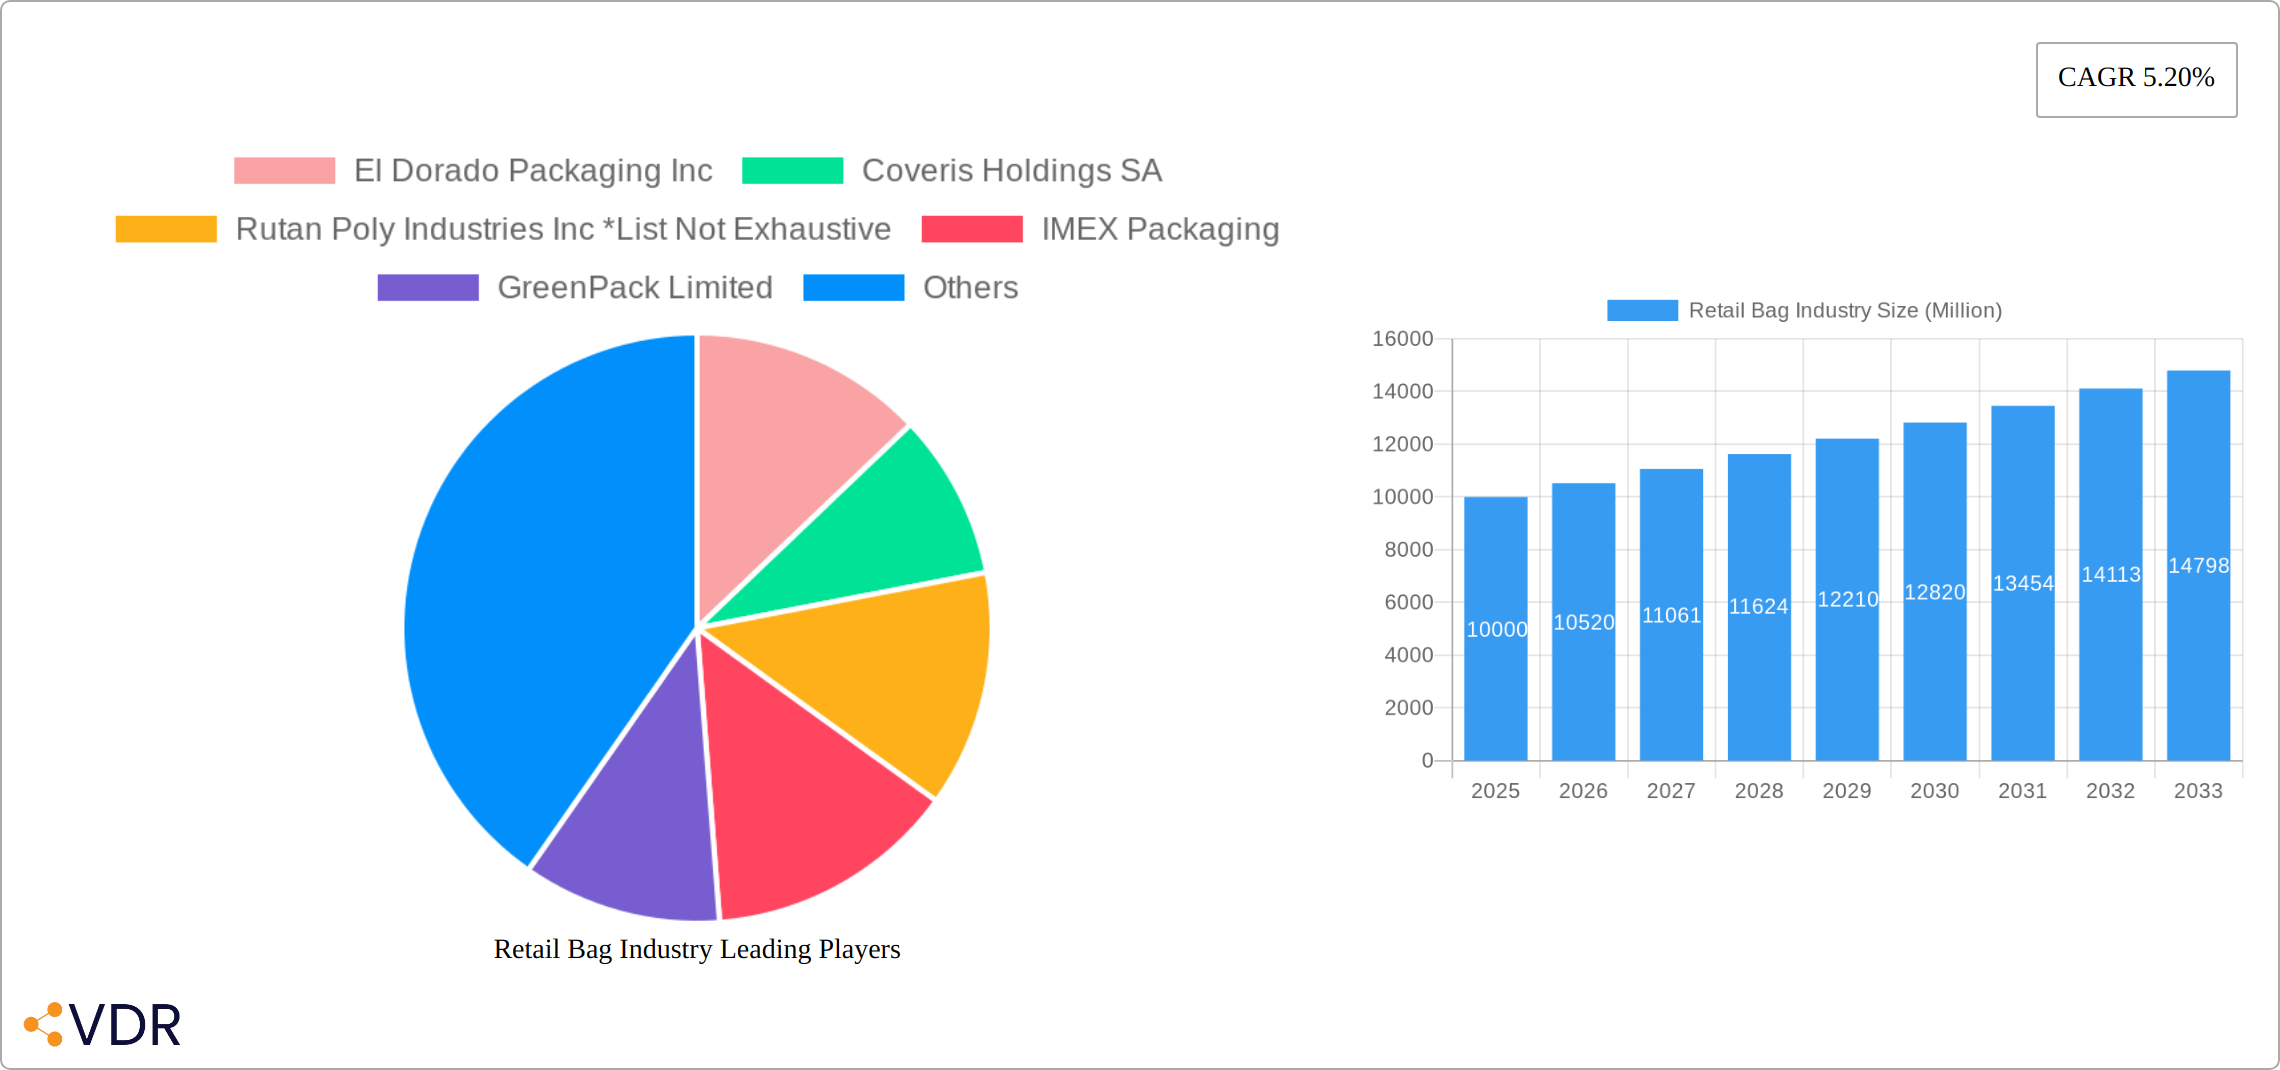
Retail Bag Industry Company Market Share
Retail Bag Industry: A Comprehensive Market Report (2019-2033)
This comprehensive report provides an in-depth analysis of the Retail Bag Industry, encompassing market dynamics, growth trends, regional dominance, product landscape, key players, and future outlook. The study period covers 2019-2033, with 2025 as the base and estimated year. The report utilizes data from the historical period (2019-2024) to forecast market trends from 2025-2033. Market values are presented in million units.
Retail Bag Industry Market Dynamics & Structure
The retail bag market exhibits moderate concentration, with several key players commanding significant market share. Technological innovation, fueled by escalating sustainability concerns and evolving consumer preferences, is a primary growth driver. Stringent regulatory frameworks targeting plastic waste are profoundly reshaping the industry landscape, accelerating the adoption of eco-friendly alternatives. The competitive pressure from substitute products, notably biodegradable and compostable options, is substantial. End-user demographics significantly influence market demand; grocery stores and the food service sectors represent particularly large segments. A notable level of M&A activity reflects companies strategically expanding their product portfolios and geographical reach. Furthermore, the increasing demand for customized and branded bags, especially in the e-commerce sector, presents both a challenge and an opportunity for industry players.
- Market Concentration: Moderately concentrated, with top 10 players holding [Insert Updated Percentage]% market share in 2024. This concentration is expected to [Increase/Decrease/Remain Stable] in the coming years.
- Technological Innovation: Focus on biodegradable, compostable, and recycled materials; advancements in automation and high-speed manufacturing processes are improving efficiency and reducing production costs.
- Regulatory Frameworks: Globally increasing restrictions on plastic bag usage are driving the transition to sustainable alternatives. Compliance with these regulations is a key factor impacting production costs and profitability.
- Competitive Substitutes: Biodegradable bags, paper bags, reusable bags, and even innovative alternatives like mycelium packaging, pose significant competition, forcing companies to differentiate through superior quality, sustainable sourcing, and cost-effectiveness.
- End-User Demographics: Grocery stores ([Insert Updated Number] million units), Food Service ([Insert Updated Number] million units), E-commerce ([Insert Updated Number] million units), Other End-Users ([Insert Updated Number] million units).
- M&A Trends: [Insert Updated Number] major deals recorded between 2019-2024, primarily focused on expansion, diversification, and acquiring companies specializing in sustainable materials and technologies. This trend is predicted to [Increase/Decrease/Remain Stable] in the coming years.
Retail Bag Industry Growth Trends & Insights
The Retail Bag Industry exhibits robust growth, propelled by rising consumer spending, the burgeoning e-commerce sector, and a heightened awareness of environmental sustainability. Market size witnessed a CAGR of [Insert Updated Percentage]% during the historical period (2019-2024), reaching [Insert Updated Number] million units in 2024. The adoption rate of eco-friendly bags is steadily increasing, driven by consumer demand and stricter regulations. Technological advancements, particularly in biodegradable material science and manufacturing efficiency, contribute significantly to market expansion. Shifts in consumer behavior towards sustainable and convenient solutions further propel this growth. The forecast period (2025-2033) projects a CAGR of [Insert Updated Percentage]%, driven by increased disposable income, expansion into emerging markets, and the ongoing need for effective and sustainable packaging solutions. Market penetration of sustainable retail bags is anticipated to reach [Insert Updated Percentage]% by 2033. Specific growth areas include the increasing demand for custom-printed bags for branding purposes.
Dominant Regions, Countries, or Segments in Retail Bag Industry
North America and Europe currently dominate the retail bag market, driven by strong consumer demand, established retail infrastructure, and stricter environmental regulations. Within these regions, the United States and Germany are leading countries. Among segments, the Plastic material type holds the largest market share, followed by Paper and Other Material Types (Jute, Cotton, Canvas). Grocery stores remain the largest end-user segment, while the Food Service sector also exhibits significant growth potential.
- Key Drivers: Stringent environmental regulations, increasing consumer preference for sustainable options, robust retail infrastructure.
- Dominance Factors: High consumer spending, developed retail sector, strong regulatory push for sustainability.
- Growth Potential: Emerging economies in Asia-Pacific are poised for significant growth due to increasing urbanization and rising consumption.
Retail Bag Industry Product Landscape
The retail bag market offers diverse products, ranging from conventional plastic bags to innovative biodegradable and compostable alternatives. These products vary in material composition (plastic, paper, jute, etc.), size, design, and functionality. Key innovations include oxo-biodegradable bags, bags made from recycled materials (rPET), and bags with enhanced durability and printing capabilities. The unique selling propositions focus on sustainability, eco-friendliness, strength, and customization options. Technological advancements primarily involve improving biodegradability, recyclability, and reducing environmental impact.
Key Drivers, Barriers & Challenges in Retail Bag Industry
Key Drivers:
- The explosive growth of the e-commerce sector, driving a constant demand for shipping bags and packaging solutions.
- The increasing consumer awareness of environmental issues and a growing preference for sustainable and ethically sourced bags.
- Stringent government regulations aimed at reducing plastic waste, incentivizing the adoption of eco-friendly alternatives.
- The increasing demand for customized and branded bags for marketing and branding purposes.
Challenges & Restraints:
- Fluctuating raw material prices, particularly for sustainable alternatives, significantly impacting profitability and requiring robust supply chain management.
- Intense competition from low-cost manufacturers, particularly in emerging markets, requiring differentiation strategies beyond price.
- The significant costs associated with complying with stringent regulations and sourcing sustainable materials. This adds an estimated [Insert Updated Percentage]% to production costs for eco-friendly bags, necessitating innovative cost-saving strategies.
Emerging Opportunities in Retail Bag Industry
- Growing demand for customized and branded bags.
- Expanding market for reusable bags and eco-friendly options.
- Opportunities in emerging markets with increasing retail infrastructure.
- Development of innovative materials with improved biodegradability and compostability.
Growth Accelerators in the Retail Bag Industry
Technological advancements in biodegradable materials and manufacturing processes are pivotal for growth. Strategic partnerships between material suppliers, bag manufacturers, and retailers facilitate innovation and market penetration. Expanding into untapped markets, particularly in developing regions with rising disposable incomes and growing retail sectors, presents significant opportunities.
Key Players Shaping the Retail Bag Industry Market
- El Dorado Packaging Inc
- Coveris Holdings SA
- Rutan Poly Industries Inc
- IMEX Packaging
- GreenPack Limited
- American Packaging Corporation
- Atlantic Poly Inc
- Rainbow Packaging Inc
- Global-Pak Inc
- Novolex Holdings Inc
- Mondi Group PLC
- International Paper Company
- Smurfit Kappa Group PLC
- BioPak Pty Ltd
- Welton Bibby And Baron Limited
- The Carry Bag Company
- Attwoods Packaging Company
Notable Milestones in Retail Bag Industry Sector
- June 2021: Mondi Group Inc. announced plans to expand its paper-based MailerBAG range, focusing on sustainable e-commerce packaging. [Add further details on impact and success].
- May 2021: Coveris Holdings acquired Four 04 Packaging, strengthening its position in biodegradable bags for fresh produce. [Add further details on impact and success].
- [Add other recent significant milestones with dates and details]
In-Depth Retail Bag Industry Market Outlook
The retail bag market is poised for continued significant growth, driven by the confluence of sustainability concerns, technological innovations, and the ever-expanding e-commerce sector. Strategic partnerships focused on developing innovative, eco-friendly, and customizable products will play a crucial role in shaping future market dynamics. The focus on sustainable, high-quality, and branded options will continue to drive demand, presenting lucrative opportunities for manufacturers who can effectively adapt to the evolving consumer and regulatory landscape. Companies that successfully integrate circular economy principles into their operations and supply chains will gain a competitive edge.
Retail Bag Industry Segmentation
-
1. Material Type
-
1.1. Plastic
- 1.1.1. Polyethylene (PE)
- 1.1.2. Polypropylene (PP)
- 1.1.3. Other Plastic Types (PET, Polyester, rPET)
- 1.2. Paper
- 1.3. Other Material Types (Jute, Cotton, Canvas)
-
1.1. Plastic
-
2. End-User
- 2.1. Grocery Stores
- 2.2. Food Service
- 2.3. Other End-Users
Retail Bag Industry Segmentation By Geography
- 1. North America
- 2. Europe
- 3. Asia Pacific
- 4. Latin America
- 5. Middle East and Africa
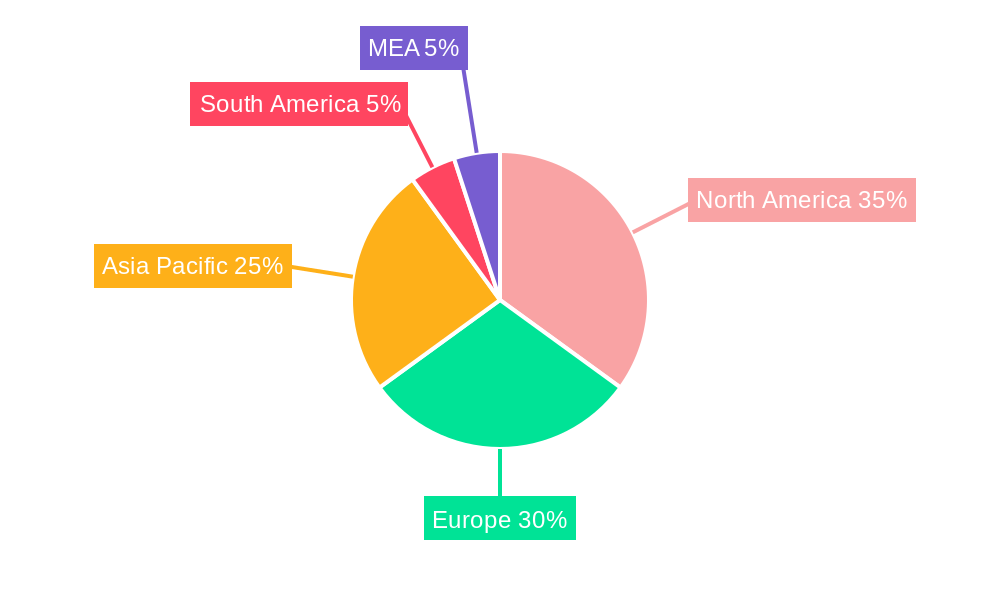
Retail Bag Industry Regional Market Share
Geographic Coverage of Retail Bag Industry
Retail Bag Industry REPORT HIGHLIGHTS
| Aspects | Details |
|---|---|
| Study Period | 2020-2034 |
| Base Year | 2025 |
| Estimated Year | 2026 |
| Forecast Period | 2026-2034 |
| Historical Period | 2020-2025 |
| Growth Rate | CAGR of 5.66% from 2020-2034 |
| Segmentation |
|
Table of Contents
- 1. Introduction
- 1.1. Research Scope
- 1.2. Market Segmentation
- 1.3. Research Objective
- 1.4. Definitions and Assumptions
- 2. Executive Summary
- 2.1. Market Snapshot
- 3. Market Dynamics
- 3.1. Market Drivers
- 3.2. Market Restrains
- 3.3. Market Trends
- 3.4. Market Opportunities
- 4. Market Factor Analysis
- 4.1. Porters Five Forces
- 4.1.1. Bargaining Power of Suppliers
- 4.1.2. Bargaining Power of Buyers
- 4.1.3. Threat of New Entrants
- 4.1.4. Threat of Substitutes
- 4.1.5. Competitive Rivalry
- 4.2. PESTEL analysis
- 4.3. BCG Analysis
- 4.3.1. Stars (High Growth, High Market Share)
- 4.3.2. Cash Cows (Low Growth, High Market Share)
- 4.3.3. Question Mark (High Growth, Low Market Share)
- 4.3.4. Dogs (Low Growth, Low Market Share)
- 4.4. Ansoff Matrix Analysis
- 4.5. Supply Chain Analysis
- 4.6. Regulatory Landscape
- 4.7. Current Market Potential and Opportunity Assessment (TAM–SAM–SOM Framework)
- 4.8. VDR Analyst Note
- 4.1. Porters Five Forces
- 5. Market Analysis, Insights and Forecast 2021-2033
- 5.1. Market Analysis, Insights and Forecast - by Material Type
- 5.1.1. Plastic
- 5.1.1.1. Polyethylene (PE)
- 5.1.1.2. Polypropylene (PP)
- 5.1.1.3. Other Plastic Types (PET, Polyester, rPET)
- 5.1.2. Paper
- 5.1.3. Other Material Types (Jute, Cotton, Canvas)
- 5.1.1. Plastic
- 5.2. Market Analysis, Insights and Forecast - by End-User
- 5.2.1. Grocery Stores
- 5.2.2. Food Service
- 5.2.3. Other End-Users
- 5.3. Market Analysis, Insights and Forecast - by Region
- 5.3.1. North America
- 5.3.2. Europe
- 5.3.3. Asia Pacific
- 5.3.4. Latin America
- 5.3.5. Middle East and Africa
- 5.1. Market Analysis, Insights and Forecast - by Material Type
- 6. Global Retail Bag Industry Analysis, Insights and Forecast, 2021-2033
- 6.1. Market Analysis, Insights and Forecast - by Material Type
- 6.1.1. Plastic
- 6.1.1.1. Polyethylene (PE)
- 6.1.1.2. Polypropylene (PP)
- 6.1.1.3. Other Plastic Types (PET, Polyester, rPET)
- 6.1.2. Paper
- 6.1.3. Other Material Types (Jute, Cotton, Canvas)
- 6.1.1. Plastic
- 6.2. Market Analysis, Insights and Forecast - by End-User
- 6.2.1. Grocery Stores
- 6.2.2. Food Service
- 6.2.3. Other End-Users
- 6.1. Market Analysis, Insights and Forecast - by Material Type
- 7. North America Retail Bag Industry Analysis, Insights and Forecast, 2021-2033
- 7.1. Market Analysis, Insights and Forecast - by Material Type
- 7.1.1. Plastic
- 7.1.1.1. Polyethylene (PE)
- 7.1.1.2. Polypropylene (PP)
- 7.1.1.3. Other Plastic Types (PET, Polyester, rPET)
- 7.1.2. Paper
- 7.1.3. Other Material Types (Jute, Cotton, Canvas)
- 7.1.1. Plastic
- 7.2. Market Analysis, Insights and Forecast - by End-User
- 7.2.1. Grocery Stores
- 7.2.2. Food Service
- 7.2.3. Other End-Users
- 7.1. Market Analysis, Insights and Forecast - by Material Type
- 8. Europe Retail Bag Industry Analysis, Insights and Forecast, 2021-2033
- 8.1. Market Analysis, Insights and Forecast - by Material Type
- 8.1.1. Plastic
- 8.1.1.1. Polyethylene (PE)
- 8.1.1.2. Polypropylene (PP)
- 8.1.1.3. Other Plastic Types (PET, Polyester, rPET)
- 8.1.2. Paper
- 8.1.3. Other Material Types (Jute, Cotton, Canvas)
- 8.1.1. Plastic
- 8.2. Market Analysis, Insights and Forecast - by End-User
- 8.2.1. Grocery Stores
- 8.2.2. Food Service
- 8.2.3. Other End-Users
- 8.1. Market Analysis, Insights and Forecast - by Material Type
- 9. Asia Pacific Retail Bag Industry Analysis, Insights and Forecast, 2021-2033
- 9.1. Market Analysis, Insights and Forecast - by Material Type
- 9.1.1. Plastic
- 9.1.1.1. Polyethylene (PE)
- 9.1.1.2. Polypropylene (PP)
- 9.1.1.3. Other Plastic Types (PET, Polyester, rPET)
- 9.1.2. Paper
- 9.1.3. Other Material Types (Jute, Cotton, Canvas)
- 9.1.1. Plastic
- 9.2. Market Analysis, Insights and Forecast - by End-User
- 9.2.1. Grocery Stores
- 9.2.2. Food Service
- 9.2.3. Other End-Users
- 9.1. Market Analysis, Insights and Forecast - by Material Type
- 10. Latin America Retail Bag Industry Analysis, Insights and Forecast, 2021-2033
- 10.1. Market Analysis, Insights and Forecast - by Material Type
- 10.1.1. Plastic
- 10.1.1.1. Polyethylene (PE)
- 10.1.1.2. Polypropylene (PP)
- 10.1.1.3. Other Plastic Types (PET, Polyester, rPET)
- 10.1.2. Paper
- 10.1.3. Other Material Types (Jute, Cotton, Canvas)
- 10.1.1. Plastic
- 10.2. Market Analysis, Insights and Forecast - by End-User
- 10.2.1. Grocery Stores
- 10.2.2. Food Service
- 10.2.3. Other End-Users
- 10.1. Market Analysis, Insights and Forecast - by Material Type
- 11. Middle East and Africa Retail Bag Industry Analysis, Insights and Forecast, 2021-2033
- 11.1. Market Analysis, Insights and Forecast - by Material Type
- 11.1.1. Plastic
- 11.1.1.1. Polyethylene (PE)
- 11.1.1.2. Polypropylene (PP)
- 11.1.1.3. Other Plastic Types (PET, Polyester, rPET)
- 11.1.2. Paper
- 11.1.3. Other Material Types (Jute, Cotton, Canvas)
- 11.1.1. Plastic
- 11.2. Market Analysis, Insights and Forecast - by End-User
- 11.2.1. Grocery Stores
- 11.2.2. Food Service
- 11.2.3. Other End-Users
- 11.1. Market Analysis, Insights and Forecast - by Material Type
- 12. Competitive Analysis
- 12.1. Company Profiles
- 12.1.1 El Dorado Packaging Inc
- 12.1.1.1. Company Overview
- 12.1.1.2. Products
- 12.1.1.3. Company Financials
- 12.1.1.4. SWOT Analysis
- 12.1.2 Coveris Holdings SA
- 12.1.2.1. Company Overview
- 12.1.2.2. Products
- 12.1.2.3. Company Financials
- 12.1.2.4. SWOT Analysis
- 12.1.3 Rutan Poly Industries Inc *List Not Exhaustive
- 12.1.3.1. Company Overview
- 12.1.3.2. Products
- 12.1.3.3. Company Financials
- 12.1.3.4. SWOT Analysis
- 12.1.4 IMEX Packaging
- 12.1.4.1. Company Overview
- 12.1.4.2. Products
- 12.1.4.3. Company Financials
- 12.1.4.4. SWOT Analysis
- 12.1.5 GreenPack Limited
- 12.1.5.1. Company Overview
- 12.1.5.2. Products
- 12.1.5.3. Company Financials
- 12.1.5.4. SWOT Analysis
- 12.1.6 American Packaging Corporation
- 12.1.6.1. Company Overview
- 12.1.6.2. Products
- 12.1.6.3. Company Financials
- 12.1.6.4. SWOT Analysis
- 12.1.7 Atlantic Poly Inc
- 12.1.7.1. Company Overview
- 12.1.7.2. Products
- 12.1.7.3. Company Financials
- 12.1.7.4. SWOT Analysis
- 12.1.8 Rainbow Packaging Inc
- 12.1.8.1. Company Overview
- 12.1.8.2. Products
- 12.1.8.3. Company Financials
- 12.1.8.4. SWOT Analysis
- 12.1.9 Global-Pak Inc
- 12.1.9.1. Company Overview
- 12.1.9.2. Products
- 12.1.9.3. Company Financials
- 12.1.9.4. SWOT Analysis
- 12.1.10 Novolex Holdings Inc
- 12.1.10.1. Company Overview
- 12.1.10.2. Products
- 12.1.10.3. Company Financials
- 12.1.10.4. SWOT Analysis
- 12.1.11 Mondi Group PLC
- 12.1.11.1. Company Overview
- 12.1.11.2. Products
- 12.1.11.3. Company Financials
- 12.1.11.4. SWOT Analysis
- 12.1.12 International Paper Company
- 12.1.12.1. Company Overview
- 12.1.12.2. Products
- 12.1.12.3. Company Financials
- 12.1.12.4. SWOT Analysis
- 12.1.13 Smurfit Kappa Group PLC
- 12.1.13.1. Company Overview
- 12.1.13.2. Products
- 12.1.13.3. Company Financials
- 12.1.13.4. SWOT Analysis
- 12.1.14 BioPak Pty Ltd
- 12.1.14.1. Company Overview
- 12.1.14.2. Products
- 12.1.14.3. Company Financials
- 12.1.14.4. SWOT Analysis
- 12.1.15 Welton Bibby And Baron Limited
- 12.1.15.1. Company Overview
- 12.1.15.2. Products
- 12.1.15.3. Company Financials
- 12.1.15.4. SWOT Analysis
- 12.1.16 The Carry Bag Company
- 12.1.16.1. Company Overview
- 12.1.16.2. Products
- 12.1.16.3. Company Financials
- 12.1.16.4. SWOT Analysis
- 12.1.17 Attwoods Packaging Company
- 12.1.17.1. Company Overview
- 12.1.17.2. Products
- 12.1.17.3. Company Financials
- 12.1.17.4. SWOT Analysis
- 12.1.1 El Dorado Packaging Inc
- 12.2. Market Entropy
- 12.2.1 Company's Key Areas Served
- 12.2.2 Recent Developments
- 12.3. Company Market Share Analysis 2025
- 12.3.1 Top 5 Companies Market Share Analysis
- 12.3.2 Top 3 Companies Market Share Analysis
- 12.4. List of Potential Customers
- 13. Research Methodology
List of Figures
- Figure 1: Global Retail Bag Industry Revenue Breakdown (billion, %) by Region 2025 & 2033
- Figure 2: North America Retail Bag Industry Revenue (billion), by Material Type 2025 & 2033
- Figure 3: North America Retail Bag Industry Revenue Share (%), by Material Type 2025 & 2033
- Figure 4: North America Retail Bag Industry Revenue (billion), by End-User 2025 & 2033
- Figure 5: North America Retail Bag Industry Revenue Share (%), by End-User 2025 & 2033
- Figure 6: North America Retail Bag Industry Revenue (billion), by Country 2025 & 2033
- Figure 7: North America Retail Bag Industry Revenue Share (%), by Country 2025 & 2033
- Figure 8: Europe Retail Bag Industry Revenue (billion), by Material Type 2025 & 2033
- Figure 9: Europe Retail Bag Industry Revenue Share (%), by Material Type 2025 & 2033
- Figure 10: Europe Retail Bag Industry Revenue (billion), by End-User 2025 & 2033
- Figure 11: Europe Retail Bag Industry Revenue Share (%), by End-User 2025 & 2033
- Figure 12: Europe Retail Bag Industry Revenue (billion), by Country 2025 & 2033
- Figure 13: Europe Retail Bag Industry Revenue Share (%), by Country 2025 & 2033
- Figure 14: Asia Pacific Retail Bag Industry Revenue (billion), by Material Type 2025 & 2033
- Figure 15: Asia Pacific Retail Bag Industry Revenue Share (%), by Material Type 2025 & 2033
- Figure 16: Asia Pacific Retail Bag Industry Revenue (billion), by End-User 2025 & 2033
- Figure 17: Asia Pacific Retail Bag Industry Revenue Share (%), by End-User 2025 & 2033
- Figure 18: Asia Pacific Retail Bag Industry Revenue (billion), by Country 2025 & 2033
- Figure 19: Asia Pacific Retail Bag Industry Revenue Share (%), by Country 2025 & 2033
- Figure 20: Latin America Retail Bag Industry Revenue (billion), by Material Type 2025 & 2033
- Figure 21: Latin America Retail Bag Industry Revenue Share (%), by Material Type 2025 & 2033
- Figure 22: Latin America Retail Bag Industry Revenue (billion), by End-User 2025 & 2033
- Figure 23: Latin America Retail Bag Industry Revenue Share (%), by End-User 2025 & 2033
- Figure 24: Latin America Retail Bag Industry Revenue (billion), by Country 2025 & 2033
- Figure 25: Latin America Retail Bag Industry Revenue Share (%), by Country 2025 & 2033
- Figure 26: Middle East and Africa Retail Bag Industry Revenue (billion), by Material Type 2025 & 2033
- Figure 27: Middle East and Africa Retail Bag Industry Revenue Share (%), by Material Type 2025 & 2033
- Figure 28: Middle East and Africa Retail Bag Industry Revenue (billion), by End-User 2025 & 2033
- Figure 29: Middle East and Africa Retail Bag Industry Revenue Share (%), by End-User 2025 & 2033
- Figure 30: Middle East and Africa Retail Bag Industry Revenue (billion), by Country 2025 & 2033
- Figure 31: Middle East and Africa Retail Bag Industry Revenue Share (%), by Country 2025 & 2033
List of Tables
- Table 1: Global Retail Bag Industry Revenue billion Forecast, by Material Type 2020 & 2033
- Table 2: Global Retail Bag Industry Revenue billion Forecast, by End-User 2020 & 2033
- Table 3: Global Retail Bag Industry Revenue billion Forecast, by Region 2020 & 2033
- Table 4: Global Retail Bag Industry Revenue billion Forecast, by Material Type 2020 & 2033
- Table 5: Global Retail Bag Industry Revenue billion Forecast, by End-User 2020 & 2033
- Table 6: Global Retail Bag Industry Revenue billion Forecast, by Country 2020 & 2033
- Table 7: Global Retail Bag Industry Revenue billion Forecast, by Material Type 2020 & 2033
- Table 8: Global Retail Bag Industry Revenue billion Forecast, by End-User 2020 & 2033
- Table 9: Global Retail Bag Industry Revenue billion Forecast, by Country 2020 & 2033
- Table 10: Global Retail Bag Industry Revenue billion Forecast, by Material Type 2020 & 2033
- Table 11: Global Retail Bag Industry Revenue billion Forecast, by End-User 2020 & 2033
- Table 12: Global Retail Bag Industry Revenue billion Forecast, by Country 2020 & 2033
- Table 13: Global Retail Bag Industry Revenue billion Forecast, by Material Type 2020 & 2033
- Table 14: Global Retail Bag Industry Revenue billion Forecast, by End-User 2020 & 2033
- Table 15: Global Retail Bag Industry Revenue billion Forecast, by Country 2020 & 2033
- Table 16: Global Retail Bag Industry Revenue billion Forecast, by Material Type 2020 & 2033
- Table 17: Global Retail Bag Industry Revenue billion Forecast, by End-User 2020 & 2033
- Table 18: Global Retail Bag Industry Revenue billion Forecast, by Country 2020 & 2033
Frequently Asked Questions
1. What is the projected Compound Annual Growth Rate (CAGR) of the Retail Bag Industry?
The projected CAGR is approximately 5.66%.
2. Which companies are prominent players in the Retail Bag Industry?
Key companies in the market include El Dorado Packaging Inc, Coveris Holdings SA, Rutan Poly Industries Inc *List Not Exhaustive, IMEX Packaging, GreenPack Limited, American Packaging Corporation, Atlantic Poly Inc, Rainbow Packaging Inc, Global-Pak Inc, Novolex Holdings Inc, Mondi Group PLC, International Paper Company, Smurfit Kappa Group PLC, BioPak Pty Ltd, Welton Bibby And Baron Limited, The Carry Bag Company, Attwoods Packaging Company.
3. What are the main segments of the Retail Bag Industry?
The market segments include Material Type, End-User.
4. Can you provide details about the market size?
The market size is estimated to be USD 18.97 billion as of 2022.
5. What are some drivers contributing to market growth?
Growing Preference for Paper Bags Globally; Rising Consumption of Personal Care Products and Cosmetics.
6. What are the notable trends driving market growth?
Paper Material Segment to Have a Dominant Share in the Market.
7. Are there any restraints impacting market growth?
Restrictions on Using Plastic Retail Bags.
8. Can you provide examples of recent developments in the market?
June 2021 - Mondi Group Inc. announced plans for increasing its paper-based MailerBAG range to further replace plastic packaging in e-commerce with a recyclable solution made of responsibly sourced renewable materials.
9. What pricing options are available for accessing the report?
Pricing options include single-user, multi-user, and enterprise licenses priced at USD 4750, USD 5250, and USD 8750 respectively.
10. Is the market size provided in terms of value or volume?
The market size is provided in terms of value, measured in billion.
11. Are there any specific market keywords associated with the report?
Yes, the market keyword associated with the report is "Retail Bag Industry," which aids in identifying and referencing the specific market segment covered.
12. How do I determine which pricing option suits my needs best?
The pricing options vary based on user requirements and access needs. Individual users may opt for single-user licenses, while businesses requiring broader access may choose multi-user or enterprise licenses for cost-effective access to the report.
13. Are there any additional resources or data provided in the Retail Bag Industry report?
While the report offers comprehensive insights, it's advisable to review the specific contents or supplementary materials provided to ascertain if additional resources or data are available.
14. How can I stay updated on further developments or reports in the Retail Bag Industry?
To stay informed about further developments, trends, and reports in the Retail Bag Industry, consider subscribing to industry newsletters, following relevant companies and organizations, or regularly checking reputable industry news sources and publications.
Methodology
Step 1 - Identification of Relevant Samples Size from Population Database


Step 2 - Approaches for Defining Global Market Size (Value, Volume* & Price*)

Note*: In applicable scenarios
Step 3 - Data Sources
Primary Research
- Web Analytics
- Survey Reports
- Research Institute
- Latest Research Reports
- Opinion Leaders
Secondary Research
- Annual Reports
- White Paper
- Latest Press Release
- Industry Association
- Paid Database
- Investor Presentations

Step 4 - Data Triangulation
Involves using different sources of information in order to increase the validity of a study
These sources are likely to be stakeholders in a program - participants, other researchers, program staff, other community members, and so on.
Then we put all data in single framework & apply various statistical tools to find out the dynamic on the market.
During the analysis stage, feedback from the stakeholder groups would be compared to determine areas of agreement as well as areas of divergence