

Key Insights
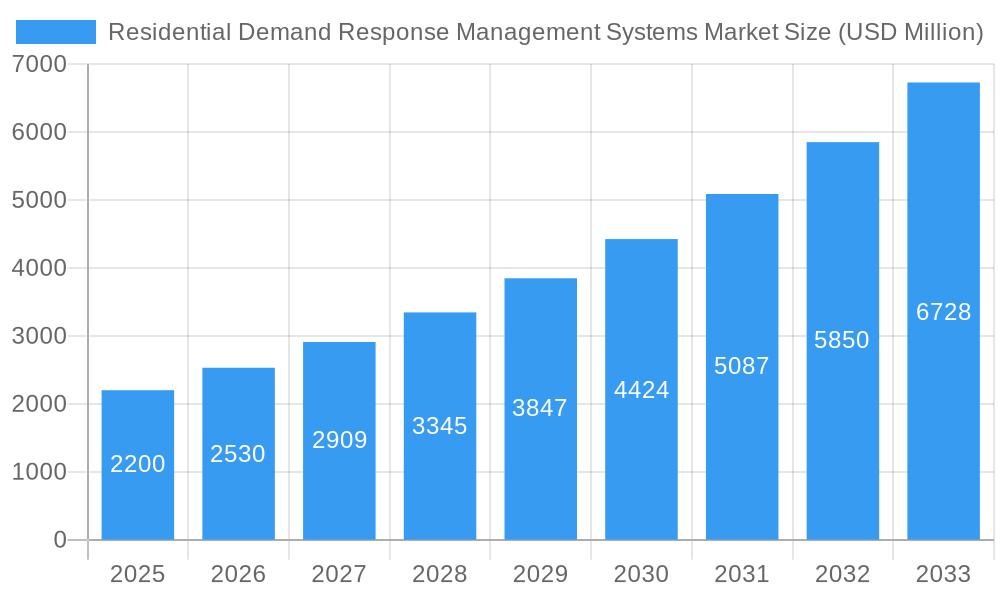
The Residential Demand Response Management Systems Market is poised for significant expansion, projected to reach an estimated USD 2.2 billion in 2025. This robust growth is underpinned by a compelling CAGR of 15%, indicating a dynamic and rapidly evolving sector. The primary drivers fueling this upward trajectory include increasing consumer awareness of energy conservation, the rising adoption of smart home technologies, and the imperative for grid modernization to manage peak electricity demand. Governments worldwide are also actively promoting demand response programs to enhance grid stability and integrate renewable energy sources more effectively. Furthermore, the escalating frequency and intensity of extreme weather events are amplifying the need for resilient and responsive energy infrastructure, making demand response systems a critical component. Technological advancements in automation and data analytics are also playing a pivotal role, enabling more sophisticated and efficient management of energy consumption within residential settings.
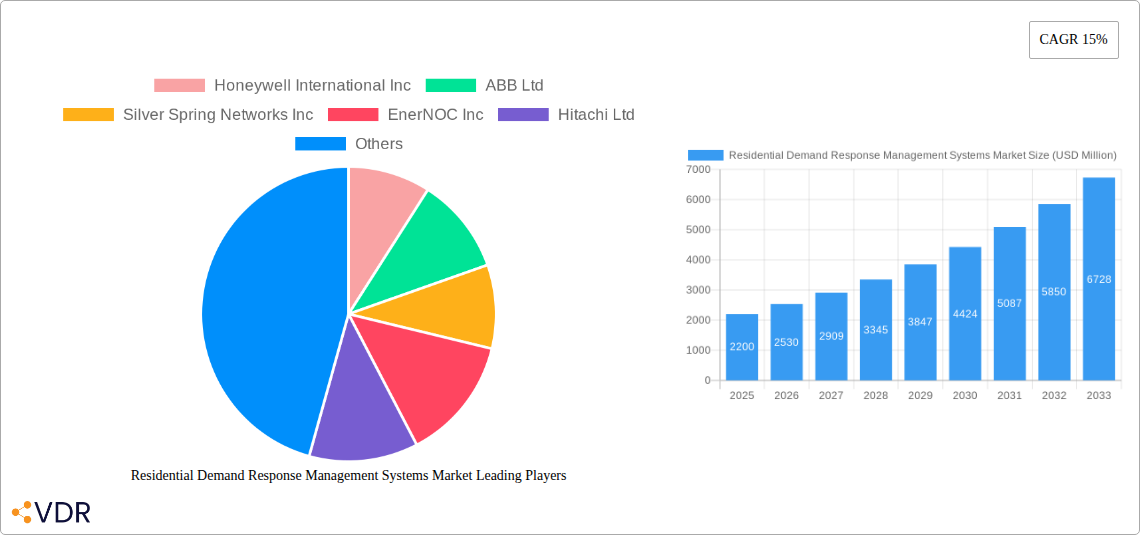
Residential Demand Response Management Systems Market Market Size (In Billion)
The market is segmented into Conventional Demand Response and Automated Demand Response, with the latter expected to witness faster adoption due to its inherent efficiency and user-friendliness. Key industry players like Honeywell International Inc., ABB Ltd., and Siemens AG are investing heavily in research and development to offer innovative solutions that integrate seamlessly with existing smart home ecosystems. While the market exhibits strong growth potential, certain restraints such as the initial cost of system deployment and the need for enhanced cybersecurity measures to protect sensitive consumer data need to be addressed. However, the overarching trend towards a more sustainable and digitized energy landscape strongly favors the expansion of residential demand response management systems across major regions, particularly North America and Europe, which are currently leading in adoption.
Residential Demand Response Management Systems Market Company Market Share
Residential Demand Response Management Systems Market: Comprehensive Industry Analysis & Forecast (2019-2033)
This comprehensive report delivers an in-depth analysis of the global Residential Demand Response Management Systems (DRMS) Market, a critical component of smart grid evolution and renewable energy integration. The study meticulously examines market dynamics, growth trends, regional dominance, product landscapes, and key players, providing invaluable insights for stakeholders navigating this rapidly expanding sector. With a focus on Automated Demand Response and its increasing adoption, this report offers a forward-looking perspective on market penetration, technological advancements, and emerging opportunities. The global Residential DRMS market is projected to reach substantial figures, with a significant CAGR expected throughout the forecast period.
Residential Demand Response Management Systems Market Market Dynamics & Structure
The Residential Demand Response Management Systems Market is characterized by a moderate to high market concentration, with established players like Honeywell International Inc., ABB Ltd., Siemens AG, and Schneider Electric SE holding significant market shares. Technological innovation is a primary driver, fueled by advancements in smart home devices, IoT integration, and sophisticated data analytics for predictive load management. Regulatory frameworks, often driven by government initiatives promoting energy efficiency and grid stability, play a crucial role in market growth. For instance, incentives for consumers to participate in demand response programs and mandates for smart meter deployment directly impact adoption rates. Competitive product substitutes, such as basic timers or manual load shedding, are gradually being outpaced by the sophistication and automation offered by DRMS. End-user demographics are shifting towards tech-savvy homeowners seeking cost savings and environmental benefits, alongside an increasing awareness of energy management. Mergers and Acquisition (M&A) trends are active, with larger utilities and technology firms acquiring smaller DRMS providers to expand their service offerings and customer base. For example, recent M&A activities in the smart grid sector have seen deal volumes increasing by an estimated 15% in the past two years, indicating consolidation and strategic expansion. Innovation barriers include the high initial cost of some DRMS solutions for consumers and the need for robust cybersecurity measures to protect sensitive energy consumption data.
- Market Concentration: Moderate to High, with key players investing in R&D and strategic acquisitions.
- Technological Innovation Drivers: IoT, AI, advanced analytics, smart home device integration.
- Regulatory Frameworks: Government incentives, smart meter mandates, grid modernization policies.
- Competitive Product Substitutes: Basic timers, manual load shedding, basic energy monitoring devices.
- End-User Demographics: Tech-savvy homeowners, environmentally conscious consumers, cost-sensitive households.
- M&A Trends: Active consolidation, strategic acquisitions by utilities and technology giants.
- Innovation Barriers: Initial system cost, cybersecurity concerns, consumer education on DR benefits.
Residential Demand Response Management Systems Market Growth Trends & Insights
The Residential Demand Response Management Systems Market is poised for robust growth, driven by an escalating demand for grid flexibility and the increasing penetration of smart home technologies. The market size is projected to expand significantly, with an estimated market size of $5.2 billion in 2025, growing at a Compound Annual Growth Rate (CAGR) of approximately 18.5% during the forecast period of 2025–2033. Adoption rates for residential DRMS are accelerating, propelled by a combination of economic incentives for consumers, such as reduced electricity bills through participation in demand response events, and the growing awareness of climate change and the need for sustainable energy practices. Technological disruptions, including the proliferation of affordable IoT devices and the integration of artificial intelligence into energy management platforms, are making DRMS more accessible and user-friendly. Consumer behavior is shifting from passive energy consumption to active engagement, with homeowners increasingly seeking control over their energy usage and looking for ways to optimize their electricity costs. The integration of electric vehicles (EVs) and their charging infrastructure presents a significant new dimension for DRMS, enabling smart charging strategies that can align with grid demand. The global market for smart grid technologies, which underpins the DRMS ecosystem, is expected to reach over $100 billion by 2030, highlighting the broader trend benefiting residential DRMS. Furthermore, the increasing focus on grid resilience against extreme weather events and the integration of distributed energy resources (DERs) like rooftop solar are creating a compelling case for widespread DRMS adoption. The estimated market penetration for DRMS in developed economies is projected to surpass 30% by 2030, indicating substantial room for growth.
Dominant Regions, Countries, or Segments in Residential Demand Response Management Systems Market
The Automated Demand Response (ADR) segment is currently the dominant force driving growth within the Residential Demand Response Management Systems Market. This dominance is primarily attributed to its superior efficiency, scalability, and ability to seamlessly integrate with smart grid infrastructure and advanced metering systems. Regions such as North America, particularly the United States, and Europe, led by countries like Germany and the United Kingdom, are at the forefront of ADR adoption. These regions benefit from well-established smart grid initiatives, supportive regulatory environments, and a high concentration of technologically advanced households. The market share of ADR within the overall residential DRMS market is estimated to be around 70% in 2025 and is expected to expand further as conventional demand response methods become increasingly obsolete.
Key drivers contributing to the dominance of ADR include:
- Technological Superiority: ADR systems offer automated control of appliances and devices, enabling dynamic adjustments based on real-time grid signals, leading to more significant energy savings and grid benefits.
- Economic Policies and Incentives: Governments in leading regions offer substantial incentives for utilities and consumers to adopt ADR technologies, including rebates, tax credits, and performance-based payments for participation in demand response programs.
- Smart Grid Infrastructure: The widespread deployment of smart meters and advanced communication networks in these regions provides the necessary foundation for effective ADR implementation. For example, the US has over 90 million smart meters installed, facilitating real-time data exchange crucial for ADR.
- Consumer Demand for Convenience and Savings: Homeowners are increasingly seeking automated solutions that reduce their electricity bills without requiring manual intervention. ADR systems offer this convenience and demonstrable cost savings, driving higher adoption rates.
- Growing Penetration of Smart Home Devices: The proliferation of smart thermostats, smart plugs, and other connected devices directly integrates with ADR platforms, expanding the controllable load within a household.
The growth potential in these dominant regions remains substantial, driven by ongoing grid modernization efforts and the increasing need for demand-side management solutions to integrate renewable energy sources. The market share of ADR is expected to grow by an additional 10-15% over the next decade in these leading regions.
Residential Demand Response Management Systems Market Product Landscape
The Residential Demand Response Management Systems Market product landscape is characterized by innovative solutions that offer seamless integration, intelligent control, and enhanced user experience. Products range from sophisticated cloud-based platforms to integrated smart home hubs and specialized smart appliances equipped with demand response capabilities. Key innovations include AI-powered algorithms for predictive load forecasting, enabling proactive demand management and optimized energy consumption for individual households. Performance metrics are increasingly focused on quantifiable energy savings, peak load reduction percentages, and customer satisfaction scores. Unique selling propositions often revolve around ease of installation, intuitive user interfaces, and the ability to integrate with a wide array of smart devices from different manufacturers, fostering an open ecosystem. Technological advancements are also pushing towards more granular control of individual appliances, allowing for dynamic shedding of non-critical loads during peak demand periods without compromising household comfort.
Key Drivers, Barriers & Challenges in Residential Demand Response Management Systems Market
Key Drivers:
- Grid Modernization and Renewable Energy Integration: The increasing reliance on intermittent renewable sources like solar and wind necessitates flexible demand management.
- Cost Savings for Consumers: DRMS enables households to reduce their electricity bills by shifting consumption away from peak hours.
- Government Policies and Incentives: Mandates for smart meters and financial incentives for DR participation accelerate adoption.
- Technological Advancements: The proliferation of IoT devices and smart home technology creates a robust ecosystem for DRMS.
- Environmental Concerns: Growing awareness of climate change drives demand for energy-efficient solutions.
Barriers & Challenges:
- High Initial Cost of Systems: While decreasing, the upfront investment for some DRMS can still be a deterrent for some households.
- Consumer Awareness and Education: Many consumers are not fully aware of the benefits or operational aspects of DRMS.
- Cybersecurity and Data Privacy Concerns: Protecting sensitive energy consumption data is paramount and requires robust security measures.
- Interoperability and Standardization Issues: Ensuring seamless integration between devices from different manufacturers remains a challenge.
- Grid Infrastructure Limitations: In some regions, existing grid infrastructure may not be sufficiently advanced to support widespread DRMS deployment.
- Supply Chain Disruptions: Global supply chain issues can impact the availability and cost of key components for DRMS.
- Regulatory Hurdles: Inconsistent or slow-moving regulatory frameworks in certain regions can hinder market growth.
- Competitive Pressures: Competition from traditional energy providers and evolving smart home solution providers necessitates continuous innovation.
Emerging Opportunities in Residential Demand Response Management Systems Market
Emerging opportunities in the Residential Demand Response Management Systems Market lie in the seamless integration of electric vehicle (EV) charging with grid demand management, creating virtual power plants (VPPs) from aggregated residential resources, and the development of AI-driven personalized energy management plans for consumers. Untapped markets in developing economies with rapidly growing smart city initiatives and increasing disposable incomes present significant expansion potential. Innovative applications include using DRMS for grid stabilization services beyond simple load shedding, such as frequency regulation. Evolving consumer preferences are leaning towards subscription-based models for DRMS, offering lower upfront costs and ongoing service benefits. The increasing adoption of behind-the-meter storage solutions, like residential batteries, also presents a synergistic opportunity for DRMS to optimize both grid interaction and self-consumption of solar energy.
Growth Accelerators in the Residential Demand Response Management Systems Market Industry
The long-term growth of the Residential Demand Response Management Systems Market will be significantly accelerated by technological breakthroughs in energy storage, the widespread adoption of smart electric vehicles and their bidirectional charging capabilities, and enhanced predictive analytics driven by artificial intelligence. Strategic partnerships between DRMS providers, utilities, smart home device manufacturers, and EV charging companies are crucial for creating comprehensive and user-friendly energy management ecosystems. Market expansion strategies will focus on developing tailored solutions for diverse consumer segments and geographical regions, alongside robust educational campaigns to increase consumer adoption and understanding of DR benefits. The continued evolution of regulatory frameworks that explicitly support and reward demand response participation will also serve as a powerful growth catalyst.
Key Players Shaping the Residential Demand Response Management Systems Market Market
- Honeywell International Inc.
- ABB Ltd.
- Silver Spring Networks Inc.
- EnerNOC Inc.
- Hitachi Ltd.
- Siemens AG
- Alstom SA
- Schneider Electric SE
- Eaton Corporation PLC
- REGEN Energy
- General Electric Company
- Autogrid Systems Inc.
Notable Milestones in Residential Demand Response Management Systems Market Sector
- 2019: Significant growth in smart meter deployments globally, laying the groundwork for advanced DRMS.
- 2020: Increased focus on grid resilience due to extreme weather events, highlighting the importance of demand response.
- 2021: Major utilities begin to pilot and scale up residential DR programs leveraging automated technologies.
- 2022: Advancements in AI and machine learning lead to more sophisticated and personalized DRMS algorithms.
- 2023: Growing integration of electric vehicle charging with residential DRMS for smart charging solutions.
- 2024: Increased M&A activity as larger players consolidate their market presence and expand offerings.
In-Depth Residential Demand Response Management Systems Market Market Outlook
The future outlook for the Residential Demand Response Management Systems Market is exceptionally bright, fueled by a convergence of technological innovation, favorable policy environments, and increasing consumer demand for energy efficiency and cost control. Growth accelerators such as the ongoing smart grid revolution, the rapid expansion of the Internet of Things (IoT) in homes, and the imperative to integrate distributed renewable energy sources will continue to propel market expansion. Strategic opportunities include the development of comprehensive energy management platforms that encompass not only demand response but also solar generation, battery storage, and EV charging. The market is set to witness significant growth in both developed and emerging economies, driven by utilities' need for flexible grid assets and consumers' desire for greater control over their energy consumption and expenditure. The estimated market size is poised to reach impressive figures, underscoring the critical role of residential DRMS in the future energy landscape.
Residential Demand Response Management Systems Market Segmentation
-
1. Type
- 1.1. Conventional Demand Response
- 1.2. Automated Demand Response
Residential Demand Response Management Systems Market Segmentation By Geography
- 1. North America
- 2. Europe
- 3. Asia Pacific
- 4. South America
- 5. Middle East and Africa
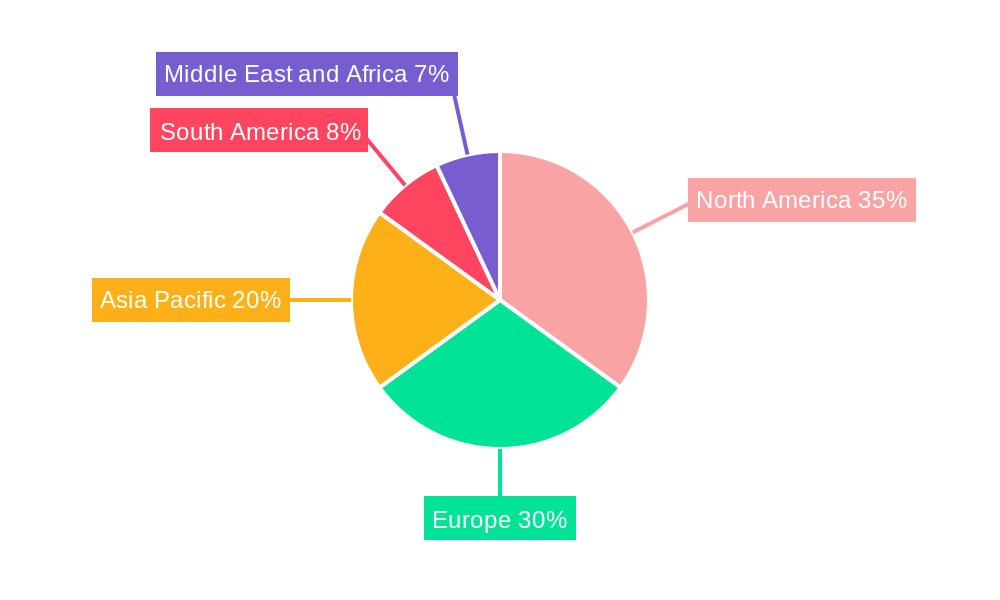
Residential Demand Response Management Systems Market Regional Market Share
Geographic Coverage of Residential Demand Response Management Systems Market
Residential Demand Response Management Systems Market REPORT HIGHLIGHTS
| Aspects | Details |
|---|---|
| Study Period | 2020-2034 |
| Base Year | 2025 |
| Estimated Year | 2026 |
| Forecast Period | 2026-2034 |
| Historical Period | 2020-2025 |
| Growth Rate | CAGR of 15.8% from 2020-2034 |
| Segmentation |
|
Table of Contents
- 1. Introduction
- 1.1. Research Scope
- 1.2. Market Segmentation
- 1.3. Research Objective
- 1.4. Definitions and Assumptions
- 2. Executive Summary
- 2.1. Market Snapshot
- 3. Market Dynamics
- 3.1. Market Drivers
- 3.2. Market Restrains
- 3.3. Market Trends
- 3.4. Market Opportunities
- 4. Market Factor Analysis
- 4.1. Porters Five Forces
- 4.1.1. Bargaining Power of Suppliers
- 4.1.2. Bargaining Power of Buyers
- 4.1.3. Threat of New Entrants
- 4.1.4. Threat of Substitutes
- 4.1.5. Competitive Rivalry
- 4.2. PESTEL analysis
- 4.3. BCG Analysis
- 4.3.1. Stars (High Growth, High Market Share)
- 4.3.2. Cash Cows (Low Growth, High Market Share)
- 4.3.3. Question Mark (High Growth, Low Market Share)
- 4.3.4. Dogs (Low Growth, Low Market Share)
- 4.4. Ansoff Matrix Analysis
- 4.5. Supply Chain Analysis
- 4.6. Regulatory Landscape
- 4.7. Current Market Potential and Opportunity Assessment (TAM–SAM–SOM Framework)
- 4.8. VDR Analyst Note
- 4.1. Porters Five Forces
- 5. Market Analysis, Insights and Forecast 2021-2033
- 5.1. Market Analysis, Insights and Forecast - by Type
- 5.1.1. Conventional Demand Response
- 5.1.2. Automated Demand Response
- 5.2. Market Analysis, Insights and Forecast - by Region
- 5.2.1. North America
- 5.2.2. Europe
- 5.2.3. Asia Pacific
- 5.2.4. South America
- 5.2.5. Middle East and Africa
- 5.1. Market Analysis, Insights and Forecast - by Type
- 6. Global Residential Demand Response Management Systems Market Analysis, Insights and Forecast, 2021-2033
- 6.1. Market Analysis, Insights and Forecast - by Type
- 6.1.1. Conventional Demand Response
- 6.1.2. Automated Demand Response
- 6.1. Market Analysis, Insights and Forecast - by Type
- 7. North America Residential Demand Response Management Systems Market Analysis, Insights and Forecast, 2021-2033
- 7.1. Market Analysis, Insights and Forecast - by Type
- 7.1.1. Conventional Demand Response
- 7.1.2. Automated Demand Response
- 7.1. Market Analysis, Insights and Forecast - by Type
- 8. Europe Residential Demand Response Management Systems Market Analysis, Insights and Forecast, 2021-2033
- 8.1. Market Analysis, Insights and Forecast - by Type
- 8.1.1. Conventional Demand Response
- 8.1.2. Automated Demand Response
- 8.1. Market Analysis, Insights and Forecast - by Type
- 9. Asia Pacific Residential Demand Response Management Systems Market Analysis, Insights and Forecast, 2021-2033
- 9.1. Market Analysis, Insights and Forecast - by Type
- 9.1.1. Conventional Demand Response
- 9.1.2. Automated Demand Response
- 9.1. Market Analysis, Insights and Forecast - by Type
- 10. South America Residential Demand Response Management Systems Market Analysis, Insights and Forecast, 2021-2033
- 10.1. Market Analysis, Insights and Forecast - by Type
- 10.1.1. Conventional Demand Response
- 10.1.2. Automated Demand Response
- 10.1. Market Analysis, Insights and Forecast - by Type
- 11. Middle East and Africa Residential Demand Response Management Systems Market Analysis, Insights and Forecast, 2021-2033
- 11.1. Market Analysis, Insights and Forecast - by Type
- 11.1.1. Conventional Demand Response
- 11.1.2. Automated Demand Response
- 11.1. Market Analysis, Insights and Forecast - by Type
- 12. Competitive Analysis
- 12.1. Company Profiles
- 12.1.1 Honeywell International Inc
- 12.1.1.1. Company Overview
- 12.1.1.2. Products
- 12.1.1.3. Company Financials
- 12.1.1.4. SWOT Analysis
- 12.1.2 ABB Ltd
- 12.1.2.1. Company Overview
- 12.1.2.2. Products
- 12.1.2.3. Company Financials
- 12.1.2.4. SWOT Analysis
- 12.1.3 Silver Spring Networks Inc
- 12.1.3.1. Company Overview
- 12.1.3.2. Products
- 12.1.3.3. Company Financials
- 12.1.3.4. SWOT Analysis
- 12.1.4 EnerNOC Inc
- 12.1.4.1. Company Overview
- 12.1.4.2. Products
- 12.1.4.3. Company Financials
- 12.1.4.4. SWOT Analysis
- 12.1.5 Hitachi Ltd
- 12.1.5.1. Company Overview
- 12.1.5.2. Products
- 12.1.5.3. Company Financials
- 12.1.5.4. SWOT Analysis
- 12.1.6 Siemens Ag
- 12.1.6.1. Company Overview
- 12.1.6.2. Products
- 12.1.6.3. Company Financials
- 12.1.6.4. SWOT Analysis
- 12.1.7 Alstom SA
- 12.1.7.1. Company Overview
- 12.1.7.2. Products
- 12.1.7.3. Company Financials
- 12.1.7.4. SWOT Analysis
- 12.1.8 Schneider Electric SE
- 12.1.8.1. Company Overview
- 12.1.8.2. Products
- 12.1.8.3. Company Financials
- 12.1.8.4. SWOT Analysis
- 12.1.9 Eaton Corporation PLC
- 12.1.9.1. Company Overview
- 12.1.9.2. Products
- 12.1.9.3. Company Financials
- 12.1.9.4. SWOT Analysis
- 12.1.10 REGEN Energy
- 12.1.10.1. Company Overview
- 12.1.10.2. Products
- 12.1.10.3. Company Financials
- 12.1.10.4. SWOT Analysis
- 12.1.11 General Electric Company
- 12.1.11.1. Company Overview
- 12.1.11.2. Products
- 12.1.11.3. Company Financials
- 12.1.11.4. SWOT Analysis
- 12.1.12 Autogrid Systems Inc
- 12.1.12.1. Company Overview
- 12.1.12.2. Products
- 12.1.12.3. Company Financials
- 12.1.12.4. SWOT Analysis
- 12.1.1 Honeywell International Inc
- 12.2. Market Entropy
- 12.2.1 Company's Key Areas Served
- 12.2.2 Recent Developments
- 12.3. Company Market Share Analysis 2025
- 12.3.1 Top 5 Companies Market Share Analysis
- 12.3.2 Top 3 Companies Market Share Analysis
- 12.4. List of Potential Customers
- 13. Research Methodology
List of Figures
- Figure 1: Global Residential Demand Response Management Systems Market Revenue Breakdown (billion, %) by Region 2025 & 2033
- Figure 2: North America Residential Demand Response Management Systems Market Revenue (billion), by Type 2025 & 2033
- Figure 3: North America Residential Demand Response Management Systems Market Revenue Share (%), by Type 2025 & 2033
- Figure 4: North America Residential Demand Response Management Systems Market Revenue (billion), by Country 2025 & 2033
- Figure 5: North America Residential Demand Response Management Systems Market Revenue Share (%), by Country 2025 & 2033
- Figure 6: Europe Residential Demand Response Management Systems Market Revenue (billion), by Type 2025 & 2033
- Figure 7: Europe Residential Demand Response Management Systems Market Revenue Share (%), by Type 2025 & 2033
- Figure 8: Europe Residential Demand Response Management Systems Market Revenue (billion), by Country 2025 & 2033
- Figure 9: Europe Residential Demand Response Management Systems Market Revenue Share (%), by Country 2025 & 2033
- Figure 10: Asia Pacific Residential Demand Response Management Systems Market Revenue (billion), by Type 2025 & 2033
- Figure 11: Asia Pacific Residential Demand Response Management Systems Market Revenue Share (%), by Type 2025 & 2033
- Figure 12: Asia Pacific Residential Demand Response Management Systems Market Revenue (billion), by Country 2025 & 2033
- Figure 13: Asia Pacific Residential Demand Response Management Systems Market Revenue Share (%), by Country 2025 & 2033
- Figure 14: South America Residential Demand Response Management Systems Market Revenue (billion), by Type 2025 & 2033
- Figure 15: South America Residential Demand Response Management Systems Market Revenue Share (%), by Type 2025 & 2033
- Figure 16: South America Residential Demand Response Management Systems Market Revenue (billion), by Country 2025 & 2033
- Figure 17: South America Residential Demand Response Management Systems Market Revenue Share (%), by Country 2025 & 2033
- Figure 18: Middle East and Africa Residential Demand Response Management Systems Market Revenue (billion), by Type 2025 & 2033
- Figure 19: Middle East and Africa Residential Demand Response Management Systems Market Revenue Share (%), by Type 2025 & 2033
- Figure 20: Middle East and Africa Residential Demand Response Management Systems Market Revenue (billion), by Country 2025 & 2033
- Figure 21: Middle East and Africa Residential Demand Response Management Systems Market Revenue Share (%), by Country 2025 & 2033
List of Tables
- Table 1: Global Residential Demand Response Management Systems Market Revenue billion Forecast, by Type 2020 & 2033
- Table 2: Global Residential Demand Response Management Systems Market Revenue billion Forecast, by Region 2020 & 2033
- Table 3: Global Residential Demand Response Management Systems Market Revenue billion Forecast, by Type 2020 & 2033
- Table 4: Global Residential Demand Response Management Systems Market Revenue billion Forecast, by Country 2020 & 2033
- Table 5: Global Residential Demand Response Management Systems Market Revenue billion Forecast, by Type 2020 & 2033
- Table 6: Global Residential Demand Response Management Systems Market Revenue billion Forecast, by Country 2020 & 2033
- Table 7: Global Residential Demand Response Management Systems Market Revenue billion Forecast, by Type 2020 & 2033
- Table 8: Global Residential Demand Response Management Systems Market Revenue billion Forecast, by Country 2020 & 2033
- Table 9: Global Residential Demand Response Management Systems Market Revenue billion Forecast, by Type 2020 & 2033
- Table 10: Global Residential Demand Response Management Systems Market Revenue billion Forecast, by Country 2020 & 2033
- Table 11: Global Residential Demand Response Management Systems Market Revenue billion Forecast, by Type 2020 & 2033
- Table 12: Global Residential Demand Response Management Systems Market Revenue billion Forecast, by Country 2020 & 2033
Frequently Asked Questions
1. What is the projected Compound Annual Growth Rate (CAGR) of the Residential Demand Response Management Systems Market?
The projected CAGR is approximately 15.8%.
2. Which companies are prominent players in the Residential Demand Response Management Systems Market?
Key companies in the market include Honeywell International Inc, ABB Ltd, Silver Spring Networks Inc, EnerNOC Inc, Hitachi Ltd, Siemens Ag, Alstom SA, Schneider Electric SE, Eaton Corporation PLC, REGEN Energy, General Electric Company, Autogrid Systems Inc.
3. What are the main segments of the Residential Demand Response Management Systems Market?
The market segments include Type.
4. Can you provide details about the market size?
The market size is estimated to be USD 60 billion as of 2022.
5. What are some drivers contributing to market growth?
4.; Need for Efficient Energy Management Systems4.; Growing Penetration of Renewable Energy Sources.
6. What are the notable trends driving market growth?
Automated Demand Response System Expected Drive the Market.
7. Are there any restraints impacting market growth?
4.; Privacy Concerns on the Industrial Demand Response Management Systems.
8. Can you provide examples of recent developments in the market?
N/A
9. What pricing options are available for accessing the report?
Pricing options include single-user, multi-user, and enterprise licenses priced at USD 4750, USD 5250, and USD 8750 respectively.
10. Is the market size provided in terms of value or volume?
The market size is provided in terms of value, measured in billion.
11. Are there any specific market keywords associated with the report?
Yes, the market keyword associated with the report is "Residential Demand Response Management Systems Market," which aids in identifying and referencing the specific market segment covered.
12. How do I determine which pricing option suits my needs best?
The pricing options vary based on user requirements and access needs. Individual users may opt for single-user licenses, while businesses requiring broader access may choose multi-user or enterprise licenses for cost-effective access to the report.
13. Are there any additional resources or data provided in the Residential Demand Response Management Systems Market report?
While the report offers comprehensive insights, it's advisable to review the specific contents or supplementary materials provided to ascertain if additional resources or data are available.
14. How can I stay updated on further developments or reports in the Residential Demand Response Management Systems Market?
To stay informed about further developments, trends, and reports in the Residential Demand Response Management Systems Market, consider subscribing to industry newsletters, following relevant companies and organizations, or regularly checking reputable industry news sources and publications.
Methodology
Step 1 - Identification of Relevant Samples Size from Population Database


Step 2 - Approaches for Defining Global Market Size (Value, Volume* & Price*)

Note*: In applicable scenarios
Step 3 - Data Sources
Primary Research
- Web Analytics
- Survey Reports
- Research Institute
- Latest Research Reports
- Opinion Leaders
Secondary Research
- Annual Reports
- White Paper
- Latest Press Release
- Industry Association
- Paid Database
- Investor Presentations

Step 4 - Data Triangulation
Involves using different sources of information in order to increase the validity of a study
These sources are likely to be stakeholders in a program - participants, other researchers, program staff, other community members, and so on.
Then we put all data in single framework & apply various statistical tools to find out the dynamic on the market.
During the analysis stage, feedback from the stakeholder groups would be compared to determine areas of agreement as well as areas of divergence