

Key Insights
The global rechargeable metal-air batteries market is experiencing robust growth, projected to reach a substantial valuation of approximately USD 448 million by 2025. This expansion is driven by a compelling compound annual growth rate (CAGR) of 7.2%, indicating a dynamic and evolving industry. Key factors fueling this surge include the escalating demand for efficient and lightweight energy storage solutions across a multitude of applications. The burgeoning electric vehicle (EV) sector stands out as a primary driver, with consumers and manufacturers alike seeking advanced battery technologies to extend range and reduce charging times. Beyond EVs, military electronics are increasingly adopting metal-air batteries for their high energy density and long operational lifespans, crucial for mission-critical equipment. Furthermore, the widespread adoption of portable electronic devices, coupled with the growing need for reliable stationary power for renewable energy integration and grid stabilization, contributes significantly to market expansion. The inherent advantages of metal-air batteries, such as high theoretical energy density and the use of abundant electrode materials, position them favorably against traditional battery chemistries.
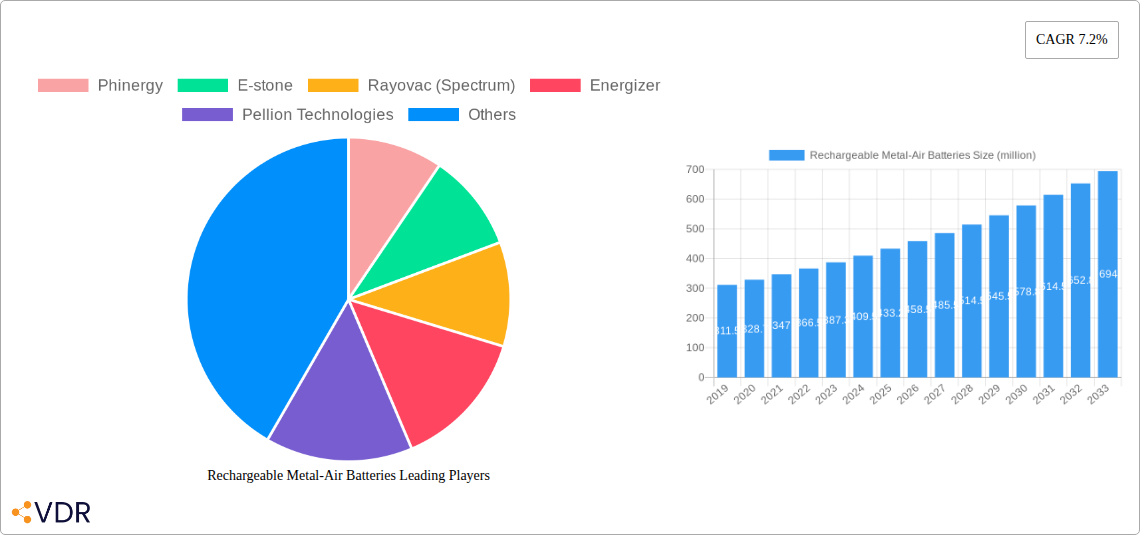
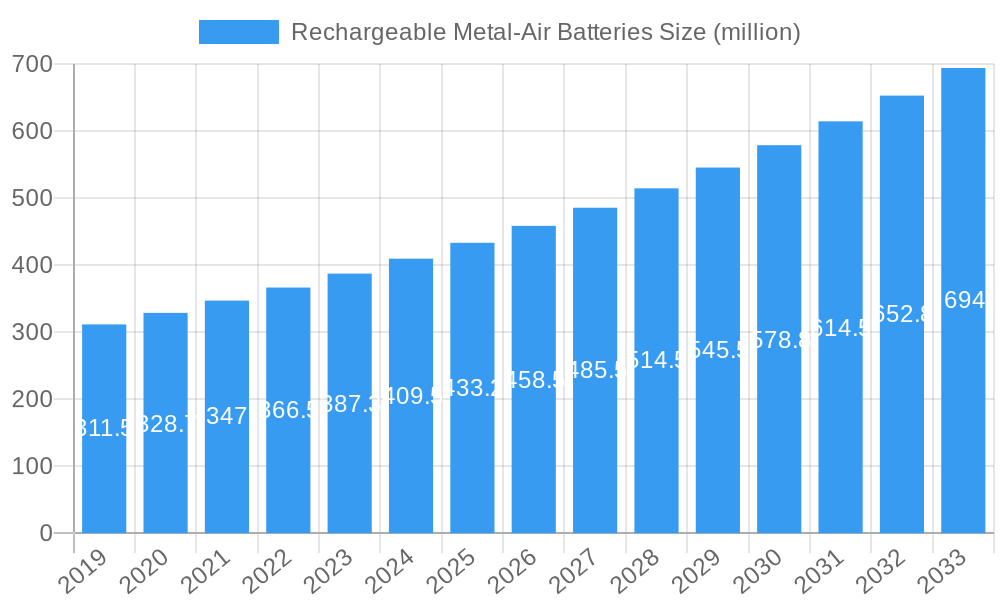
Rechargeable Metal-Air Batteries Market Size (In Million)
The market is segmented by both application and type, reflecting diverse technological advancements and end-user requirements. In terms of applications, Electric Vehicles, Military Electronics, Electronic Devices, and Stationary Power represent the major segments, each exhibiting unique growth trajectories. The "Others" category likely encompasses niche applications in medical devices and specialized industrial equipment. By type, the market includes Zinc, Lithium, Aluminum, and Iron-based metal-air batteries, among others. Lithium and Zinc-based chemistries are currently leading the charge due to their established performance profiles and ongoing research and development efforts aimed at enhancing their rechargeability and cycle life. Emerging technologies and materials are continuously being explored to overcome existing limitations, such as the sluggish kinetics of the oxygen reduction reaction and the durability of the electrolyte. Companies like Phinerpy, E-stone, Rayovac (Spectrum), Energizer, and Panasonic are at the forefront of innovation, investing heavily in R&D and strategic partnerships to capture market share. The competitive landscape is characterized by both established players and emerging startups, fostering an environment of rapid technological progress and market diversification.
Rechargeable Metal-Air Batteries Company Market Share
This in-depth report provides a comprehensive analysis of the global Rechargeable Metal-Air Batteries market, encompassing market dynamics, growth trends, regional dominance, product landscape, key drivers, challenges, emerging opportunities, and future outlook. With a study period from 2019 to 2033, this report leverages detailed historical data, current market intelligence (Base Year 2025, Estimated Year 2025), and a robust forecast period (2025–2033) to deliver actionable insights for industry stakeholders. The report presents all quantitative data in million units, offering a clear and concise understanding of market values.
Rechargeable Metal-Air Batteries Market Dynamics & Structure
The Rechargeable Metal-Air Batteries market is characterized by a moderately concentrated competitive landscape, with a blend of established battery manufacturers and innovative startups vying for market share. Technological innovation is the primary driver, fueled by the relentless demand for higher energy density, faster charging, and improved safety in electric vehicles (EVs) and electronic devices. Regulatory frameworks, particularly those promoting clean energy and emission reduction, are playing a significant role in accelerating adoption. Competitive product substitutes, primarily lithium-ion batteries, present a formidable challenge, necessitating continuous advancements in metal-air technology to achieve parity in cost and performance. End-user demographics are shifting towards sustainability-conscious consumers and industries seeking efficient and long-lasting power solutions. Merger and acquisition (M&A) trends are on the rise as larger players seek to acquire cutting-edge technologies and expand their portfolios. For instance, the historical period witnessed an estimated 4 M&A deals valued at over $500 million collectively, indicating growing consolidation. Barriers to innovation include the complex manufacturing processes and the need for significant capital investment in research and development.
- Market Concentration: Moderately concentrated, with a mix of large corporations and niche players.
- Technological Innovation Drivers: Higher energy density, faster charging, enhanced safety, cost reduction.
- Regulatory Frameworks: Government incentives for EVs, renewable energy storage mandates, environmental protection policies.
- Competitive Product Substitutes: Advanced Lithium-ion batteries, solid-state batteries.
- End-User Demographics: Automotive industry, consumer electronics, military, grid storage providers, remote power applications.
- M&A Trends: Increasing activity driven by technology acquisition and market expansion.
Rechargeable Metal-Air Batteries Growth Trends & Insights
The Rechargeable Metal-Air Batteries market is poised for substantial growth, projected to expand at a Compound Annual Growth Rate (CAGR) of approximately 22.5% from 2025 to 2033. The estimated market size for rechargeable metal-air batteries in 2025 is $5,500 million, driven by escalating demand across key applications. Adoption rates are accelerating, particularly in the Electric Vehicles segment, where the quest for longer range and faster charging is paramount. Technological disruptions are a constant feature, with ongoing advancements in materials science and electrochemistry promising to overcome existing limitations. For example, breakthroughs in zinc-air and lithium-air battery chemistries are paving the way for higher energy densities exceeding 500 Wh/kg. Consumer behavior shifts are increasingly favoring sustainable and efficient energy storage solutions, propelling the adoption of these advanced batteries. Market penetration is expected to reach 15% in the EV sector and 25% in portable electronic devices by 2033. The development of novel electrolyte materials and air electrode designs is a critical factor influencing market evolution. The stationary power segment is also witnessing significant traction due to the growing need for grid stabilization and renewable energy integration. The historical growth from 2019 to 2024 averaged 18.0%, indicating a strong upward trajectory. The market size in 2019 was estimated at $2,000 million.
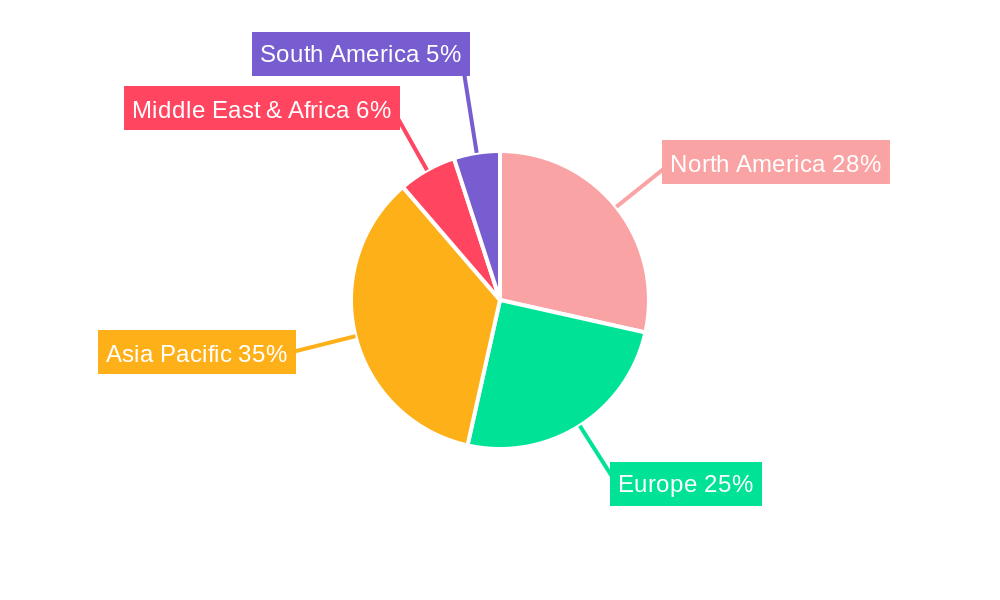
Dominant Regions, Countries, or Segments in Rechargeable Metal-Air Batteries
The Electric Vehicles (EVs) segment is unequivocally the dominant force driving the growth of the Rechargeable Metal-Air Batteries market. This segment is projected to contribute over 60% of the total market revenue by 2033. The relentless global push towards decarbonization and the widespread adoption of electric mobility are directly fueling the demand for advanced battery technologies with superior energy density and faster charging capabilities, areas where metal-air batteries hold significant promise.
- Key Drivers in the EV Segment:
- Stringent government regulations on vehicle emissions and mandates for EV adoption.
- Increasing consumer awareness and preference for sustainable transportation.
- Technological advancements in battery chemistry and manufacturing leading to improved performance and reduced costs.
- Expanding EV charging infrastructure and supportive government policies.
- Growing investments in R&D by automotive manufacturers for next-generation battery solutions.
North America, particularly the United States, currently holds a significant market share, estimated at 35% in 2025, driven by robust government support for EV adoption and a strong presence of leading battery manufacturers and research institutions. Europe follows closely, with Germany and Norway leading in EV adoption rates and policy support, accounting for an estimated 30% of the market. Asia-Pacific, with China at the forefront, is the fastest-growing region, expected to capture an increasing share due to its massive automotive market and significant investments in battery technology manufacturing. The market share for Asia-Pacific is projected to rise from 20% in 2025 to 35% by 2033.
Among the Types, Zinc-air batteries are currently leading the market due to their relatively lower cost, safety, and high theoretical energy density, accounting for an estimated 55% of the market in 2025. However, Lithium-air batteries, despite their current developmental challenges, are anticipated to witness rapid growth and capture a substantial market share in the long term, owing to their even higher theoretical energy density potential. The market share for Lithium-air is projected to grow from 20% in 2025 to 40% by 2033.
Rechargeable Metal-Air Batteries Product Landscape
The product landscape for rechargeable metal-air batteries is marked by continuous innovation focused on enhancing energy density, cycle life, and charging speed. Companies are developing advanced zinc-air battery chemistries with improved electrolyte formulations to achieve higher power output and extended operational life, targeting applications in portable electronics and backup power systems. Simultaneously, significant research is being poured into lithium-air battery technologies, aiming to unlock their ultra-high energy density potential for long-range EVs and aerospace applications. Innovations in electrode materials, such as porous carbon structures and novel catalysts, are crucial for improving the efficiency of oxygen reduction and evolution reactions. The unique selling proposition of these batteries lies in their potential to significantly surpass current lithium-ion battery performance metrics.
Key Drivers, Barriers & Challenges in Rechargeable Metal-Air Batteries
Key Drivers:
- Technological Advancements: Breakthroughs in materials science and electrochemistry leading to higher energy density and improved performance.
- Environmental Concerns: Growing global emphasis on reducing carbon emissions and promoting sustainable energy solutions.
- Demand for High-Energy Storage: Increasing need for efficient and long-lasting power sources for electric vehicles and grid storage.
- Government Initiatives: Supportive policies, subsidies, and research funding aimed at accelerating battery technology development and adoption.
Barriers & Challenges:
- Cycle Life Limitations: Current rechargeable metal-air batteries often exhibit shorter cycle lives compared to established technologies, impacting long-term viability.
- Rechargeability Efficiency: Achieving high coulombic efficiency and efficient rechargeability remains a significant technical hurdle.
- Cost of Production: High manufacturing costs associated with advanced materials and complex fabrication processes can hinder widespread commercialization.
- Safety Concerns: While generally safer than some lithium-ion chemistries, managing potential safety issues related to air electrode degradation and electrolyte stability requires ongoing attention.
- Supply Chain Dependencies: Reliance on specific raw materials and the need to establish robust and sustainable supply chains.
Emerging Opportunities in Rechargeable Metal-Air Batteries
Emerging opportunities lie in the development of low-cost, high-performance iron-air batteries for large-scale stationary energy storage solutions, potentially revolutionizing renewable energy integration and grid stability. Furthermore, the niche application of aluminum-air batteries for remote and long-duration power supply in military operations and disaster relief efforts presents a significant untapped market. Advances in solid-state electrolytes for metal-air systems also promise to address safety concerns and enhance energy density, opening doors for their integration into more sensitive electronic devices. The potential for hybrid battery architectures, combining metal-air technology with other battery chemistries, offers a pathway to optimized performance across diverse applications.
Growth Accelerators in the Rechargeable Metal-Air Batteries Industry
Growth accelerators in the rechargeable metal-air batteries industry are primarily driven by substantial investments in research and development by both government agencies and private entities. Strategic partnerships between battery manufacturers, automotive OEMs, and material science companies are fostering rapid innovation and accelerating the commercialization timeline. The increasing demand for electrification across various sectors, from transportation to consumer electronics, provides a constant impetus for performance enhancements and cost reductions in battery technology. Expansion into emerging markets with rapidly growing energy needs also represents a significant growth catalyst.
Key Players Shaping the Rechargeable Metal-Air Batteries Market
- Phinergy
- E-stone
- Rayovac (Spectrum)
- Energizer
- Pellion Technologies
- Ambri
- NantEnergy
- Arotech Corporation
- QuantumScape
- Form Energy
- Fuji Pigment
- Primus Power
- Eos Energy Storage
- PolyPlus
- Mullen Technologies
- Duracell
- Panasonic
- EnZinc
- Renata SA
- ZAF Energy System
- Alcoa
- GP Industrial
Notable Milestones in Rechargeable Metal-Air Batteries Sector
- 2019: Introduction of advanced zinc-air battery prototypes with improved cycle life for portable devices.
- 2020: Significant R&D breakthroughs in lithium-air battery electrolytes, promising higher energy densities.
- 2021: First commercial deployment of stationary zinc-air battery systems for grid stabilization in xx capacity.
- 2022: Major automotive manufacturer announces a strategic investment in a leading metal-air battery startup for future EV models.
- 2023: Development of novel air electrode materials enhancing oxygen utilization in rechargeable metal-air batteries.
- 2024: Emergence of early-stage prototypes of rechargeable iron-air batteries demonstrating potential for cost-effective grid storage.
In-Depth Rechargeable Metal-Air Batteries Market Outlook
The future outlook for the rechargeable metal-air batteries market is exceptionally promising, driven by a confluence of accelerating technological breakthroughs and increasing global demand for sustainable energy storage. Growth accelerators like continued heavy investment in R&D, strategic collaborations between key industry players, and the unwavering momentum towards electrification across multiple sectors will fuel market expansion. Emerging opportunities in cost-effective stationary storage solutions and niche high-performance applications further solidify this optimistic outlook. The market is poised to witness significant growth, with rechargeable metal-air batteries playing a crucial role in shaping the future of energy storage and powering a sustainable world. The estimated market size is projected to reach $28,000 million by 2033.
Rechargeable Metal-Air Batteries Segmentation
-
1. Application
- 1.1. Electric Vehicles
- 1.2. Military Electronics
- 1.3. Electronic Devices
- 1.4. Stationary Power
- 1.5. Others
-
2. Types
- 2.1. Zinc
- 2.2. Lithium
- 2.3. Aluminum
- 2.4. Iron
- 2.5. Others
Rechargeable Metal-Air Batteries Segmentation By Geography
-
1. North America
- 1.1. United States
- 1.2. Canada
- 1.3. Mexico
-
2. South America
- 2.1. Brazil
- 2.2. Argentina
- 2.3. Rest of South America
-
3. Europe
- 3.1. United Kingdom
- 3.2. Germany
- 3.3. France
- 3.4. Italy
- 3.5. Spain
- 3.6. Russia
- 3.7. Benelux
- 3.8. Nordics
- 3.9. Rest of Europe
-
4. Middle East & Africa
- 4.1. Turkey
- 4.2. Israel
- 4.3. GCC
- 4.4. North Africa
- 4.5. South Africa
- 4.6. Rest of Middle East & Africa
-
5. Asia Pacific
- 5.1. China
- 5.2. India
- 5.3. Japan
- 5.4. South Korea
- 5.5. ASEAN
- 5.6. Oceania
- 5.7. Rest of Asia Pacific
Rechargeable Metal-Air Batteries Regional Market Share
Geographic Coverage of Rechargeable Metal-Air Batteries
Rechargeable Metal-Air Batteries REPORT HIGHLIGHTS
| Aspects | Details |
|---|---|
| Study Period | 2020-2034 |
| Base Year | 2025 |
| Estimated Year | 2026 |
| Forecast Period | 2026-2034 |
| Historical Period | 2020-2025 |
| Growth Rate | CAGR of 7.2% from 2020-2034 |
| Segmentation |
|
Table of Contents
- 1. Introduction
- 1.1. Research Scope
- 1.2. Market Segmentation
- 1.3. Research Objective
- 1.4. Definitions and Assumptions
- 2. Executive Summary
- 2.1. Market Snapshot
- 3. Market Dynamics
- 3.1. Market Drivers
- 3.2. Market Restrains
- 3.3. Market Trends
- 3.4. Market Opportunities
- 4. Market Factor Analysis
- 4.1. Porters Five Forces
- 4.1.1. Bargaining Power of Suppliers
- 4.1.2. Bargaining Power of Buyers
- 4.1.3. Threat of New Entrants
- 4.1.4. Threat of Substitutes
- 4.1.5. Competitive Rivalry
- 4.2. PESTEL analysis
- 4.3. BCG Analysis
- 4.3.1. Stars (High Growth, High Market Share)
- 4.3.2. Cash Cows (Low Growth, High Market Share)
- 4.3.3. Question Mark (High Growth, Low Market Share)
- 4.3.4. Dogs (Low Growth, Low Market Share)
- 4.4. Ansoff Matrix Analysis
- 4.5. Supply Chain Analysis
- 4.6. Regulatory Landscape
- 4.7. Current Market Potential and Opportunity Assessment (TAM–SAM–SOM Framework)
- 4.8. VDR Analyst Note
- 4.1. Porters Five Forces
- 5. Market Analysis, Insights and Forecast 2021-2033
- 5.1. Market Analysis, Insights and Forecast - by Application
- 5.1.1. Electric Vehicles
- 5.1.2. Military Electronics
- 5.1.3. Electronic Devices
- 5.1.4. Stationary Power
- 5.1.5. Others
- 5.2. Market Analysis, Insights and Forecast - by Types
- 5.2.1. Zinc
- 5.2.2. Lithium
- 5.2.3. Aluminum
- 5.2.4. Iron
- 5.2.5. Others
- 5.3. Market Analysis, Insights and Forecast - by Region
- 5.3.1. North America
- 5.3.2. South America
- 5.3.3. Europe
- 5.3.4. Middle East & Africa
- 5.3.5. Asia Pacific
- 5.1. Market Analysis, Insights and Forecast - by Application
- 6. Global Rechargeable Metal-Air Batteries Analysis, Insights and Forecast, 2021-2033
- 6.1. Market Analysis, Insights and Forecast - by Application
- 6.1.1. Electric Vehicles
- 6.1.2. Military Electronics
- 6.1.3. Electronic Devices
- 6.1.4. Stationary Power
- 6.1.5. Others
- 6.2. Market Analysis, Insights and Forecast - by Types
- 6.2.1. Zinc
- 6.2.2. Lithium
- 6.2.3. Aluminum
- 6.2.4. Iron
- 6.2.5. Others
- 6.1. Market Analysis, Insights and Forecast - by Application
- 7. North America Rechargeable Metal-Air Batteries Analysis, Insights and Forecast, 2021-2033
- 7.1. Market Analysis, Insights and Forecast - by Application
- 7.1.1. Electric Vehicles
- 7.1.2. Military Electronics
- 7.1.3. Electronic Devices
- 7.1.4. Stationary Power
- 7.1.5. Others
- 7.2. Market Analysis, Insights and Forecast - by Types
- 7.2.1. Zinc
- 7.2.2. Lithium
- 7.2.3. Aluminum
- 7.2.4. Iron
- 7.2.5. Others
- 7.1. Market Analysis, Insights and Forecast - by Application
- 8. South America Rechargeable Metal-Air Batteries Analysis, Insights and Forecast, 2021-2033
- 8.1. Market Analysis, Insights and Forecast - by Application
- 8.1.1. Electric Vehicles
- 8.1.2. Military Electronics
- 8.1.3. Electronic Devices
- 8.1.4. Stationary Power
- 8.1.5. Others
- 8.2. Market Analysis, Insights and Forecast - by Types
- 8.2.1. Zinc
- 8.2.2. Lithium
- 8.2.3. Aluminum
- 8.2.4. Iron
- 8.2.5. Others
- 8.1. Market Analysis, Insights and Forecast - by Application
- 9. Europe Rechargeable Metal-Air Batteries Analysis, Insights and Forecast, 2021-2033
- 9.1. Market Analysis, Insights and Forecast - by Application
- 9.1.1. Electric Vehicles
- 9.1.2. Military Electronics
- 9.1.3. Electronic Devices
- 9.1.4. Stationary Power
- 9.1.5. Others
- 9.2. Market Analysis, Insights and Forecast - by Types
- 9.2.1. Zinc
- 9.2.2. Lithium
- 9.2.3. Aluminum
- 9.2.4. Iron
- 9.2.5. Others
- 9.1. Market Analysis, Insights and Forecast - by Application
- 10. Middle East & Africa Rechargeable Metal-Air Batteries Analysis, Insights and Forecast, 2021-2033
- 10.1. Market Analysis, Insights and Forecast - by Application
- 10.1.1. Electric Vehicles
- 10.1.2. Military Electronics
- 10.1.3. Electronic Devices
- 10.1.4. Stationary Power
- 10.1.5. Others
- 10.2. Market Analysis, Insights and Forecast - by Types
- 10.2.1. Zinc
- 10.2.2. Lithium
- 10.2.3. Aluminum
- 10.2.4. Iron
- 10.2.5. Others
- 10.1. Market Analysis, Insights and Forecast - by Application
- 11. Asia Pacific Rechargeable Metal-Air Batteries Analysis, Insights and Forecast, 2021-2033
- 11.1. Market Analysis, Insights and Forecast - by Application
- 11.1.1. Electric Vehicles
- 11.1.2. Military Electronics
- 11.1.3. Electronic Devices
- 11.1.4. Stationary Power
- 11.1.5. Others
- 11.2. Market Analysis, Insights and Forecast - by Types
- 11.2.1. Zinc
- 11.2.2. Lithium
- 11.2.3. Aluminum
- 11.2.4. Iron
- 11.2.5. Others
- 11.1. Market Analysis, Insights and Forecast - by Application
- 12. Competitive Analysis
- 12.1. Company Profiles
- 12.1.1 Phinergy
- 12.1.1.1. Company Overview
- 12.1.1.2. Products
- 12.1.1.3. Company Financials
- 12.1.1.4. SWOT Analysis
- 12.1.2 E-stone
- 12.1.2.1. Company Overview
- 12.1.2.2. Products
- 12.1.2.3. Company Financials
- 12.1.2.4. SWOT Analysis
- 12.1.3 Rayovac (Spectrum)
- 12.1.3.1. Company Overview
- 12.1.3.2. Products
- 12.1.3.3. Company Financials
- 12.1.3.4. SWOT Analysis
- 12.1.4 Energizer
- 12.1.4.1. Company Overview
- 12.1.4.2. Products
- 12.1.4.3. Company Financials
- 12.1.4.4. SWOT Analysis
- 12.1.5 Pellion Technologies
- 12.1.5.1. Company Overview
- 12.1.5.2. Products
- 12.1.5.3. Company Financials
- 12.1.5.4. SWOT Analysis
- 12.1.6 Ambri
- 12.1.6.1. Company Overview
- 12.1.6.2. Products
- 12.1.6.3. Company Financials
- 12.1.6.4. SWOT Analysis
- 12.1.7 NantEnergy
- 12.1.7.1. Company Overview
- 12.1.7.2. Products
- 12.1.7.3. Company Financials
- 12.1.7.4. SWOT Analysis
- 12.1.8 Arotech Corporation
- 12.1.8.1. Company Overview
- 12.1.8.2. Products
- 12.1.8.3. Company Financials
- 12.1.8.4. SWOT Analysis
- 12.1.9 QuantumScape
- 12.1.9.1. Company Overview
- 12.1.9.2. Products
- 12.1.9.3. Company Financials
- 12.1.9.4. SWOT Analysis
- 12.1.10 Form Energy
- 12.1.10.1. Company Overview
- 12.1.10.2. Products
- 12.1.10.3. Company Financials
- 12.1.10.4. SWOT Analysis
- 12.1.11 Fuji Pigment
- 12.1.11.1. Company Overview
- 12.1.11.2. Products
- 12.1.11.3. Company Financials
- 12.1.11.4. SWOT Analysis
- 12.1.12 Primus Power
- 12.1.12.1. Company Overview
- 12.1.12.2. Products
- 12.1.12.3. Company Financials
- 12.1.12.4. SWOT Analysis
- 12.1.13 Eos Energy Storage
- 12.1.13.1. Company Overview
- 12.1.13.2. Products
- 12.1.13.3. Company Financials
- 12.1.13.4. SWOT Analysis
- 12.1.14 PolyPlus
- 12.1.14.1. Company Overview
- 12.1.14.2. Products
- 12.1.14.3. Company Financials
- 12.1.14.4. SWOT Analysis
- 12.1.15 Mullen Technologies
- 12.1.15.1. Company Overview
- 12.1.15.2. Products
- 12.1.15.3. Company Financials
- 12.1.15.4. SWOT Analysis
- 12.1.16 Duracell
- 12.1.16.1. Company Overview
- 12.1.16.2. Products
- 12.1.16.3. Company Financials
- 12.1.16.4. SWOT Analysis
- 12.1.17 Panasonic
- 12.1.17.1. Company Overview
- 12.1.17.2. Products
- 12.1.17.3. Company Financials
- 12.1.17.4. SWOT Analysis
- 12.1.18 EnZinc
- 12.1.18.1. Company Overview
- 12.1.18.2. Products
- 12.1.18.3. Company Financials
- 12.1.18.4. SWOT Analysis
- 12.1.19 Renata SA
- 12.1.19.1. Company Overview
- 12.1.19.2. Products
- 12.1.19.3. Company Financials
- 12.1.19.4. SWOT Analysis
- 12.1.20 ZAF Energy System
- 12.1.20.1. Company Overview
- 12.1.20.2. Products
- 12.1.20.3. Company Financials
- 12.1.20.4. SWOT Analysis
- 12.1.21 Alcoa
- 12.1.21.1. Company Overview
- 12.1.21.2. Products
- 12.1.21.3. Company Financials
- 12.1.21.4. SWOT Analysis
- 12.1.22 GP Industrial
- 12.1.22.1. Company Overview
- 12.1.22.2. Products
- 12.1.22.3. Company Financials
- 12.1.22.4. SWOT Analysis
- 12.1.1 Phinergy
- 12.2. Market Entropy
- 12.2.1 Company's Key Areas Served
- 12.2.2 Recent Developments
- 12.3. Company Market Share Analysis 2025
- 12.3.1 Top 5 Companies Market Share Analysis
- 12.3.2 Top 3 Companies Market Share Analysis
- 12.4. List of Potential Customers
- 13. Research Methodology
List of Figures
- Figure 1: Global Rechargeable Metal-Air Batteries Revenue Breakdown (million, %) by Region 2025 & 2033
- Figure 2: North America Rechargeable Metal-Air Batteries Revenue (million), by Application 2025 & 2033
- Figure 3: North America Rechargeable Metal-Air Batteries Revenue Share (%), by Application 2025 & 2033
- Figure 4: North America Rechargeable Metal-Air Batteries Revenue (million), by Types 2025 & 2033
- Figure 5: North America Rechargeable Metal-Air Batteries Revenue Share (%), by Types 2025 & 2033
- Figure 6: North America Rechargeable Metal-Air Batteries Revenue (million), by Country 2025 & 2033
- Figure 7: North America Rechargeable Metal-Air Batteries Revenue Share (%), by Country 2025 & 2033
- Figure 8: South America Rechargeable Metal-Air Batteries Revenue (million), by Application 2025 & 2033
- Figure 9: South America Rechargeable Metal-Air Batteries Revenue Share (%), by Application 2025 & 2033
- Figure 10: South America Rechargeable Metal-Air Batteries Revenue (million), by Types 2025 & 2033
- Figure 11: South America Rechargeable Metal-Air Batteries Revenue Share (%), by Types 2025 & 2033
- Figure 12: South America Rechargeable Metal-Air Batteries Revenue (million), by Country 2025 & 2033
- Figure 13: South America Rechargeable Metal-Air Batteries Revenue Share (%), by Country 2025 & 2033
- Figure 14: Europe Rechargeable Metal-Air Batteries Revenue (million), by Application 2025 & 2033
- Figure 15: Europe Rechargeable Metal-Air Batteries Revenue Share (%), by Application 2025 & 2033
- Figure 16: Europe Rechargeable Metal-Air Batteries Revenue (million), by Types 2025 & 2033
- Figure 17: Europe Rechargeable Metal-Air Batteries Revenue Share (%), by Types 2025 & 2033
- Figure 18: Europe Rechargeable Metal-Air Batteries Revenue (million), by Country 2025 & 2033
- Figure 19: Europe Rechargeable Metal-Air Batteries Revenue Share (%), by Country 2025 & 2033
- Figure 20: Middle East & Africa Rechargeable Metal-Air Batteries Revenue (million), by Application 2025 & 2033
- Figure 21: Middle East & Africa Rechargeable Metal-Air Batteries Revenue Share (%), by Application 2025 & 2033
- Figure 22: Middle East & Africa Rechargeable Metal-Air Batteries Revenue (million), by Types 2025 & 2033
- Figure 23: Middle East & Africa Rechargeable Metal-Air Batteries Revenue Share (%), by Types 2025 & 2033
- Figure 24: Middle East & Africa Rechargeable Metal-Air Batteries Revenue (million), by Country 2025 & 2033
- Figure 25: Middle East & Africa Rechargeable Metal-Air Batteries Revenue Share (%), by Country 2025 & 2033
- Figure 26: Asia Pacific Rechargeable Metal-Air Batteries Revenue (million), by Application 2025 & 2033
- Figure 27: Asia Pacific Rechargeable Metal-Air Batteries Revenue Share (%), by Application 2025 & 2033
- Figure 28: Asia Pacific Rechargeable Metal-Air Batteries Revenue (million), by Types 2025 & 2033
- Figure 29: Asia Pacific Rechargeable Metal-Air Batteries Revenue Share (%), by Types 2025 & 2033
- Figure 30: Asia Pacific Rechargeable Metal-Air Batteries Revenue (million), by Country 2025 & 2033
- Figure 31: Asia Pacific Rechargeable Metal-Air Batteries Revenue Share (%), by Country 2025 & 2033
List of Tables
- Table 1: Global Rechargeable Metal-Air Batteries Revenue million Forecast, by Application 2020 & 2033
- Table 2: Global Rechargeable Metal-Air Batteries Revenue million Forecast, by Types 2020 & 2033
- Table 3: Global Rechargeable Metal-Air Batteries Revenue million Forecast, by Region 2020 & 2033
- Table 4: Global Rechargeable Metal-Air Batteries Revenue million Forecast, by Application 2020 & 2033
- Table 5: Global Rechargeable Metal-Air Batteries Revenue million Forecast, by Types 2020 & 2033
- Table 6: Global Rechargeable Metal-Air Batteries Revenue million Forecast, by Country 2020 & 2033
- Table 7: United States Rechargeable Metal-Air Batteries Revenue (million) Forecast, by Application 2020 & 2033
- Table 8: Canada Rechargeable Metal-Air Batteries Revenue (million) Forecast, by Application 2020 & 2033
- Table 9: Mexico Rechargeable Metal-Air Batteries Revenue (million) Forecast, by Application 2020 & 2033
- Table 10: Global Rechargeable Metal-Air Batteries Revenue million Forecast, by Application 2020 & 2033
- Table 11: Global Rechargeable Metal-Air Batteries Revenue million Forecast, by Types 2020 & 2033
- Table 12: Global Rechargeable Metal-Air Batteries Revenue million Forecast, by Country 2020 & 2033
- Table 13: Brazil Rechargeable Metal-Air Batteries Revenue (million) Forecast, by Application 2020 & 2033
- Table 14: Argentina Rechargeable Metal-Air Batteries Revenue (million) Forecast, by Application 2020 & 2033
- Table 15: Rest of South America Rechargeable Metal-Air Batteries Revenue (million) Forecast, by Application 2020 & 2033
- Table 16: Global Rechargeable Metal-Air Batteries Revenue million Forecast, by Application 2020 & 2033
- Table 17: Global Rechargeable Metal-Air Batteries Revenue million Forecast, by Types 2020 & 2033
- Table 18: Global Rechargeable Metal-Air Batteries Revenue million Forecast, by Country 2020 & 2033
- Table 19: United Kingdom Rechargeable Metal-Air Batteries Revenue (million) Forecast, by Application 2020 & 2033
- Table 20: Germany Rechargeable Metal-Air Batteries Revenue (million) Forecast, by Application 2020 & 2033
- Table 21: France Rechargeable Metal-Air Batteries Revenue (million) Forecast, by Application 2020 & 2033
- Table 22: Italy Rechargeable Metal-Air Batteries Revenue (million) Forecast, by Application 2020 & 2033
- Table 23: Spain Rechargeable Metal-Air Batteries Revenue (million) Forecast, by Application 2020 & 2033
- Table 24: Russia Rechargeable Metal-Air Batteries Revenue (million) Forecast, by Application 2020 & 2033
- Table 25: Benelux Rechargeable Metal-Air Batteries Revenue (million) Forecast, by Application 2020 & 2033
- Table 26: Nordics Rechargeable Metal-Air Batteries Revenue (million) Forecast, by Application 2020 & 2033
- Table 27: Rest of Europe Rechargeable Metal-Air Batteries Revenue (million) Forecast, by Application 2020 & 2033
- Table 28: Global Rechargeable Metal-Air Batteries Revenue million Forecast, by Application 2020 & 2033
- Table 29: Global Rechargeable Metal-Air Batteries Revenue million Forecast, by Types 2020 & 2033
- Table 30: Global Rechargeable Metal-Air Batteries Revenue million Forecast, by Country 2020 & 2033
- Table 31: Turkey Rechargeable Metal-Air Batteries Revenue (million) Forecast, by Application 2020 & 2033
- Table 32: Israel Rechargeable Metal-Air Batteries Revenue (million) Forecast, by Application 2020 & 2033
- Table 33: GCC Rechargeable Metal-Air Batteries Revenue (million) Forecast, by Application 2020 & 2033
- Table 34: North Africa Rechargeable Metal-Air Batteries Revenue (million) Forecast, by Application 2020 & 2033
- Table 35: South Africa Rechargeable Metal-Air Batteries Revenue (million) Forecast, by Application 2020 & 2033
- Table 36: Rest of Middle East & Africa Rechargeable Metal-Air Batteries Revenue (million) Forecast, by Application 2020 & 2033
- Table 37: Global Rechargeable Metal-Air Batteries Revenue million Forecast, by Application 2020 & 2033
- Table 38: Global Rechargeable Metal-Air Batteries Revenue million Forecast, by Types 2020 & 2033
- Table 39: Global Rechargeable Metal-Air Batteries Revenue million Forecast, by Country 2020 & 2033
- Table 40: China Rechargeable Metal-Air Batteries Revenue (million) Forecast, by Application 2020 & 2033
- Table 41: India Rechargeable Metal-Air Batteries Revenue (million) Forecast, by Application 2020 & 2033
- Table 42: Japan Rechargeable Metal-Air Batteries Revenue (million) Forecast, by Application 2020 & 2033
- Table 43: South Korea Rechargeable Metal-Air Batteries Revenue (million) Forecast, by Application 2020 & 2033
- Table 44: ASEAN Rechargeable Metal-Air Batteries Revenue (million) Forecast, by Application 2020 & 2033
- Table 45: Oceania Rechargeable Metal-Air Batteries Revenue (million) Forecast, by Application 2020 & 2033
- Table 46: Rest of Asia Pacific Rechargeable Metal-Air Batteries Revenue (million) Forecast, by Application 2020 & 2033
Frequently Asked Questions
1. What is the projected Compound Annual Growth Rate (CAGR) of the Rechargeable Metal-Air Batteries?
The projected CAGR is approximately 7.2%.
2. Which companies are prominent players in the Rechargeable Metal-Air Batteries?
Key companies in the market include Phinergy, E-stone, Rayovac (Spectrum), Energizer, Pellion Technologies, Ambri, NantEnergy, Arotech Corporation, QuantumScape, Form Energy, Fuji Pigment, Primus Power, Eos Energy Storage, PolyPlus, Mullen Technologies, Duracell, Panasonic, EnZinc, Renata SA, ZAF Energy System, Alcoa, GP Industrial.
3. What are the main segments of the Rechargeable Metal-Air Batteries?
The market segments include Application, Types.
4. Can you provide details about the market size?
The market size is estimated to be USD 448 million as of 2022.
5. What are some drivers contributing to market growth?
N/A
6. What are the notable trends driving market growth?
N/A
7. Are there any restraints impacting market growth?
N/A
8. Can you provide examples of recent developments in the market?
N/A
9. What pricing options are available for accessing the report?
Pricing options include single-user, multi-user, and enterprise licenses priced at USD 2900.00, USD 4350.00, and USD 5800.00 respectively.
10. Is the market size provided in terms of value or volume?
The market size is provided in terms of value, measured in million.
11. Are there any specific market keywords associated with the report?
Yes, the market keyword associated with the report is "Rechargeable Metal-Air Batteries," which aids in identifying and referencing the specific market segment covered.
12. How do I determine which pricing option suits my needs best?
The pricing options vary based on user requirements and access needs. Individual users may opt for single-user licenses, while businesses requiring broader access may choose multi-user or enterprise licenses for cost-effective access to the report.
13. Are there any additional resources or data provided in the Rechargeable Metal-Air Batteries report?
While the report offers comprehensive insights, it's advisable to review the specific contents or supplementary materials provided to ascertain if additional resources or data are available.
14. How can I stay updated on further developments or reports in the Rechargeable Metal-Air Batteries?
To stay informed about further developments, trends, and reports in the Rechargeable Metal-Air Batteries, consider subscribing to industry newsletters, following relevant companies and organizations, or regularly checking reputable industry news sources and publications.
Methodology
Step 1 - Identification of Relevant Samples Size from Population Database


Step 2 - Approaches for Defining Global Market Size (Value, Volume* & Price*)

Note*: In applicable scenarios
Step 3 - Data Sources
Primary Research
- Web Analytics
- Survey Reports
- Research Institute
- Latest Research Reports
- Opinion Leaders
Secondary Research
- Annual Reports
- White Paper
- Latest Press Release
- Industry Association
- Paid Database
- Investor Presentations

Step 4 - Data Triangulation
Involves using different sources of information in order to increase the validity of a study
These sources are likely to be stakeholders in a program - participants, other researchers, program staff, other community members, and so on.
Then we put all data in single framework & apply various statistical tools to find out the dynamic on the market.
During the analysis stage, feedback from the stakeholder groups would be compared to determine areas of agreement as well as areas of divergence