
Key Insights
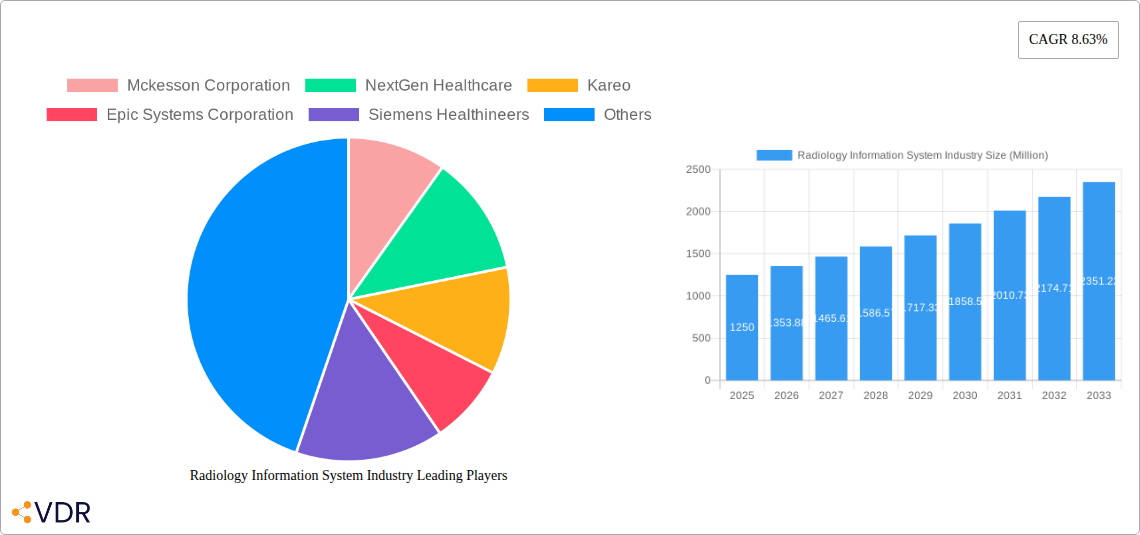
The Radiology Information System (RIS) market is experiencing robust growth, projected to reach a value of $1.25 billion in 2025 and maintain a Compound Annual Growth Rate (CAGR) of 8.63% from 2025 to 2033. This expansion is fueled by several key factors. The increasing adoption of electronic health records (EHRs) and the growing need for efficient workflow management within radiology departments are primary drivers. Furthermore, the rising prevalence of chronic diseases requiring frequent radiological examinations and a consequent surge in the volume of medical images contribute significantly to market growth. The shift towards cloud-based RIS solutions, offering scalability, cost-effectiveness, and improved accessibility, is a prominent trend. However, the market faces challenges such as high implementation costs, the need for robust data security measures, and the integration complexities associated with existing legacy systems. The segmentation of the market reveals a strong preference for integrated RIS systems over standalone solutions, driven by the need for seamless data exchange across different medical imaging modalities. The cloud-based deployment model is rapidly gaining traction due to its inherent advantages, while software components dominate the market share. North America currently holds a significant market share, owing to the advanced healthcare infrastructure and increased adoption of sophisticated technological solutions. However, Asia-Pacific is projected to witness substantial growth in the coming years, propelled by the expanding healthcare sector and increasing investments in healthcare IT.
The competitive landscape is characterized by the presence of both established players and emerging companies. Major vendors, including McKesson Corporation, Siemens Healthineers, GE Healthcare, and Epic Systems Corporation, are leveraging their existing market presence and technological expertise to maintain their leadership positions. These companies are focusing on strategic partnerships, product innovations, and acquisitions to solidify their market share. Smaller companies are concentrating on niche market segments and offering specialized solutions to compete effectively. Future growth is anticipated to be driven by further technological advancements, such as artificial intelligence (AI)-powered image analysis and improved interoperability, further boosting the efficiency and effectiveness of radiology departments globally. The focus on improving patient care through streamlined workflows and enhanced image management will continue to drive demand for sophisticated RIS solutions in the years to come.
Radiology Information System (RIS) Market Report: 2019-2033
This comprehensive report provides an in-depth analysis of the Radiology Information System (RIS) industry, encompassing market dynamics, growth trends, regional segmentation, product landscape, key players, and future outlook. The report covers the period 2019-2033, with a focus on the 2025-2033 forecast period. The market is segmented by type (Integrated RIS, Stand-alone RIS), deployment mode (On-premise, Cloud-based), and component (Hardware, Software, Services). The report's findings are invaluable for industry professionals, investors, and strategic decision-makers seeking a thorough understanding of this evolving market. The total market size is projected to reach xx Million by 2033.
Radiology Information System Industry Market Dynamics & Structure
The Radiology Information System (RIS) market is characterized by a moderately concentrated landscape, with key players like McKesson Corporation, Siemens Healthineers, and GE Healthcare holding significant market share. Technological innovation, particularly in artificial intelligence (AI) and cloud computing, is a major driver, while regulatory compliance (e.g., HIPAA) and data security are crucial considerations. The market experiences competitive pressure from alternative solutions, such as standalone PACS systems, but RIS solutions continue to be essential for streamlined workflow and image management. The end-user demographic primarily consists of hospitals, imaging centers, and radiology practices, with a growing adoption among smaller clinics. M&A activity has been moderate in recent years, with strategic acquisitions aimed at expanding product portfolios and market reach. Deal volumes averaged approximately xx per year during the historical period.
- Market Concentration: Moderately concentrated, with top 5 players accounting for approximately xx% market share.
- Technological Innovation: AI-powered image analysis, cloud-based deployments, and improved interoperability are key drivers.
- Regulatory Framework: HIPAA compliance and data security regulations significantly impact market dynamics.
- Competitive Substitutes: Standalone PACS systems and other image management solutions pose competitive pressure.
- End-User Demographics: Hospitals, imaging centers, and radiology practices constitute the primary end-users.
- M&A Trends: Moderate M&A activity, with acquisitions focused on expanding product offerings and geographical reach.
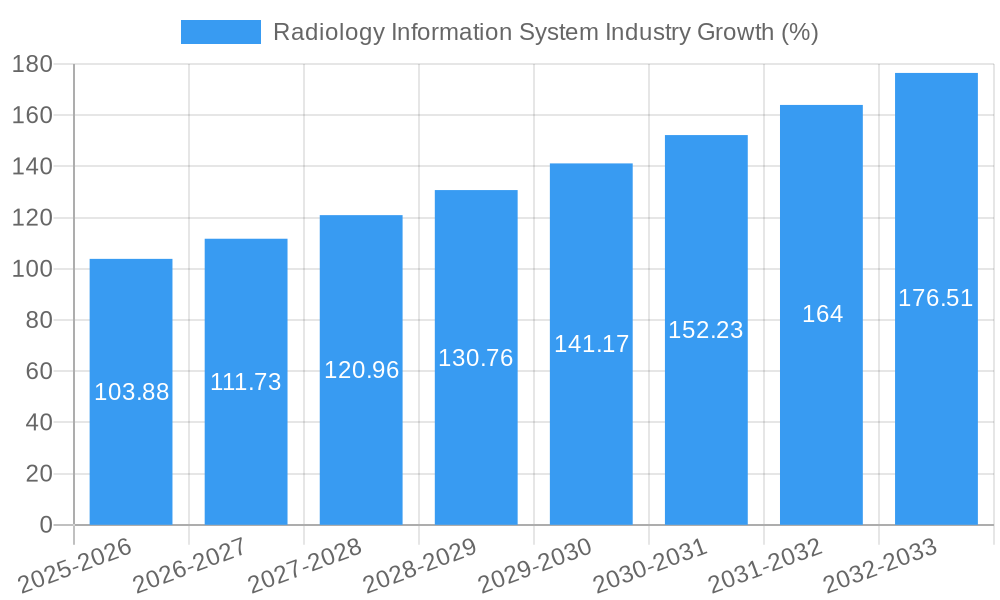
Radiology Information System Industry Growth Trends & Insights
The Radiology Information System market witnessed steady growth during the historical period (2019-2024), fueled by rising healthcare expenditure, increasing prevalence of chronic diseases necessitating advanced imaging techniques, and a growing preference for efficient workflow management solutions. The market is expected to continue its growth trajectory throughout the forecast period (2025-2033), with a projected Compound Annual Growth Rate (CAGR) of xx%. This growth is attributable to several factors, including the increasing adoption of cloud-based RIS systems, advancements in AI-powered diagnostic tools, and the growing demand for enhanced interoperability with other healthcare IT systems. Consumer behavior shifts towards more technologically advanced and patient-centric solutions are also impacting market growth. The market penetration of RIS systems is expected to reach xx% by 2033.
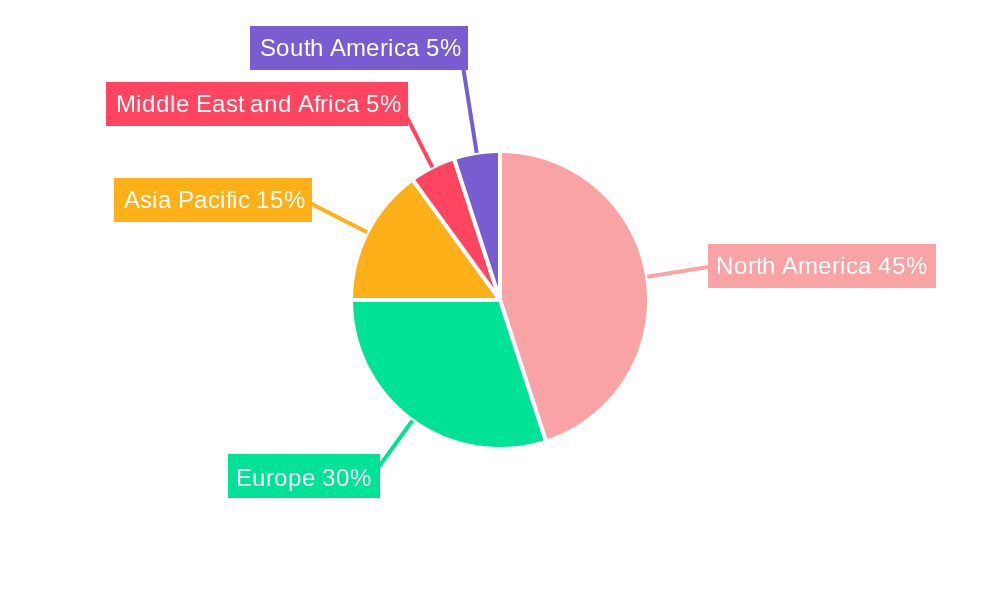
Dominant Regions, Countries, or Segments in Radiology Information System Industry
North America currently holds the largest market share in the RIS industry, driven by high healthcare expenditure, advanced technological infrastructure, and strong adoption rates among hospitals and imaging centers. However, the Asia-Pacific region is expected to exhibit the highest growth rate during the forecast period, fueled by rising healthcare infrastructure investments and increasing awareness regarding advanced medical imaging technologies.
- By Type: The Integrated RIS segment is currently dominant due to its comprehensive capabilities, but the stand-alone RIS segment is expected to show significant growth due to increasing demand for specialized solutions.
- By Deployment Mode: Cloud-based deployments are experiencing rapid adoption due to their scalability, cost-effectiveness, and accessibility.
- By Component: The software component holds the largest market share, followed by services and hardware.
- Key Drivers: Increased healthcare spending, technological advancements, favorable government regulations, and rising prevalence of chronic diseases are driving regional growth.
Radiology Information System Industry Product Landscape
The RIS market offers a range of solutions, from basic image management systems to highly integrated platforms with advanced features like AI-powered image analysis, voice recognition, and sophisticated reporting capabilities. Innovations focus on improving workflow efficiency, enhancing diagnostic accuracy, and improving interoperability with other healthcare IT systems. Key selling propositions include streamlined processes, reduced operational costs, improved patient care, and enhanced data security.
Key Drivers, Barriers & Challenges in Radiology Information System Industry
Key Drivers:
- Increasing demand for efficient workflow management in radiology departments.
- Growing adoption of cloud-based solutions for improved scalability and accessibility.
- Advancements in AI-powered image analysis and diagnostic tools.
- Stringent regulatory requirements emphasizing data security and interoperability.
Key Challenges:
- High initial investment costs for implementing RIS systems, particularly for smaller healthcare providers.
- Integration complexities with existing healthcare IT infrastructure.
- Concerns surrounding data security and patient privacy.
- Competition from alternative imaging management solutions.
Emerging Opportunities in Radiology Information System Industry
- Expansion into untapped markets in developing economies.
- Integration of AI and machine learning for improved diagnostic accuracy and efficiency.
- Development of mobile and cloud-based solutions for remote access and telehealth applications.
- Growing adoption of RIS systems in specialized radiology settings, such as cardiac or neuro radiology.
Growth Accelerators in the Radiology Information System Industry
Technological advancements, particularly in AI and machine learning, are major growth catalysts. Strategic partnerships between RIS vendors and healthcare IT companies are facilitating seamless integration and interoperability. Expansion into emerging markets, coupled with tailored solutions for specific segments, will further accelerate market growth.
Key Players Shaping the Radiology Information System Industry Market
- McKesson Corporation
- NextGen Healthcare
- Kareo
- Epic Systems Corporation
- Siemens Healthineers
- GE Healthcare
- Varian Medical Systems Inc
- IBM (Merge Healthcare Incorporated)
- Cerner Corporation
- Koninklijke Philips NV
- Medinformatix Inc
- Allscripts Healthcare Solutions Inc
- patientNOW Inc
- Konica Minolta Healthcare Americas Inc
- Practice Fusion
Notable Milestones in Radiology Information System Industry Sector
- March 2022: Intelerad Medical Systems launched the Enterprise Imaging and Informatics Suite at HIMSS22, offering a new option for medical image management.
- February 2022: Carestream Health India launched the DRX Compass, a digital radiology solution enhancing radiologist efficiency.
In-Depth Radiology Information System Industry Market Outlook
The RIS market is poised for significant growth, driven by continuous technological advancements, increasing demand for efficient healthcare solutions, and expanding adoption in emerging markets. Strategic investments in AI, cloud computing, and interoperability will shape the future of the industry, presenting substantial opportunities for market players to innovate and expand their market share. The long-term outlook is positive, with a sustained growth trajectory expected throughout the forecast period.
Radiology Information System Industry Segmentation
-
1. Type
- 1.1. Integrated Radiology Information System
- 1.2. Stand-alone Radiology Information System
-
2. Deployment Mode
- 2.1. On-premise
- 2.2. Cloud-based
-
3. Component
- 3.1. Hardware
- 3.2. Software
- 3.3. Services
Radiology Information System Industry Segmentation By Geography
-
1. North America
- 1.1. United States
- 1.2. Canada
- 1.3. Mexico
-
2. Europe
- 2.1. Germany
- 2.2. United Kingdom
- 2.3. France
- 2.4. Italy
- 2.5. Spain
- 2.6. Rest of Europe
-
3. Asia Pacific
- 3.1. China
- 3.2. Japan
- 3.3. India
- 3.4. Australia
- 3.5. South Korea
- 3.6. Rest of Asia Pacific
-
4. Middle East and Africa
- 4.1. GCC
- 4.2. South Africa
- 4.3. Rest of Middle East and Africa
-
5. South America
- 5.1. Brazil
- 5.2. Argentina
- 5.3. Rest of South America
Radiology Information System Industry REPORT HIGHLIGHTS
| Aspects | Details |
|---|---|
| Study Period | 2019-2033 |
| Base Year | 2024 |
| Estimated Year | 2025 |
| Forecast Period | 2025-2033 |
| Historical Period | 2019-2024 |
| Growth Rate | CAGR of 8.63% from 2019-2033 |
| Segmentation |
|
Table of Contents
- 1. Introduction
- 1.1. Research Scope
- 1.2. Market Segmentation
- 1.3. Research Methodology
- 1.4. Definitions and Assumptions
- 2. Executive Summary
- 2.1. Introduction
- 3. Market Dynamics
- 3.1. Introduction
- 3.2. Market Drivers
- 3.2.1. Improved Healthcare Information Technology Systems; Growth in the Incidence Rate of Chronic Diseases; Increase in Government Funding for Cancer-related Research
- 3.3. Market Restrains
- 3.3.1. High Cost of the Installation; Scarcity of Skilled Labor
- 3.4. Market Trends
- 3.4.1. The Cloud-based Segment is Expected to Witness High Growth over the Forecast Period
- 4. Market Factor Analysis
- 4.1. Porters Five Forces
- 4.2. Supply/Value Chain
- 4.3. PESTEL analysis
- 4.4. Market Entropy
- 4.5. Patent/Trademark Analysis
- 5. Global Radiology Information System Industry Analysis, Insights and Forecast, 2019-2031
- 5.1. Market Analysis, Insights and Forecast - by Type
- 5.1.1. Integrated Radiology Information System
- 5.1.2. Stand-alone Radiology Information System
- 5.2. Market Analysis, Insights and Forecast - by Deployment Mode
- 5.2.1. On-premise
- 5.2.2. Cloud-based
- 5.3. Market Analysis, Insights and Forecast - by Component
- 5.3.1. Hardware
- 5.3.2. Software
- 5.3.3. Services
- 5.4. Market Analysis, Insights and Forecast - by Region
- 5.4.1. North America
- 5.4.2. Europe
- 5.4.3. Asia Pacific
- 5.4.4. Middle East and Africa
- 5.4.5. South America
- 5.1. Market Analysis, Insights and Forecast - by Type
- 6. North America Radiology Information System Industry Analysis, Insights and Forecast, 2019-2031
- 6.1. Market Analysis, Insights and Forecast - by Type
- 6.1.1. Integrated Radiology Information System
- 6.1.2. Stand-alone Radiology Information System
- 6.2. Market Analysis, Insights and Forecast - by Deployment Mode
- 6.2.1. On-premise
- 6.2.2. Cloud-based
- 6.3. Market Analysis, Insights and Forecast - by Component
- 6.3.1. Hardware
- 6.3.2. Software
- 6.3.3. Services
- 6.1. Market Analysis, Insights and Forecast - by Type
- 7. Europe Radiology Information System Industry Analysis, Insights and Forecast, 2019-2031
- 7.1. Market Analysis, Insights and Forecast - by Type
- 7.1.1. Integrated Radiology Information System
- 7.1.2. Stand-alone Radiology Information System
- 7.2. Market Analysis, Insights and Forecast - by Deployment Mode
- 7.2.1. On-premise
- 7.2.2. Cloud-based
- 7.3. Market Analysis, Insights and Forecast - by Component
- 7.3.1. Hardware
- 7.3.2. Software
- 7.3.3. Services
- 7.1. Market Analysis, Insights and Forecast - by Type
- 8. Asia Pacific Radiology Information System Industry Analysis, Insights and Forecast, 2019-2031
- 8.1. Market Analysis, Insights and Forecast - by Type
- 8.1.1. Integrated Radiology Information System
- 8.1.2. Stand-alone Radiology Information System
- 8.2. Market Analysis, Insights and Forecast - by Deployment Mode
- 8.2.1. On-premise
- 8.2.2. Cloud-based
- 8.3. Market Analysis, Insights and Forecast - by Component
- 8.3.1. Hardware
- 8.3.2. Software
- 8.3.3. Services
- 8.1. Market Analysis, Insights and Forecast - by Type
- 9. Middle East and Africa Radiology Information System Industry Analysis, Insights and Forecast, 2019-2031
- 9.1. Market Analysis, Insights and Forecast - by Type
- 9.1.1. Integrated Radiology Information System
- 9.1.2. Stand-alone Radiology Information System
- 9.2. Market Analysis, Insights and Forecast - by Deployment Mode
- 9.2.1. On-premise
- 9.2.2. Cloud-based
- 9.3. Market Analysis, Insights and Forecast - by Component
- 9.3.1. Hardware
- 9.3.2. Software
- 9.3.3. Services
- 9.1. Market Analysis, Insights and Forecast - by Type
- 10. South America Radiology Information System Industry Analysis, Insights and Forecast, 2019-2031
- 10.1. Market Analysis, Insights and Forecast - by Type
- 10.1.1. Integrated Radiology Information System
- 10.1.2. Stand-alone Radiology Information System
- 10.2. Market Analysis, Insights and Forecast - by Deployment Mode
- 10.2.1. On-premise
- 10.2.2. Cloud-based
- 10.3. Market Analysis, Insights and Forecast - by Component
- 10.3.1. Hardware
- 10.3.2. Software
- 10.3.3. Services
- 10.1. Market Analysis, Insights and Forecast - by Type
- 11. North America Radiology Information System Industry Analysis, Insights and Forecast, 2019-2031
- 11.1. Market Analysis, Insights and Forecast - By Country/Sub-region
- 11.1.1 United States
- 11.1.2 Canada
- 11.1.3 Mexico
- 12. Europe Radiology Information System Industry Analysis, Insights and Forecast, 2019-2031
- 12.1. Market Analysis, Insights and Forecast - By Country/Sub-region
- 12.1.1 Germany
- 12.1.2 United Kingdom
- 12.1.3 France
- 12.1.4 Italy
- 12.1.5 Spain
- 12.1.6 Rest of Europe
- 13. Asia Pacific Radiology Information System Industry Analysis, Insights and Forecast, 2019-2031
- 13.1. Market Analysis, Insights and Forecast - By Country/Sub-region
- 13.1.1 China
- 13.1.2 Japan
- 13.1.3 India
- 13.1.4 Australia
- 13.1.5 South Korea
- 13.1.6 Rest of Asia Pacific
- 14. Middle East and Africa Radiology Information System Industry Analysis, Insights and Forecast, 2019-2031
- 14.1. Market Analysis, Insights and Forecast - By Country/Sub-region
- 14.1.1 GCC
- 14.1.2 South Africa
- 14.1.3 Rest of Middle East and Africa
- 15. South America Radiology Information System Industry Analysis, Insights and Forecast, 2019-2031
- 15.1. Market Analysis, Insights and Forecast - By Country/Sub-region
- 15.1.1 Brazil
- 15.1.2 Argentina
- 15.1.3 Rest of South America
- 16. Competitive Analysis
- 16.1. Global Market Share Analysis 2024
- 16.2. Company Profiles
- 16.2.1 Mckesson Corporation
- 16.2.1.1. Overview
- 16.2.1.2. Products
- 16.2.1.3. SWOT Analysis
- 16.2.1.4. Recent Developments
- 16.2.1.5. Financials (Based on Availability)
- 16.2.2 NextGen Healthcare
- 16.2.2.1. Overview
- 16.2.2.2. Products
- 16.2.2.3. SWOT Analysis
- 16.2.2.4. Recent Developments
- 16.2.2.5. Financials (Based on Availability)
- 16.2.3 Kareo
- 16.2.3.1. Overview
- 16.2.3.2. Products
- 16.2.3.3. SWOT Analysis
- 16.2.3.4. Recent Developments
- 16.2.3.5. Financials (Based on Availability)
- 16.2.4 Epic Systems Corporation
- 16.2.4.1. Overview
- 16.2.4.2. Products
- 16.2.4.3. SWOT Analysis
- 16.2.4.4. Recent Developments
- 16.2.4.5. Financials (Based on Availability)
- 16.2.5 Siemens Healthineers
- 16.2.5.1. Overview
- 16.2.5.2. Products
- 16.2.5.3. SWOT Analysis
- 16.2.5.4. Recent Developments
- 16.2.5.5. Financials (Based on Availability)
- 16.2.6 GE Healthcare
- 16.2.6.1. Overview
- 16.2.6.2. Products
- 16.2.6.3. SWOT Analysis
- 16.2.6.4. Recent Developments
- 16.2.6.5. Financials (Based on Availability)
- 16.2.7 Varian Medical Systems Inc
- 16.2.7.1. Overview
- 16.2.7.2. Products
- 16.2.7.3. SWOT Analysis
- 16.2.7.4. Recent Developments
- 16.2.7.5. Financials (Based on Availability)
- 16.2.8 IBM (Merge Healthcare Incorporated)
- 16.2.8.1. Overview
- 16.2.8.2. Products
- 16.2.8.3. SWOT Analysis
- 16.2.8.4. Recent Developments
- 16.2.8.5. Financials (Based on Availability)
- 16.2.9 Cerner Corporation
- 16.2.9.1. Overview
- 16.2.9.2. Products
- 16.2.9.3. SWOT Analysis
- 16.2.9.4. Recent Developments
- 16.2.9.5. Financials (Based on Availability)
- 16.2.10 Koninklijke Philips NV
- 16.2.10.1. Overview
- 16.2.10.2. Products
- 16.2.10.3. SWOT Analysis
- 16.2.10.4. Recent Developments
- 16.2.10.5. Financials (Based on Availability)
- 16.2.11 Medinformatix Inc
- 16.2.11.1. Overview
- 16.2.11.2. Products
- 16.2.11.3. SWOT Analysis
- 16.2.11.4. Recent Developments
- 16.2.11.5. Financials (Based on Availability)
- 16.2.12 Allscripts Healthcare Solutions Inc
- 16.2.12.1. Overview
- 16.2.12.2. Products
- 16.2.12.3. SWOT Analysis
- 16.2.12.4. Recent Developments
- 16.2.12.5. Financials (Based on Availability)
- 16.2.13 patientNOW Inc
- 16.2.13.1. Overview
- 16.2.13.2. Products
- 16.2.13.3. SWOT Analysis
- 16.2.13.4. Recent Developments
- 16.2.13.5. Financials (Based on Availability)
- 16.2.14 Konica Minolta Healthcare Americas Inc
- 16.2.14.1. Overview
- 16.2.14.2. Products
- 16.2.14.3. SWOT Analysis
- 16.2.14.4. Recent Developments
- 16.2.14.5. Financials (Based on Availability)
- 16.2.15 Practice Fusion
- 16.2.15.1. Overview
- 16.2.15.2. Products
- 16.2.15.3. SWOT Analysis
- 16.2.15.4. Recent Developments
- 16.2.15.5. Financials (Based on Availability)
- 16.2.1 Mckesson Corporation
List of Figures
- Figure 1: Global Radiology Information System Industry Revenue Breakdown (Million, %) by Region 2024 & 2032
- Figure 2: Global Radiology Information System Industry Volume Breakdown (K Unit, %) by Region 2024 & 2032
- Figure 3: North America Radiology Information System Industry Revenue (Million), by Country 2024 & 2032
- Figure 4: North America Radiology Information System Industry Volume (K Unit), by Country 2024 & 2032
- Figure 5: North America Radiology Information System Industry Revenue Share (%), by Country 2024 & 2032
- Figure 6: North America Radiology Information System Industry Volume Share (%), by Country 2024 & 2032
- Figure 7: Europe Radiology Information System Industry Revenue (Million), by Country 2024 & 2032
- Figure 8: Europe Radiology Information System Industry Volume (K Unit), by Country 2024 & 2032
- Figure 9: Europe Radiology Information System Industry Revenue Share (%), by Country 2024 & 2032
- Figure 10: Europe Radiology Information System Industry Volume Share (%), by Country 2024 & 2032
- Figure 11: Asia Pacific Radiology Information System Industry Revenue (Million), by Country 2024 & 2032
- Figure 12: Asia Pacific Radiology Information System Industry Volume (K Unit), by Country 2024 & 2032
- Figure 13: Asia Pacific Radiology Information System Industry Revenue Share (%), by Country 2024 & 2032
- Figure 14: Asia Pacific Radiology Information System Industry Volume Share (%), by Country 2024 & 2032
- Figure 15: Middle East and Africa Radiology Information System Industry Revenue (Million), by Country 2024 & 2032
- Figure 16: Middle East and Africa Radiology Information System Industry Volume (K Unit), by Country 2024 & 2032
- Figure 17: Middle East and Africa Radiology Information System Industry Revenue Share (%), by Country 2024 & 2032
- Figure 18: Middle East and Africa Radiology Information System Industry Volume Share (%), by Country 2024 & 2032
- Figure 19: South America Radiology Information System Industry Revenue (Million), by Country 2024 & 2032
- Figure 20: South America Radiology Information System Industry Volume (K Unit), by Country 2024 & 2032
- Figure 21: South America Radiology Information System Industry Revenue Share (%), by Country 2024 & 2032
- Figure 22: South America Radiology Information System Industry Volume Share (%), by Country 2024 & 2032
- Figure 23: North America Radiology Information System Industry Revenue (Million), by Type 2024 & 2032
- Figure 24: North America Radiology Information System Industry Volume (K Unit), by Type 2024 & 2032
- Figure 25: North America Radiology Information System Industry Revenue Share (%), by Type 2024 & 2032
- Figure 26: North America Radiology Information System Industry Volume Share (%), by Type 2024 & 2032
- Figure 27: North America Radiology Information System Industry Revenue (Million), by Deployment Mode 2024 & 2032
- Figure 28: North America Radiology Information System Industry Volume (K Unit), by Deployment Mode 2024 & 2032
- Figure 29: North America Radiology Information System Industry Revenue Share (%), by Deployment Mode 2024 & 2032
- Figure 30: North America Radiology Information System Industry Volume Share (%), by Deployment Mode 2024 & 2032
- Figure 31: North America Radiology Information System Industry Revenue (Million), by Component 2024 & 2032
- Figure 32: North America Radiology Information System Industry Volume (K Unit), by Component 2024 & 2032
- Figure 33: North America Radiology Information System Industry Revenue Share (%), by Component 2024 & 2032
- Figure 34: North America Radiology Information System Industry Volume Share (%), by Component 2024 & 2032
- Figure 35: North America Radiology Information System Industry Revenue (Million), by Country 2024 & 2032
- Figure 36: North America Radiology Information System Industry Volume (K Unit), by Country 2024 & 2032
- Figure 37: North America Radiology Information System Industry Revenue Share (%), by Country 2024 & 2032
- Figure 38: North America Radiology Information System Industry Volume Share (%), by Country 2024 & 2032
- Figure 39: Europe Radiology Information System Industry Revenue (Million), by Type 2024 & 2032
- Figure 40: Europe Radiology Information System Industry Volume (K Unit), by Type 2024 & 2032
- Figure 41: Europe Radiology Information System Industry Revenue Share (%), by Type 2024 & 2032
- Figure 42: Europe Radiology Information System Industry Volume Share (%), by Type 2024 & 2032
- Figure 43: Europe Radiology Information System Industry Revenue (Million), by Deployment Mode 2024 & 2032
- Figure 44: Europe Radiology Information System Industry Volume (K Unit), by Deployment Mode 2024 & 2032
- Figure 45: Europe Radiology Information System Industry Revenue Share (%), by Deployment Mode 2024 & 2032
- Figure 46: Europe Radiology Information System Industry Volume Share (%), by Deployment Mode 2024 & 2032
- Figure 47: Europe Radiology Information System Industry Revenue (Million), by Component 2024 & 2032
- Figure 48: Europe Radiology Information System Industry Volume (K Unit), by Component 2024 & 2032
- Figure 49: Europe Radiology Information System Industry Revenue Share (%), by Component 2024 & 2032
- Figure 50: Europe Radiology Information System Industry Volume Share (%), by Component 2024 & 2032
- Figure 51: Europe Radiology Information System Industry Revenue (Million), by Country 2024 & 2032
- Figure 52: Europe Radiology Information System Industry Volume (K Unit), by Country 2024 & 2032
- Figure 53: Europe Radiology Information System Industry Revenue Share (%), by Country 2024 & 2032
- Figure 54: Europe Radiology Information System Industry Volume Share (%), by Country 2024 & 2032
- Figure 55: Asia Pacific Radiology Information System Industry Revenue (Million), by Type 2024 & 2032
- Figure 56: Asia Pacific Radiology Information System Industry Volume (K Unit), by Type 2024 & 2032
- Figure 57: Asia Pacific Radiology Information System Industry Revenue Share (%), by Type 2024 & 2032
- Figure 58: Asia Pacific Radiology Information System Industry Volume Share (%), by Type 2024 & 2032
- Figure 59: Asia Pacific Radiology Information System Industry Revenue (Million), by Deployment Mode 2024 & 2032
- Figure 60: Asia Pacific Radiology Information System Industry Volume (K Unit), by Deployment Mode 2024 & 2032
- Figure 61: Asia Pacific Radiology Information System Industry Revenue Share (%), by Deployment Mode 2024 & 2032
- Figure 62: Asia Pacific Radiology Information System Industry Volume Share (%), by Deployment Mode 2024 & 2032
- Figure 63: Asia Pacific Radiology Information System Industry Revenue (Million), by Component 2024 & 2032
- Figure 64: Asia Pacific Radiology Information System Industry Volume (K Unit), by Component 2024 & 2032
- Figure 65: Asia Pacific Radiology Information System Industry Revenue Share (%), by Component 2024 & 2032
- Figure 66: Asia Pacific Radiology Information System Industry Volume Share (%), by Component 2024 & 2032
- Figure 67: Asia Pacific Radiology Information System Industry Revenue (Million), by Country 2024 & 2032
- Figure 68: Asia Pacific Radiology Information System Industry Volume (K Unit), by Country 2024 & 2032
- Figure 69: Asia Pacific Radiology Information System Industry Revenue Share (%), by Country 2024 & 2032
- Figure 70: Asia Pacific Radiology Information System Industry Volume Share (%), by Country 2024 & 2032
- Figure 71: Middle East and Africa Radiology Information System Industry Revenue (Million), by Type 2024 & 2032
- Figure 72: Middle East and Africa Radiology Information System Industry Volume (K Unit), by Type 2024 & 2032
- Figure 73: Middle East and Africa Radiology Information System Industry Revenue Share (%), by Type 2024 & 2032
- Figure 74: Middle East and Africa Radiology Information System Industry Volume Share (%), by Type 2024 & 2032
- Figure 75: Middle East and Africa Radiology Information System Industry Revenue (Million), by Deployment Mode 2024 & 2032
- Figure 76: Middle East and Africa Radiology Information System Industry Volume (K Unit), by Deployment Mode 2024 & 2032
- Figure 77: Middle East and Africa Radiology Information System Industry Revenue Share (%), by Deployment Mode 2024 & 2032
- Figure 78: Middle East and Africa Radiology Information System Industry Volume Share (%), by Deployment Mode 2024 & 2032
- Figure 79: Middle East and Africa Radiology Information System Industry Revenue (Million), by Component 2024 & 2032
- Figure 80: Middle East and Africa Radiology Information System Industry Volume (K Unit), by Component 2024 & 2032
- Figure 81: Middle East and Africa Radiology Information System Industry Revenue Share (%), by Component 2024 & 2032
- Figure 82: Middle East and Africa Radiology Information System Industry Volume Share (%), by Component 2024 & 2032
- Figure 83: Middle East and Africa Radiology Information System Industry Revenue (Million), by Country 2024 & 2032
- Figure 84: Middle East and Africa Radiology Information System Industry Volume (K Unit), by Country 2024 & 2032
- Figure 85: Middle East and Africa Radiology Information System Industry Revenue Share (%), by Country 2024 & 2032
- Figure 86: Middle East and Africa Radiology Information System Industry Volume Share (%), by Country 2024 & 2032
- Figure 87: South America Radiology Information System Industry Revenue (Million), by Type 2024 & 2032
- Figure 88: South America Radiology Information System Industry Volume (K Unit), by Type 2024 & 2032
- Figure 89: South America Radiology Information System Industry Revenue Share (%), by Type 2024 & 2032
- Figure 90: South America Radiology Information System Industry Volume Share (%), by Type 2024 & 2032
- Figure 91: South America Radiology Information System Industry Revenue (Million), by Deployment Mode 2024 & 2032
- Figure 92: South America Radiology Information System Industry Volume (K Unit), by Deployment Mode 2024 & 2032
- Figure 93: South America Radiology Information System Industry Revenue Share (%), by Deployment Mode 2024 & 2032
- Figure 94: South America Radiology Information System Industry Volume Share (%), by Deployment Mode 2024 & 2032
- Figure 95: South America Radiology Information System Industry Revenue (Million), by Component 2024 & 2032
- Figure 96: South America Radiology Information System Industry Volume (K Unit), by Component 2024 & 2032
- Figure 97: South America Radiology Information System Industry Revenue Share (%), by Component 2024 & 2032
- Figure 98: South America Radiology Information System Industry Volume Share (%), by Component 2024 & 2032
- Figure 99: South America Radiology Information System Industry Revenue (Million), by Country 2024 & 2032
- Figure 100: South America Radiology Information System Industry Volume (K Unit), by Country 2024 & 2032
- Figure 101: South America Radiology Information System Industry Revenue Share (%), by Country 2024 & 2032
- Figure 102: South America Radiology Information System Industry Volume Share (%), by Country 2024 & 2032
List of Tables
- Table 1: Global Radiology Information System Industry Revenue Million Forecast, by Region 2019 & 2032
- Table 2: Global Radiology Information System Industry Volume K Unit Forecast, by Region 2019 & 2032
- Table 3: Global Radiology Information System Industry Revenue Million Forecast, by Type 2019 & 2032
- Table 4: Global Radiology Information System Industry Volume K Unit Forecast, by Type 2019 & 2032
- Table 5: Global Radiology Information System Industry Revenue Million Forecast, by Deployment Mode 2019 & 2032
- Table 6: Global Radiology Information System Industry Volume K Unit Forecast, by Deployment Mode 2019 & 2032
- Table 7: Global Radiology Information System Industry Revenue Million Forecast, by Component 2019 & 2032
- Table 8: Global Radiology Information System Industry Volume K Unit Forecast, by Component 2019 & 2032
- Table 9: Global Radiology Information System Industry Revenue Million Forecast, by Region 2019 & 2032
- Table 10: Global Radiology Information System Industry Volume K Unit Forecast, by Region 2019 & 2032
- Table 11: Global Radiology Information System Industry Revenue Million Forecast, by Country 2019 & 2032
- Table 12: Global Radiology Information System Industry Volume K Unit Forecast, by Country 2019 & 2032
- Table 13: United States Radiology Information System Industry Revenue (Million) Forecast, by Application 2019 & 2032
- Table 14: United States Radiology Information System Industry Volume (K Unit) Forecast, by Application 2019 & 2032
- Table 15: Canada Radiology Information System Industry Revenue (Million) Forecast, by Application 2019 & 2032
- Table 16: Canada Radiology Information System Industry Volume (K Unit) Forecast, by Application 2019 & 2032
- Table 17: Mexico Radiology Information System Industry Revenue (Million) Forecast, by Application 2019 & 2032
- Table 18: Mexico Radiology Information System Industry Volume (K Unit) Forecast, by Application 2019 & 2032
- Table 19: Global Radiology Information System Industry Revenue Million Forecast, by Country 2019 & 2032
- Table 20: Global Radiology Information System Industry Volume K Unit Forecast, by Country 2019 & 2032
- Table 21: Germany Radiology Information System Industry Revenue (Million) Forecast, by Application 2019 & 2032
- Table 22: Germany Radiology Information System Industry Volume (K Unit) Forecast, by Application 2019 & 2032
- Table 23: United Kingdom Radiology Information System Industry Revenue (Million) Forecast, by Application 2019 & 2032
- Table 24: United Kingdom Radiology Information System Industry Volume (K Unit) Forecast, by Application 2019 & 2032
- Table 25: France Radiology Information System Industry Revenue (Million) Forecast, by Application 2019 & 2032
- Table 26: France Radiology Information System Industry Volume (K Unit) Forecast, by Application 2019 & 2032
- Table 27: Italy Radiology Information System Industry Revenue (Million) Forecast, by Application 2019 & 2032
- Table 28: Italy Radiology Information System Industry Volume (K Unit) Forecast, by Application 2019 & 2032
- Table 29: Spain Radiology Information System Industry Revenue (Million) Forecast, by Application 2019 & 2032
- Table 30: Spain Radiology Information System Industry Volume (K Unit) Forecast, by Application 2019 & 2032
- Table 31: Rest of Europe Radiology Information System Industry Revenue (Million) Forecast, by Application 2019 & 2032
- Table 32: Rest of Europe Radiology Information System Industry Volume (K Unit) Forecast, by Application 2019 & 2032
- Table 33: Global Radiology Information System Industry Revenue Million Forecast, by Country 2019 & 2032
- Table 34: Global Radiology Information System Industry Volume K Unit Forecast, by Country 2019 & 2032
- Table 35: China Radiology Information System Industry Revenue (Million) Forecast, by Application 2019 & 2032
- Table 36: China Radiology Information System Industry Volume (K Unit) Forecast, by Application 2019 & 2032
- Table 37: Japan Radiology Information System Industry Revenue (Million) Forecast, by Application 2019 & 2032
- Table 38: Japan Radiology Information System Industry Volume (K Unit) Forecast, by Application 2019 & 2032
- Table 39: India Radiology Information System Industry Revenue (Million) Forecast, by Application 2019 & 2032
- Table 40: India Radiology Information System Industry Volume (K Unit) Forecast, by Application 2019 & 2032
- Table 41: Australia Radiology Information System Industry Revenue (Million) Forecast, by Application 2019 & 2032
- Table 42: Australia Radiology Information System Industry Volume (K Unit) Forecast, by Application 2019 & 2032
- Table 43: South Korea Radiology Information System Industry Revenue (Million) Forecast, by Application 2019 & 2032
- Table 44: South Korea Radiology Information System Industry Volume (K Unit) Forecast, by Application 2019 & 2032
- Table 45: Rest of Asia Pacific Radiology Information System Industry Revenue (Million) Forecast, by Application 2019 & 2032
- Table 46: Rest of Asia Pacific Radiology Information System Industry Volume (K Unit) Forecast, by Application 2019 & 2032
- Table 47: Global Radiology Information System Industry Revenue Million Forecast, by Country 2019 & 2032
- Table 48: Global Radiology Information System Industry Volume K Unit Forecast, by Country 2019 & 2032
- Table 49: GCC Radiology Information System Industry Revenue (Million) Forecast, by Application 2019 & 2032
- Table 50: GCC Radiology Information System Industry Volume (K Unit) Forecast, by Application 2019 & 2032
- Table 51: South Africa Radiology Information System Industry Revenue (Million) Forecast, by Application 2019 & 2032
- Table 52: South Africa Radiology Information System Industry Volume (K Unit) Forecast, by Application 2019 & 2032
- Table 53: Rest of Middle East and Africa Radiology Information System Industry Revenue (Million) Forecast, by Application 2019 & 2032
- Table 54: Rest of Middle East and Africa Radiology Information System Industry Volume (K Unit) Forecast, by Application 2019 & 2032
- Table 55: Global Radiology Information System Industry Revenue Million Forecast, by Country 2019 & 2032
- Table 56: Global Radiology Information System Industry Volume K Unit Forecast, by Country 2019 & 2032
- Table 57: Brazil Radiology Information System Industry Revenue (Million) Forecast, by Application 2019 & 2032
- Table 58: Brazil Radiology Information System Industry Volume (K Unit) Forecast, by Application 2019 & 2032
- Table 59: Argentina Radiology Information System Industry Revenue (Million) Forecast, by Application 2019 & 2032
- Table 60: Argentina Radiology Information System Industry Volume (K Unit) Forecast, by Application 2019 & 2032
- Table 61: Rest of South America Radiology Information System Industry Revenue (Million) Forecast, by Application 2019 & 2032
- Table 62: Rest of South America Radiology Information System Industry Volume (K Unit) Forecast, by Application 2019 & 2032
- Table 63: Global Radiology Information System Industry Revenue Million Forecast, by Type 2019 & 2032
- Table 64: Global Radiology Information System Industry Volume K Unit Forecast, by Type 2019 & 2032
- Table 65: Global Radiology Information System Industry Revenue Million Forecast, by Deployment Mode 2019 & 2032
- Table 66: Global Radiology Information System Industry Volume K Unit Forecast, by Deployment Mode 2019 & 2032
- Table 67: Global Radiology Information System Industry Revenue Million Forecast, by Component 2019 & 2032
- Table 68: Global Radiology Information System Industry Volume K Unit Forecast, by Component 2019 & 2032
- Table 69: Global Radiology Information System Industry Revenue Million Forecast, by Country 2019 & 2032
- Table 70: Global Radiology Information System Industry Volume K Unit Forecast, by Country 2019 & 2032
- Table 71: United States Radiology Information System Industry Revenue (Million) Forecast, by Application 2019 & 2032
- Table 72: United States Radiology Information System Industry Volume (K Unit) Forecast, by Application 2019 & 2032
- Table 73: Canada Radiology Information System Industry Revenue (Million) Forecast, by Application 2019 & 2032
- Table 74: Canada Radiology Information System Industry Volume (K Unit) Forecast, by Application 2019 & 2032
- Table 75: Mexico Radiology Information System Industry Revenue (Million) Forecast, by Application 2019 & 2032
- Table 76: Mexico Radiology Information System Industry Volume (K Unit) Forecast, by Application 2019 & 2032
- Table 77: Global Radiology Information System Industry Revenue Million Forecast, by Type 2019 & 2032
- Table 78: Global Radiology Information System Industry Volume K Unit Forecast, by Type 2019 & 2032
- Table 79: Global Radiology Information System Industry Revenue Million Forecast, by Deployment Mode 2019 & 2032
- Table 80: Global Radiology Information System Industry Volume K Unit Forecast, by Deployment Mode 2019 & 2032
- Table 81: Global Radiology Information System Industry Revenue Million Forecast, by Component 2019 & 2032
- Table 82: Global Radiology Information System Industry Volume K Unit Forecast, by Component 2019 & 2032
- Table 83: Global Radiology Information System Industry Revenue Million Forecast, by Country 2019 & 2032
- Table 84: Global Radiology Information System Industry Volume K Unit Forecast, by Country 2019 & 2032
- Table 85: Germany Radiology Information System Industry Revenue (Million) Forecast, by Application 2019 & 2032
- Table 86: Germany Radiology Information System Industry Volume (K Unit) Forecast, by Application 2019 & 2032
- Table 87: United Kingdom Radiology Information System Industry Revenue (Million) Forecast, by Application 2019 & 2032
- Table 88: United Kingdom Radiology Information System Industry Volume (K Unit) Forecast, by Application 2019 & 2032
- Table 89: France Radiology Information System Industry Revenue (Million) Forecast, by Application 2019 & 2032
- Table 90: France Radiology Information System Industry Volume (K Unit) Forecast, by Application 2019 & 2032
- Table 91: Italy Radiology Information System Industry Revenue (Million) Forecast, by Application 2019 & 2032
- Table 92: Italy Radiology Information System Industry Volume (K Unit) Forecast, by Application 2019 & 2032
- Table 93: Spain Radiology Information System Industry Revenue (Million) Forecast, by Application 2019 & 2032
- Table 94: Spain Radiology Information System Industry Volume (K Unit) Forecast, by Application 2019 & 2032
- Table 95: Rest of Europe Radiology Information System Industry Revenue (Million) Forecast, by Application 2019 & 2032
- Table 96: Rest of Europe Radiology Information System Industry Volume (K Unit) Forecast, by Application 2019 & 2032
- Table 97: Global Radiology Information System Industry Revenue Million Forecast, by Type 2019 & 2032
- Table 98: Global Radiology Information System Industry Volume K Unit Forecast, by Type 2019 & 2032
- Table 99: Global Radiology Information System Industry Revenue Million Forecast, by Deployment Mode 2019 & 2032
- Table 100: Global Radiology Information System Industry Volume K Unit Forecast, by Deployment Mode 2019 & 2032
- Table 101: Global Radiology Information System Industry Revenue Million Forecast, by Component 2019 & 2032
- Table 102: Global Radiology Information System Industry Volume K Unit Forecast, by Component 2019 & 2032
- Table 103: Global Radiology Information System Industry Revenue Million Forecast, by Country 2019 & 2032
- Table 104: Global Radiology Information System Industry Volume K Unit Forecast, by Country 2019 & 2032
- Table 105: China Radiology Information System Industry Revenue (Million) Forecast, by Application 2019 & 2032
- Table 106: China Radiology Information System Industry Volume (K Unit) Forecast, by Application 2019 & 2032
- Table 107: Japan Radiology Information System Industry Revenue (Million) Forecast, by Application 2019 & 2032
- Table 108: Japan Radiology Information System Industry Volume (K Unit) Forecast, by Application 2019 & 2032
- Table 109: India Radiology Information System Industry Revenue (Million) Forecast, by Application 2019 & 2032
- Table 110: India Radiology Information System Industry Volume (K Unit) Forecast, by Application 2019 & 2032
- Table 111: Australia Radiology Information System Industry Revenue (Million) Forecast, by Application 2019 & 2032
- Table 112: Australia Radiology Information System Industry Volume (K Unit) Forecast, by Application 2019 & 2032
- Table 113: South Korea Radiology Information System Industry Revenue (Million) Forecast, by Application 2019 & 2032
- Table 114: South Korea Radiology Information System Industry Volume (K Unit) Forecast, by Application 2019 & 2032
- Table 115: Rest of Asia Pacific Radiology Information System Industry Revenue (Million) Forecast, by Application 2019 & 2032
- Table 116: Rest of Asia Pacific Radiology Information System Industry Volume (K Unit) Forecast, by Application 2019 & 2032
- Table 117: Global Radiology Information System Industry Revenue Million Forecast, by Type 2019 & 2032
- Table 118: Global Radiology Information System Industry Volume K Unit Forecast, by Type 2019 & 2032
- Table 119: Global Radiology Information System Industry Revenue Million Forecast, by Deployment Mode 2019 & 2032
- Table 120: Global Radiology Information System Industry Volume K Unit Forecast, by Deployment Mode 2019 & 2032
- Table 121: Global Radiology Information System Industry Revenue Million Forecast, by Component 2019 & 2032
- Table 122: Global Radiology Information System Industry Volume K Unit Forecast, by Component 2019 & 2032
- Table 123: Global Radiology Information System Industry Revenue Million Forecast, by Country 2019 & 2032
- Table 124: Global Radiology Information System Industry Volume K Unit Forecast, by Country 2019 & 2032
- Table 125: GCC Radiology Information System Industry Revenue (Million) Forecast, by Application 2019 & 2032
- Table 126: GCC Radiology Information System Industry Volume (K Unit) Forecast, by Application 2019 & 2032
- Table 127: South Africa Radiology Information System Industry Revenue (Million) Forecast, by Application 2019 & 2032
- Table 128: South Africa Radiology Information System Industry Volume (K Unit) Forecast, by Application 2019 & 2032
- Table 129: Rest of Middle East and Africa Radiology Information System Industry Revenue (Million) Forecast, by Application 2019 & 2032
- Table 130: Rest of Middle East and Africa Radiology Information System Industry Volume (K Unit) Forecast, by Application 2019 & 2032
- Table 131: Global Radiology Information System Industry Revenue Million Forecast, by Type 2019 & 2032
- Table 132: Global Radiology Information System Industry Volume K Unit Forecast, by Type 2019 & 2032
- Table 133: Global Radiology Information System Industry Revenue Million Forecast, by Deployment Mode 2019 & 2032
- Table 134: Global Radiology Information System Industry Volume K Unit Forecast, by Deployment Mode 2019 & 2032
- Table 135: Global Radiology Information System Industry Revenue Million Forecast, by Component 2019 & 2032
- Table 136: Global Radiology Information System Industry Volume K Unit Forecast, by Component 2019 & 2032
- Table 137: Global Radiology Information System Industry Revenue Million Forecast, by Country 2019 & 2032
- Table 138: Global Radiology Information System Industry Volume K Unit Forecast, by Country 2019 & 2032
- Table 139: Brazil Radiology Information System Industry Revenue (Million) Forecast, by Application 2019 & 2032
- Table 140: Brazil Radiology Information System Industry Volume (K Unit) Forecast, by Application 2019 & 2032
- Table 141: Argentina Radiology Information System Industry Revenue (Million) Forecast, by Application 2019 & 2032
- Table 142: Argentina Radiology Information System Industry Volume (K Unit) Forecast, by Application 2019 & 2032
- Table 143: Rest of South America Radiology Information System Industry Revenue (Million) Forecast, by Application 2019 & 2032
- Table 144: Rest of South America Radiology Information System Industry Volume (K Unit) Forecast, by Application 2019 & 2032
Frequently Asked Questions
1. What is the projected Compound Annual Growth Rate (CAGR) of the Radiology Information System Industry?
The projected CAGR is approximately 8.63%.
2. Which companies are prominent players in the Radiology Information System Industry?
Key companies in the market include Mckesson Corporation, NextGen Healthcare, Kareo, Epic Systems Corporation, Siemens Healthineers, GE Healthcare, Varian Medical Systems Inc, IBM (Merge Healthcare Incorporated), Cerner Corporation, Koninklijke Philips NV, Medinformatix Inc, Allscripts Healthcare Solutions Inc, patientNOW Inc, Konica Minolta Healthcare Americas Inc , Practice Fusion.
3. What are the main segments of the Radiology Information System Industry?
The market segments include Type, Deployment Mode, Component.
4. Can you provide details about the market size?
The market size is estimated to be USD 1.25 Million as of 2022.
5. What are some drivers contributing to market growth?
Improved Healthcare Information Technology Systems; Growth in the Incidence Rate of Chronic Diseases; Increase in Government Funding for Cancer-related Research.
6. What are the notable trends driving market growth?
The Cloud-based Segment is Expected to Witness High Growth over the Forecast Period.
7. Are there any restraints impacting market growth?
High Cost of the Installation; Scarcity of Skilled Labor.
8. Can you provide examples of recent developments in the market?
In March 2022, Intelerad Medical Systems launched the Enterprise Imaging and Informatics Suite at the 2022 Healthcare Information and Management Systems Society (HIMSS) Global Health Conference and Exhibition, which may provide radiologists with an emerging option for medical image management.
9. What pricing options are available for accessing the report?
Pricing options include single-user, multi-user, and enterprise licenses priced at USD 4750, USD 5250, and USD 8750 respectively.
10. Is the market size provided in terms of value or volume?
The market size is provided in terms of value, measured in Million and volume, measured in K Unit.
11. Are there any specific market keywords associated with the report?
Yes, the market keyword associated with the report is "Radiology Information System Industry," which aids in identifying and referencing the specific market segment covered.
12. How do I determine which pricing option suits my needs best?
The pricing options vary based on user requirements and access needs. Individual users may opt for single-user licenses, while businesses requiring broader access may choose multi-user or enterprise licenses for cost-effective access to the report.
13. Are there any additional resources or data provided in the Radiology Information System Industry report?
While the report offers comprehensive insights, it's advisable to review the specific contents or supplementary materials provided to ascertain if additional resources or data are available.
14. How can I stay updated on further developments or reports in the Radiology Information System Industry?
To stay informed about further developments, trends, and reports in the Radiology Information System Industry, consider subscribing to industry newsletters, following relevant companies and organizations, or regularly checking reputable industry news sources and publications.
Methodology
Step 1 - Identification of Relevant Samples Size from Population Database


Step 2 - Approaches for Defining Global Market Size (Value, Volume* & Price*)

Note*: In applicable scenarios
Step 3 - Data Sources
Primary Research
- Web Analytics
- Survey Reports
- Research Institute
- Latest Research Reports
- Opinion Leaders
Secondary Research
- Annual Reports
- White Paper
- Latest Press Release
- Industry Association
- Paid Database
- Investor Presentations

Step 4 - Data Triangulation
Involves using different sources of information in order to increase the validity of a study
These sources are likely to be stakeholders in a program - participants, other researchers, program staff, other community members, and so on.
Then we put all data in single framework & apply various statistical tools to find out the dynamic on the market.
During the analysis stage, feedback from the stakeholder groups would be compared to determine areas of agreement as well as areas of divergence


