

Key Insights
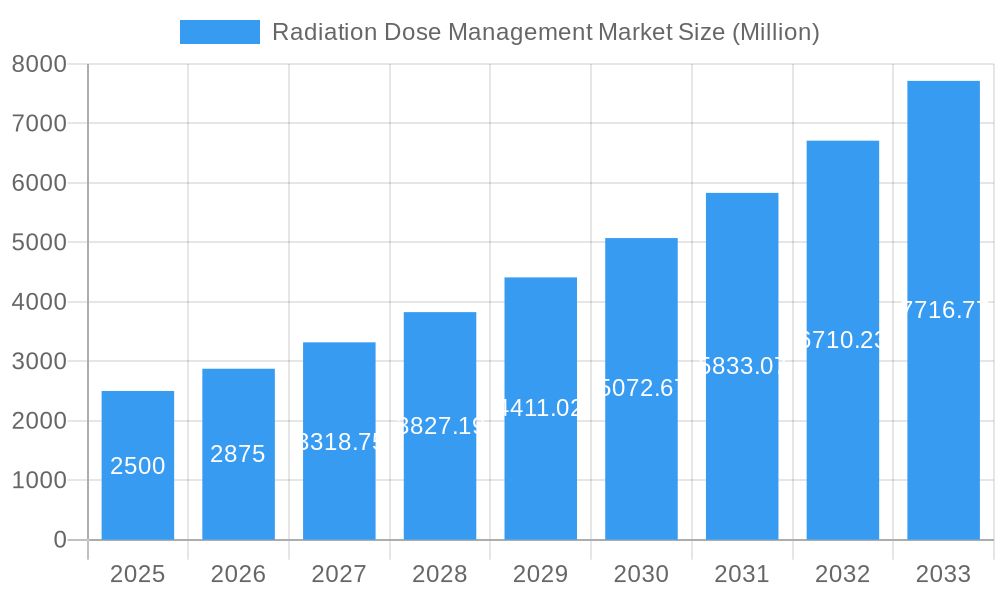
The Radiation Dose Management market is experiencing robust growth, projected to reach a significant value by 2033, driven by a 15% CAGR from 2025. This expansion is fueled by several key factors. The increasing prevalence of chronic diseases requiring frequent imaging procedures, coupled with growing awareness of radiation-induced health risks, is driving demand for effective dose management solutions. Advancements in imaging technology, such as AI-powered dose optimization tools and advanced image reconstruction techniques, are contributing to market growth. Furthermore, stringent regulatory guidelines regarding radiation safety, particularly in North America and Europe, are pushing healthcare providers to adopt these solutions to ensure patient safety and compliance. The market is segmented by end-user (ambulatory care settings, hospitals, others), products & services (standalone solutions, integrated solutions, services), and modality (computed tomography, fluoroscopy & interventional imaging, nuclear medicine, radiography & mammography). Hospitals currently dominate the market share due to higher imaging volumes and stricter regulatory compliance. However, the ambulatory care settings segment is projected for significant growth due to rising outpatient procedures. Integrated solutions are gaining traction over standalone solutions due to improved workflow efficiency and comprehensive data management capabilities.
Radiation Dose Management Market Market Size (In Billion)
The competitive landscape is characterized by a mix of established players like GE Healthcare, Philips, and Fujifilm, alongside smaller, specialized companies focusing on innovative software solutions. The Asia-Pacific region is expected to witness the highest growth rate due to increasing healthcare infrastructure development and rising disposable incomes. However, high initial investment costs for advanced technologies and the complexity of integrating new solutions into existing healthcare workflows can pose challenges. Nonetheless, the long-term outlook for the Radiation Dose Management market remains positive, driven by technological innovation, regulatory pressures, and a growing focus on patient safety within the healthcare industry. The continued emphasis on reducing unnecessary radiation exposure and improving diagnostic accuracy will further propel market growth in the coming years.
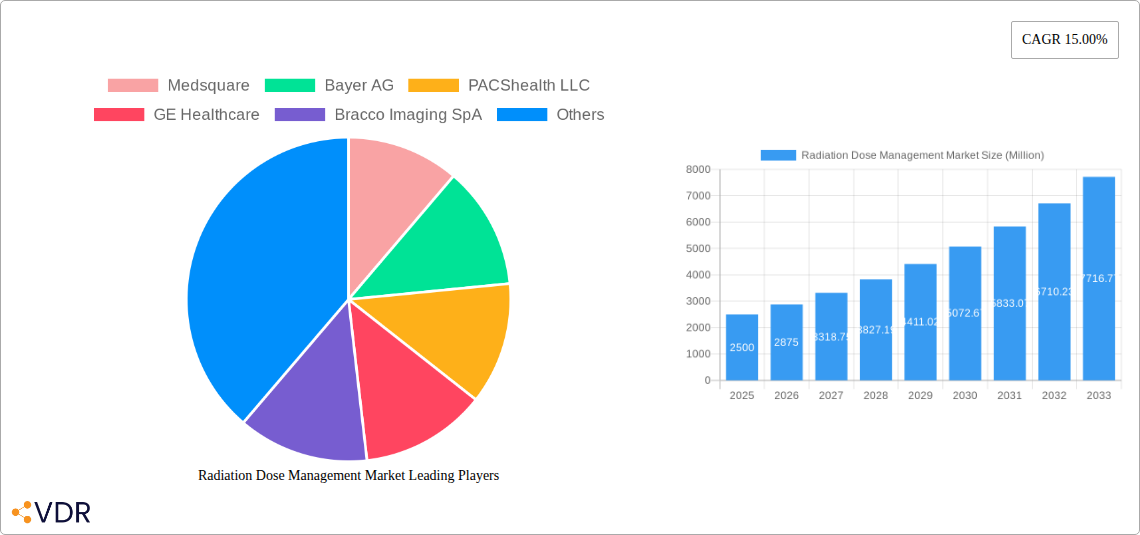
Radiation Dose Management Market Company Market Share
Radiation Dose Management Market: A Comprehensive Report (2019-2033)
This comprehensive report provides a detailed analysis of the Radiation Dose Management Market, encompassing market dynamics, growth trends, regional analysis, product landscape, key players, and future outlook. The report covers the period from 2019 to 2033, with 2025 serving as the base year and estimated year. The market is segmented by end-user (Ambulatory Care Settings, Hospital, Other End Users), products & services (Standalone Solutions, Integrated Solutions, Services), and modality (Computed Tomography, Fluoroscopy and Interventional Imaging, Nuclear Medicine, Radiography and Mammography). The report is designed for industry professionals, investors, and stakeholders seeking a deep understanding of this crucial healthcare sector. The global market size is projected to reach xx Million by 2033.
Radiation Dose Management Market Market Dynamics & Structure
The Radiation Dose Management market is characterized by moderate concentration, with several key players holding significant market share. Technological innovation, driven by advancements in AI and image processing, is a major driver, alongside stringent regulatory frameworks aimed at minimizing patient radiation exposure. Competitive substitutes, such as alternative imaging techniques, exert pressure on market growth. The end-user demographic is expanding due to an aging population and rising prevalence of chronic diseases necessitating frequent imaging. Mergers and acquisitions (M&A) activity has been relatively moderate (xx deals in the past five years), with strategic partnerships becoming increasingly prevalent to expand market reach and technological capabilities.
- Market Concentration: Moderately concentrated, with the top 5 players holding approximately xx% of market share in 2025.
- Technological Innovation: AI-powered dose optimization software and advanced image reconstruction techniques are key drivers.
- Regulatory Framework: Stringent regulations concerning radiation safety drive market adoption of dose management solutions.
- Competitive Substitutes: Alternative imaging modalities (e.g., ultrasound, MRI) present competitive pressures.
- End-User Demographics: Aging population and increasing prevalence of chronic diseases fuel demand for imaging services.
- M&A Activity: Moderate M&A activity (xx deals in 2019-2024), with a focus on strategic partnerships.
- Innovation Barriers: High regulatory hurdles, significant R&D investment, and limited reimbursement policies can impede innovation.
Radiation Dose Management Market Growth Trends & Insights
The Radiation Dose Management market has witnessed significant growth during the historical period (2019-2024), with a CAGR of xx%. This growth is fueled by increasing awareness of radiation risks, technological advancements, and rising healthcare spending. The adoption rate of dose management solutions is steadily increasing, particularly in developed regions. Technological disruptions, such as the integration of AI and machine learning, are transforming the market landscape, leading to more precise and efficient dose optimization. Shifts in consumer behavior, with a greater emphasis on patient safety and personalized care, further contribute to market growth. Market penetration is currently at xx% in 2025 and is expected to reach xx% by 2033. The forecast period (2025-2033) projects continued growth, driven by factors outlined above. The market is expected to exhibit a CAGR of xx% during this period.
Dominant Regions, Countries, or Segments in Radiation Dose Management Market
North America currently dominates the Radiation Dose Management market, driven by strong regulatory frameworks, high healthcare expenditure, and early adoption of advanced technologies. Within this region, the United States holds the largest market share, followed by Canada. The hospital segment represents the largest end-user segment due to high volume of imaging procedures. Computed Tomography (CT) currently holds the largest share in the modality segment.
- North America: High healthcare spending, stringent regulations, and early adoption of advanced technologies drive market dominance.
- Europe: Growing awareness of radiation risks and increasing focus on patient safety are contributing factors.
- Asia Pacific: Rapid economic growth and expanding healthcare infrastructure are boosting market growth, with significant potential for future expansion.
- Hospital Segment: Highest volume of imaging procedures drives demand for dose management solutions.
- Computed Tomography (CT): High radiation dose associated with CT scans fuels demand for dose management in this modality.
Radiation Dose Management Market Product Landscape
The market offers a range of standalone and integrated solutions, along with specialized services. Standalone solutions focus on specific modalities, while integrated solutions offer comprehensive dose management across multiple imaging platforms. Services encompass consulting, training, and ongoing support. Key performance indicators (KPIs) include dose reduction percentages, workflow efficiency gains, and improved image quality. Innovations focus on AI-powered dose optimization algorithms and advanced image reconstruction techniques that minimize radiation exposure while maintaining diagnostic image quality.
Key Drivers, Barriers & Challenges in Radiation Dose Management Market
Key Drivers:
- Rising awareness of radiation risks among patients and healthcare professionals.
- Increasing adoption of advanced imaging techniques with higher radiation potential.
- Stringent regulatory frameworks promoting radiation safety.
- Technological advancements in dose optimization algorithms and software.
Challenges and Restraints:
- High initial investment costs associated with implementing dose management systems.
- Complexity in integrating new technologies into existing workflows.
- Limited reimbursement policies for dose management services in some regions.
- Competition from alternative imaging modalities. This results in an estimated xx Million reduction in market value annually.
Emerging Opportunities in Radiation Dose Management Market
- Expanding applications in various medical specialties beyond radiology.
- Increasing demand for personalized dose optimization based on patient characteristics.
- Growing adoption of cloud-based solutions for remote monitoring and data analysis.
- Development of new algorithms for improved dose reduction and image quality.
Growth Accelerators in the Radiation Dose Management Market Industry
Technological advancements, strategic collaborations among technology providers and healthcare institutions, and expansion into emerging markets are key catalysts driving long-term growth. The development of AI-powered platforms for automated dose optimization holds significant promise for future market expansion. Growing focus on personalized medicine will also drive demand for customized dose management solutions.
Key Players Shaping the Radiation Dose Management Market Market
- Medsquare
- Bayer AG
- PACShealth LLC
- GE Healthcare
- Bracco Imaging SpA
- Koninklijke Philips N V
- Qaelum NV
- Sectra AB
- Novarad Corporation
- Fujifilm Holdings Corporation *List Not Exhaustive
Notable Milestones in Radiation Dose Management Market Sector
- 2020: FDA approval of a novel AI-based dose optimization software.
- 2022: Launch of a cloud-based dose management platform by a major vendor.
- 2023: Acquisition of a small dose management company by a large medical device manufacturer. (This resulted in a xx% increase in market share for the acquiring company).
In-Depth Radiation Dose Management Market Market Outlook
The Radiation Dose Management market is poised for continued growth, driven by technological advancements, increased regulatory scrutiny, and a growing awareness of radiation risks. Strategic partnerships, expansion into emerging markets, and the development of innovative solutions will play a crucial role in shaping the future market landscape. The long-term outlook is positive, with significant opportunities for growth and innovation in this critical healthcare sector. The market is expected to reach xx Million by 2033, representing substantial growth potential for industry stakeholders.
Radiation Dose Management Market Segmentation
-
1. Products & Services
- 1.1. Standalone Solutions
- 1.2. Integrated Solutions
-
2. Modality
- 2.1. Computed Tomography
- 2.2. Fluoroscopy and Interventional Imaging
- 2.3. Nuclear Medicine
- 2.4. Radiography and Mammography
-
3. End User
- 3.1. Ambulatory Care Settings
- 3.2. Hospital
- 3.3. Other End Users
Radiation Dose Management Market Segmentation By Geography
-
1. North America
- 1.1. United States
- 1.2. Canada
- 1.3. Mexico
-
2. Europe
- 2.1. Germany
- 2.2. United Kingdom
- 2.3. France
- 2.4. Italy
- 2.5. Spain
- 2.6. Rest of Europe
-
3. Asia Pacific
- 3.1. China
- 3.2. Japan
- 3.3. India
- 3.4. Australia
- 3.5. South Korea
- 3.6. Rest of Asia Pacific
-
4. Middle East and Africa
- 4.1. GCC
- 4.2. South Africa
- 4.3. Rest of Middle East and Africa
-
5. South America
- 5.1. Brazil
- 5.2. Argentina
- 5.3. Rest of South America
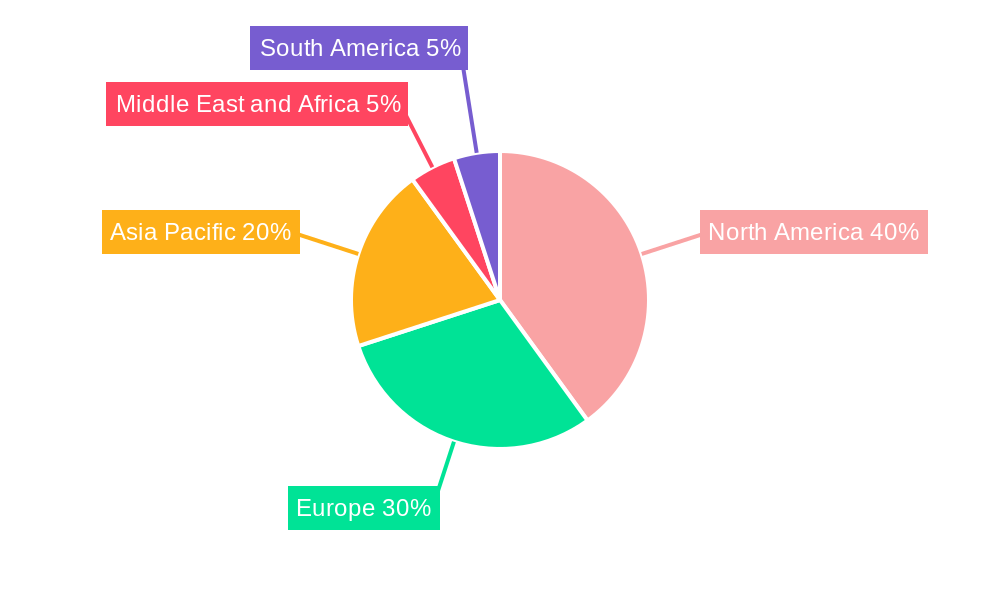
Radiation Dose Management Market Regional Market Share
Geographic Coverage of Radiation Dose Management Market
Radiation Dose Management Market REPORT HIGHLIGHTS
| Aspects | Details |
|---|---|
| Study Period | 2020-2034 |
| Base Year | 2025 |
| Estimated Year | 2026 |
| Forecast Period | 2026-2034 |
| Historical Period | 2020-2025 |
| Growth Rate | CAGR of 15.1% from 2020-2034 |
| Segmentation |
|
Table of Contents
- 1. Introduction
- 1.1. Research Scope
- 1.2. Market Segmentation
- 1.3. Research Objective
- 1.4. Definitions and Assumptions
- 2. Executive Summary
- 2.1. Market Snapshot
- 3. Market Dynamics
- 3.1. Market Drivers
- 3.2. Market Restrains
- 3.3. Market Trends
- 3.4. Market Opportunities
- 4. Market Factor Analysis
- 4.1. Porters Five Forces
- 4.1.1. Bargaining Power of Suppliers
- 4.1.2. Bargaining Power of Buyers
- 4.1.3. Threat of New Entrants
- 4.1.4. Threat of Substitutes
- 4.1.5. Competitive Rivalry
- 4.2. PESTEL analysis
- 4.3. BCG Analysis
- 4.3.1. Stars (High Growth, High Market Share)
- 4.3.2. Cash Cows (Low Growth, High Market Share)
- 4.3.3. Question Mark (High Growth, Low Market Share)
- 4.3.4. Dogs (Low Growth, Low Market Share)
- 4.4. Ansoff Matrix Analysis
- 4.5. Supply Chain Analysis
- 4.6. Regulatory Landscape
- 4.7. Current Market Potential and Opportunity Assessment (TAM–SAM–SOM Framework)
- 4.8. VDR Analyst Note
- 4.1. Porters Five Forces
- 5. Market Analysis, Insights and Forecast 2021-2033
- 5.1. Market Analysis, Insights and Forecast - by Products & Services
- 5.1.1. Standalone Solutions
- 5.1.2. Integrated Solutions
- 5.2. Market Analysis, Insights and Forecast - by Modality
- 5.2.1. Computed Tomography
- 5.2.2. Fluoroscopy and Interventional Imaging
- 5.2.3. Nuclear Medicine
- 5.2.4. Radiography and Mammography
- 5.3. Market Analysis, Insights and Forecast - by End User
- 5.3.1. Ambulatory Care Settings
- 5.3.2. Hospital
- 5.3.3. Other End Users
- 5.4. Market Analysis, Insights and Forecast - by Region
- 5.4.1. North America
- 5.4.2. Europe
- 5.4.3. Asia Pacific
- 5.4.4. Middle East and Africa
- 5.4.5. South America
- 5.1. Market Analysis, Insights and Forecast - by Products & Services
- 6. Global Radiation Dose Management Market Analysis, Insights and Forecast, 2021-2033
- 6.1. Market Analysis, Insights and Forecast - by Products & Services
- 6.1.1. Standalone Solutions
- 6.1.2. Integrated Solutions
- 6.2. Market Analysis, Insights and Forecast - by Modality
- 6.2.1. Computed Tomography
- 6.2.2. Fluoroscopy and Interventional Imaging
- 6.2.3. Nuclear Medicine
- 6.2.4. Radiography and Mammography
- 6.3. Market Analysis, Insights and Forecast - by End User
- 6.3.1. Ambulatory Care Settings
- 6.3.2. Hospital
- 6.3.3. Other End Users
- 6.1. Market Analysis, Insights and Forecast - by Products & Services
- 7. North America Radiation Dose Management Market Analysis, Insights and Forecast, 2021-2033
- 7.1. Market Analysis, Insights and Forecast - by Products & Services
- 7.1.1. Standalone Solutions
- 7.1.2. Integrated Solutions
- 7.2. Market Analysis, Insights and Forecast - by Modality
- 7.2.1. Computed Tomography
- 7.2.2. Fluoroscopy and Interventional Imaging
- 7.2.3. Nuclear Medicine
- 7.2.4. Radiography and Mammography
- 7.3. Market Analysis, Insights and Forecast - by End User
- 7.3.1. Ambulatory Care Settings
- 7.3.2. Hospital
- 7.3.3. Other End Users
- 7.1. Market Analysis, Insights and Forecast - by Products & Services
- 8. Europe Radiation Dose Management Market Analysis, Insights and Forecast, 2021-2033
- 8.1. Market Analysis, Insights and Forecast - by Products & Services
- 8.1.1. Standalone Solutions
- 8.1.2. Integrated Solutions
- 8.2. Market Analysis, Insights and Forecast - by Modality
- 8.2.1. Computed Tomography
- 8.2.2. Fluoroscopy and Interventional Imaging
- 8.2.3. Nuclear Medicine
- 8.2.4. Radiography and Mammography
- 8.3. Market Analysis, Insights and Forecast - by End User
- 8.3.1. Ambulatory Care Settings
- 8.3.2. Hospital
- 8.3.3. Other End Users
- 8.1. Market Analysis, Insights and Forecast - by Products & Services
- 9. Asia Pacific Radiation Dose Management Market Analysis, Insights and Forecast, 2021-2033
- 9.1. Market Analysis, Insights and Forecast - by Products & Services
- 9.1.1. Standalone Solutions
- 9.1.2. Integrated Solutions
- 9.2. Market Analysis, Insights and Forecast - by Modality
- 9.2.1. Computed Tomography
- 9.2.2. Fluoroscopy and Interventional Imaging
- 9.2.3. Nuclear Medicine
- 9.2.4. Radiography and Mammography
- 9.3. Market Analysis, Insights and Forecast - by End User
- 9.3.1. Ambulatory Care Settings
- 9.3.2. Hospital
- 9.3.3. Other End Users
- 9.1. Market Analysis, Insights and Forecast - by Products & Services
- 10. Middle East and Africa Radiation Dose Management Market Analysis, Insights and Forecast, 2021-2033
- 10.1. Market Analysis, Insights and Forecast - by Products & Services
- 10.1.1. Standalone Solutions
- 10.1.2. Integrated Solutions
- 10.2. Market Analysis, Insights and Forecast - by Modality
- 10.2.1. Computed Tomography
- 10.2.2. Fluoroscopy and Interventional Imaging
- 10.2.3. Nuclear Medicine
- 10.2.4. Radiography and Mammography
- 10.3. Market Analysis, Insights and Forecast - by End User
- 10.3.1. Ambulatory Care Settings
- 10.3.2. Hospital
- 10.3.3. Other End Users
- 10.1. Market Analysis, Insights and Forecast - by Products & Services
- 11. South America Radiation Dose Management Market Analysis, Insights and Forecast, 2021-2033
- 11.1. Market Analysis, Insights and Forecast - by Products & Services
- 11.1.1. Standalone Solutions
- 11.1.2. Integrated Solutions
- 11.2. Market Analysis, Insights and Forecast - by Modality
- 11.2.1. Computed Tomography
- 11.2.2. Fluoroscopy and Interventional Imaging
- 11.2.3. Nuclear Medicine
- 11.2.4. Radiography and Mammography
- 11.3. Market Analysis, Insights and Forecast - by End User
- 11.3.1. Ambulatory Care Settings
- 11.3.2. Hospital
- 11.3.3. Other End Users
- 11.1. Market Analysis, Insights and Forecast - by Products & Services
- 12. Competitive Analysis
- 12.1. Company Profiles
- 12.1.1 Medsquare
- 12.1.1.1. Company Overview
- 12.1.1.2. Products
- 12.1.1.3. Company Financials
- 12.1.1.4. SWOT Analysis
- 12.1.2 Bayer AG
- 12.1.2.1. Company Overview
- 12.1.2.2. Products
- 12.1.2.3. Company Financials
- 12.1.2.4. SWOT Analysis
- 12.1.3 PACShealth LLC
- 12.1.3.1. Company Overview
- 12.1.3.2. Products
- 12.1.3.3. Company Financials
- 12.1.3.4. SWOT Analysis
- 12.1.4 GE Healthcare
- 12.1.4.1. Company Overview
- 12.1.4.2. Products
- 12.1.4.3. Company Financials
- 12.1.4.4. SWOT Analysis
- 12.1.5 Bracco Imaging SpA
- 12.1.5.1. Company Overview
- 12.1.5.2. Products
- 12.1.5.3. Company Financials
- 12.1.5.4. SWOT Analysis
- 12.1.6 Koninklijke Philips N V
- 12.1.6.1. Company Overview
- 12.1.6.2. Products
- 12.1.6.3. Company Financials
- 12.1.6.4. SWOT Analysis
- 12.1.7 Qaelum NV
- 12.1.7.1. Company Overview
- 12.1.7.2. Products
- 12.1.7.3. Company Financials
- 12.1.7.4. SWOT Analysis
- 12.1.8 Sectra AB*List Not Exhaustive
- 12.1.8.1. Company Overview
- 12.1.8.2. Products
- 12.1.8.3. Company Financials
- 12.1.8.4. SWOT Analysis
- 12.1.9 Novarad Corporation
- 12.1.9.1. Company Overview
- 12.1.9.2. Products
- 12.1.9.3. Company Financials
- 12.1.9.4. SWOT Analysis
- 12.1.10 Fujifilm Holdings Corporation
- 12.1.10.1. Company Overview
- 12.1.10.2. Products
- 12.1.10.3. Company Financials
- 12.1.10.4. SWOT Analysis
- 12.1.1 Medsquare
- 12.2. Market Entropy
- 12.2.1 Company's Key Areas Served
- 12.2.2 Recent Developments
- 12.3. Company Market Share Analysis 2025
- 12.3.1 Top 5 Companies Market Share Analysis
- 12.3.2 Top 3 Companies Market Share Analysis
- 12.4. List of Potential Customers
- 13. Research Methodology
List of Figures
- Figure 1: Global Radiation Dose Management Market Revenue Breakdown (million, %) by Region 2025 & 2033
- Figure 2: North America Radiation Dose Management Market Revenue (million), by Products & Services 2025 & 2033
- Figure 3: North America Radiation Dose Management Market Revenue Share (%), by Products & Services 2025 & 2033
- Figure 4: North America Radiation Dose Management Market Revenue (million), by Modality 2025 & 2033
- Figure 5: North America Radiation Dose Management Market Revenue Share (%), by Modality 2025 & 2033
- Figure 6: North America Radiation Dose Management Market Revenue (million), by End User 2025 & 2033
- Figure 7: North America Radiation Dose Management Market Revenue Share (%), by End User 2025 & 2033
- Figure 8: North America Radiation Dose Management Market Revenue (million), by Country 2025 & 2033
- Figure 9: North America Radiation Dose Management Market Revenue Share (%), by Country 2025 & 2033
- Figure 10: Europe Radiation Dose Management Market Revenue (million), by Products & Services 2025 & 2033
- Figure 11: Europe Radiation Dose Management Market Revenue Share (%), by Products & Services 2025 & 2033
- Figure 12: Europe Radiation Dose Management Market Revenue (million), by Modality 2025 & 2033
- Figure 13: Europe Radiation Dose Management Market Revenue Share (%), by Modality 2025 & 2033
- Figure 14: Europe Radiation Dose Management Market Revenue (million), by End User 2025 & 2033
- Figure 15: Europe Radiation Dose Management Market Revenue Share (%), by End User 2025 & 2033
- Figure 16: Europe Radiation Dose Management Market Revenue (million), by Country 2025 & 2033
- Figure 17: Europe Radiation Dose Management Market Revenue Share (%), by Country 2025 & 2033
- Figure 18: Asia Pacific Radiation Dose Management Market Revenue (million), by Products & Services 2025 & 2033
- Figure 19: Asia Pacific Radiation Dose Management Market Revenue Share (%), by Products & Services 2025 & 2033
- Figure 20: Asia Pacific Radiation Dose Management Market Revenue (million), by Modality 2025 & 2033
- Figure 21: Asia Pacific Radiation Dose Management Market Revenue Share (%), by Modality 2025 & 2033
- Figure 22: Asia Pacific Radiation Dose Management Market Revenue (million), by End User 2025 & 2033
- Figure 23: Asia Pacific Radiation Dose Management Market Revenue Share (%), by End User 2025 & 2033
- Figure 24: Asia Pacific Radiation Dose Management Market Revenue (million), by Country 2025 & 2033
- Figure 25: Asia Pacific Radiation Dose Management Market Revenue Share (%), by Country 2025 & 2033
- Figure 26: Middle East and Africa Radiation Dose Management Market Revenue (million), by Products & Services 2025 & 2033
- Figure 27: Middle East and Africa Radiation Dose Management Market Revenue Share (%), by Products & Services 2025 & 2033
- Figure 28: Middle East and Africa Radiation Dose Management Market Revenue (million), by Modality 2025 & 2033
- Figure 29: Middle East and Africa Radiation Dose Management Market Revenue Share (%), by Modality 2025 & 2033
- Figure 30: Middle East and Africa Radiation Dose Management Market Revenue (million), by End User 2025 & 2033
- Figure 31: Middle East and Africa Radiation Dose Management Market Revenue Share (%), by End User 2025 & 2033
- Figure 32: Middle East and Africa Radiation Dose Management Market Revenue (million), by Country 2025 & 2033
- Figure 33: Middle East and Africa Radiation Dose Management Market Revenue Share (%), by Country 2025 & 2033
- Figure 34: South America Radiation Dose Management Market Revenue (million), by Products & Services 2025 & 2033
- Figure 35: South America Radiation Dose Management Market Revenue Share (%), by Products & Services 2025 & 2033
- Figure 36: South America Radiation Dose Management Market Revenue (million), by Modality 2025 & 2033
- Figure 37: South America Radiation Dose Management Market Revenue Share (%), by Modality 2025 & 2033
- Figure 38: South America Radiation Dose Management Market Revenue (million), by End User 2025 & 2033
- Figure 39: South America Radiation Dose Management Market Revenue Share (%), by End User 2025 & 2033
- Figure 40: South America Radiation Dose Management Market Revenue (million), by Country 2025 & 2033
- Figure 41: South America Radiation Dose Management Market Revenue Share (%), by Country 2025 & 2033
List of Tables
- Table 1: Global Radiation Dose Management Market Revenue million Forecast, by Products & Services 2020 & 2033
- Table 2: Global Radiation Dose Management Market Revenue million Forecast, by Modality 2020 & 2033
- Table 3: Global Radiation Dose Management Market Revenue million Forecast, by End User 2020 & 2033
- Table 4: Global Radiation Dose Management Market Revenue million Forecast, by Region 2020 & 2033
- Table 5: Global Radiation Dose Management Market Revenue million Forecast, by Products & Services 2020 & 2033
- Table 6: Global Radiation Dose Management Market Revenue million Forecast, by Modality 2020 & 2033
- Table 7: Global Radiation Dose Management Market Revenue million Forecast, by End User 2020 & 2033
- Table 8: Global Radiation Dose Management Market Revenue million Forecast, by Country 2020 & 2033
- Table 9: United States Radiation Dose Management Market Revenue (million) Forecast, by Application 2020 & 2033
- Table 10: Canada Radiation Dose Management Market Revenue (million) Forecast, by Application 2020 & 2033
- Table 11: Mexico Radiation Dose Management Market Revenue (million) Forecast, by Application 2020 & 2033
- Table 12: Global Radiation Dose Management Market Revenue million Forecast, by Products & Services 2020 & 2033
- Table 13: Global Radiation Dose Management Market Revenue million Forecast, by Modality 2020 & 2033
- Table 14: Global Radiation Dose Management Market Revenue million Forecast, by End User 2020 & 2033
- Table 15: Global Radiation Dose Management Market Revenue million Forecast, by Country 2020 & 2033
- Table 16: Germany Radiation Dose Management Market Revenue (million) Forecast, by Application 2020 & 2033
- Table 17: United Kingdom Radiation Dose Management Market Revenue (million) Forecast, by Application 2020 & 2033
- Table 18: France Radiation Dose Management Market Revenue (million) Forecast, by Application 2020 & 2033
- Table 19: Italy Radiation Dose Management Market Revenue (million) Forecast, by Application 2020 & 2033
- Table 20: Spain Radiation Dose Management Market Revenue (million) Forecast, by Application 2020 & 2033
- Table 21: Rest of Europe Radiation Dose Management Market Revenue (million) Forecast, by Application 2020 & 2033
- Table 22: Global Radiation Dose Management Market Revenue million Forecast, by Products & Services 2020 & 2033
- Table 23: Global Radiation Dose Management Market Revenue million Forecast, by Modality 2020 & 2033
- Table 24: Global Radiation Dose Management Market Revenue million Forecast, by End User 2020 & 2033
- Table 25: Global Radiation Dose Management Market Revenue million Forecast, by Country 2020 & 2033
- Table 26: China Radiation Dose Management Market Revenue (million) Forecast, by Application 2020 & 2033
- Table 27: Japan Radiation Dose Management Market Revenue (million) Forecast, by Application 2020 & 2033
- Table 28: India Radiation Dose Management Market Revenue (million) Forecast, by Application 2020 & 2033
- Table 29: Australia Radiation Dose Management Market Revenue (million) Forecast, by Application 2020 & 2033
- Table 30: South Korea Radiation Dose Management Market Revenue (million) Forecast, by Application 2020 & 2033
- Table 31: Rest of Asia Pacific Radiation Dose Management Market Revenue (million) Forecast, by Application 2020 & 2033
- Table 32: Global Radiation Dose Management Market Revenue million Forecast, by Products & Services 2020 & 2033
- Table 33: Global Radiation Dose Management Market Revenue million Forecast, by Modality 2020 & 2033
- Table 34: Global Radiation Dose Management Market Revenue million Forecast, by End User 2020 & 2033
- Table 35: Global Radiation Dose Management Market Revenue million Forecast, by Country 2020 & 2033
- Table 36: GCC Radiation Dose Management Market Revenue (million) Forecast, by Application 2020 & 2033
- Table 37: South Africa Radiation Dose Management Market Revenue (million) Forecast, by Application 2020 & 2033
- Table 38: Rest of Middle East and Africa Radiation Dose Management Market Revenue (million) Forecast, by Application 2020 & 2033
- Table 39: Global Radiation Dose Management Market Revenue million Forecast, by Products & Services 2020 & 2033
- Table 40: Global Radiation Dose Management Market Revenue million Forecast, by Modality 2020 & 2033
- Table 41: Global Radiation Dose Management Market Revenue million Forecast, by End User 2020 & 2033
- Table 42: Global Radiation Dose Management Market Revenue million Forecast, by Country 2020 & 2033
- Table 43: Brazil Radiation Dose Management Market Revenue (million) Forecast, by Application 2020 & 2033
- Table 44: Argentina Radiation Dose Management Market Revenue (million) Forecast, by Application 2020 & 2033
- Table 45: Rest of South America Radiation Dose Management Market Revenue (million) Forecast, by Application 2020 & 2033
Frequently Asked Questions
1. What is the projected Compound Annual Growth Rate (CAGR) of the Radiation Dose Management Market?
The projected CAGR is approximately 15.1%.
2. Which companies are prominent players in the Radiation Dose Management Market?
Key companies in the market include Medsquare, Bayer AG, PACShealth LLC, GE Healthcare, Bracco Imaging SpA, Koninklijke Philips N V, Qaelum NV, Sectra AB*List Not Exhaustive, Novarad Corporation, Fujifilm Holdings Corporation.
3. What are the main segments of the Radiation Dose Management Market?
The market segments include Products & Services, Modality, End User.
4. Can you provide details about the market size?
The market size is estimated to be USD 854.2 million as of 2022.
5. What are some drivers contributing to market growth?
; Rising Cases of Chronic Diseases Demanding Radiation Therapy; Increasing Concerns over Radiation Overexposure; Rising Awareness and Industry Initiatives for Radiation Dose Management.
6. What are the notable trends driving market growth?
Computed Tomography is Expected to Register Highest CAGR in the Modality Segment.
7. Are there any restraints impacting market growth?
; Low Adoption of radiation Dose Management Solutions in Emerging Countries.
8. Can you provide examples of recent developments in the market?
N/A
9. What pricing options are available for accessing the report?
Pricing options include single-user, multi-user, and enterprise licenses priced at USD 4750, USD 5250, and USD 8750 respectively.
10. Is the market size provided in terms of value or volume?
The market size is provided in terms of value, measured in million.
11. Are there any specific market keywords associated with the report?
Yes, the market keyword associated with the report is "Radiation Dose Management Market," which aids in identifying and referencing the specific market segment covered.
12. How do I determine which pricing option suits my needs best?
The pricing options vary based on user requirements and access needs. Individual users may opt for single-user licenses, while businesses requiring broader access may choose multi-user or enterprise licenses for cost-effective access to the report.
13. Are there any additional resources or data provided in the Radiation Dose Management Market report?
While the report offers comprehensive insights, it's advisable to review the specific contents or supplementary materials provided to ascertain if additional resources or data are available.
14. How can I stay updated on further developments or reports in the Radiation Dose Management Market?
To stay informed about further developments, trends, and reports in the Radiation Dose Management Market, consider subscribing to industry newsletters, following relevant companies and organizations, or regularly checking reputable industry news sources and publications.
Methodology
Step 1 - Identification of Relevant Samples Size from Population Database


Step 2 - Approaches for Defining Global Market Size (Value, Volume* & Price*)

Note*: In applicable scenarios
Step 3 - Data Sources
Primary Research
- Web Analytics
- Survey Reports
- Research Institute
- Latest Research Reports
- Opinion Leaders
Secondary Research
- Annual Reports
- White Paper
- Latest Press Release
- Industry Association
- Paid Database
- Investor Presentations

Step 4 - Data Triangulation
Involves using different sources of information in order to increase the validity of a study
These sources are likely to be stakeholders in a program - participants, other researchers, program staff, other community members, and so on.
Then we put all data in single framework & apply various statistical tools to find out the dynamic on the market.
During the analysis stage, feedback from the stakeholder groups would be compared to determine areas of agreement as well as areas of divergence