
Key Insights
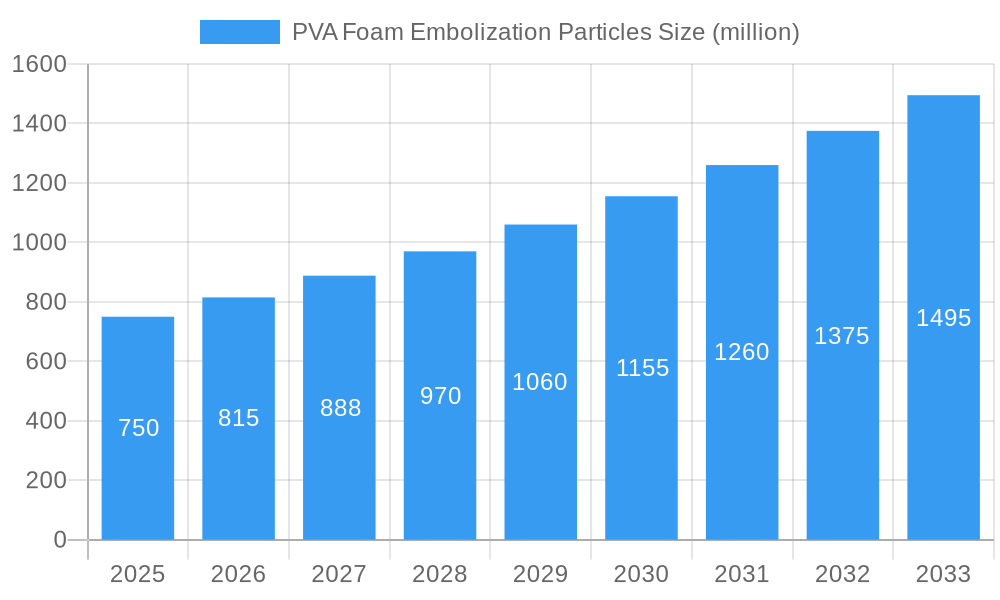
The global PVA foam embolization particles market is poised for significant growth, driven by increasing prevalence of conditions requiring embolization and advancements in minimally invasive procedures. With an estimated market size of approximately $750 million in 2025, the market is projected to expand at a Compound Annual Growth Rate (CAGR) of around 8.5% through 2033. This robust growth is underpinned by the escalating demand for effective treatments for uterine fibroids, benign prostatic hyperplasia (BPH), liver tumors, and trauma management. PVA foam particles offer a biocompatible and controllable solution for vascular occlusion, making them a preferred choice for interventional radiologists and surgeons. The expanding applications in treating these prevalent conditions, coupled with a growing preference for less invasive surgical alternatives, are key factors fueling market expansion.
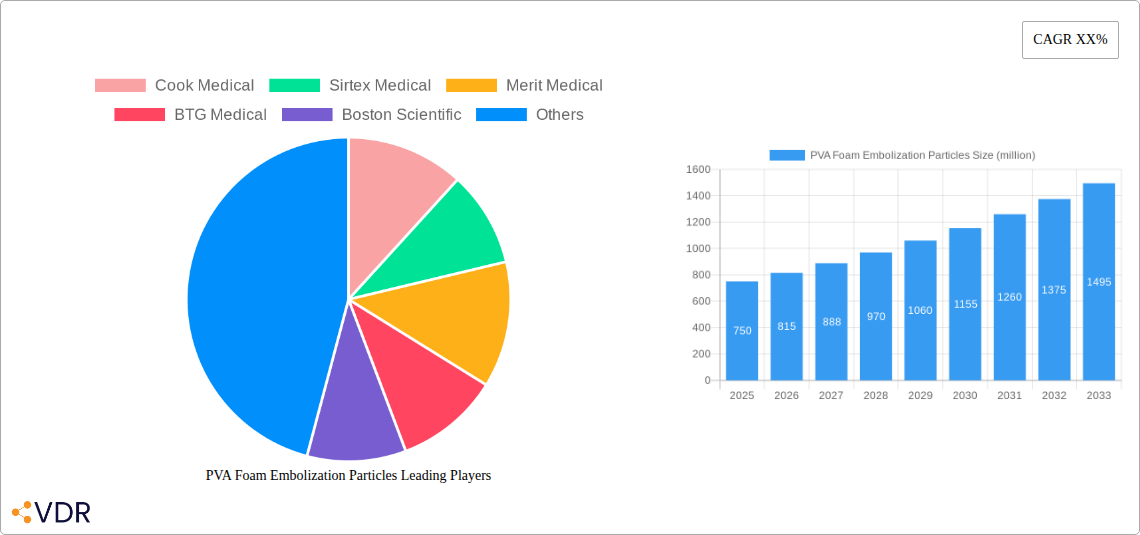
PVA Foam Embolization Particles Market Size (In Million)

The market landscape is characterized by a competitive environment with key players like Cook Medical, Sirtex Medical, Merit Medical, and Boston Scientific investing in product innovation and strategic collaborations. The demand for various particle sizes, ranging from 50µm to 2000µm, caters to diverse anatomical requirements and therapeutic goals, with mid-range particle sizes (350µm to 710µm) likely dominating due to their versatility. North America and Europe currently lead the market, owing to well-established healthcare infrastructures and higher adoption rates of interventional radiology. However, the Asia Pacific region is expected to witness the fastest growth, propelled by a large patient pool, increasing healthcare expenditure, and a growing awareness of minimally invasive treatment options. Despite the promising outlook, factors such as the availability of alternative embolization materials and stringent regulatory approvals could present moderate restraints to market expansion.
PVA Foam Embolization Particles Company Market Share
Comprehensive Report: PVA Foam Embolization Particles Market Analysis 2019-2033
This in-depth market research report provides an exhaustive analysis of the global PVA Foam Embolization Particles market, offering critical insights into market dynamics, growth trajectories, regional dominance, product landscape, key drivers, challenges, emerging opportunities, and major industry players. Covering a study period from 2019 to 2033, with a base year of 2025 and a forecast period of 2025-2033, this report is an indispensable resource for stakeholders seeking to understand and capitalize on the evolving landscape of embolization therapies.
The global PVA Foam Embolization Particles market is segmented by Application into Uterine Fibroid Embolization, Prostatic Artery Embolization (treatment for Benign Prostatic Hyperplasia or BPH), Liver Tumor Embolization, Trauma Embolization, and Others. By Type, the market is categorized into 50μm~350μm, 350μm~560μm, 560μm~710μm, 710μm~1000μm, 1000μm~1400μm, and 1400μm~2000μm.
PVA Foam Embolization Particles Market Dynamics & Structure
The PVA Foam Embolization Particles market exhibits a moderate to high concentration, with a few key players dominating the global landscape. Technological innovation is a primary driver, focusing on particle size uniformity, biocompatibility, and enhanced radiopacity for improved visualization during procedures. Regulatory frameworks, particularly FDA and CE marking, play a crucial role in market entry and product approval, influencing the pace of innovation and market penetration. Competitive product substitutes, such as hydrogels and metallic coils, present a constant challenge, necessitating continuous product development and differentiation. End-user demographics are shifting towards an aging population, increasing the prevalence of conditions like benign prostatic hyperplasia (BPH) and liver tumors, thus boosting demand. Mergers and acquisitions (M&A) are strategic tools employed by leading companies to expand their product portfolios, gain market share, and access new technologies. For instance, recent M&A activities have focused on acquiring companies with novel embolization agent technologies, with approximately 5 M&A deals recorded in the historical period 2019-2024.
- Market Concentration: Moderate to High, with key players holding substantial market share.
- Technological Innovation: Driven by particle engineering, biocompatibility, and procedural visualization.
- Regulatory Influence: FDA and CE marking are critical for market access and product approval.
- Competitive Landscape: Presence of alternative embolization agents like hydrogels and coils.
- End-User Demographics: Aging population driving demand for BPH and liver tumor treatments.
- M&A Trends: Strategic acquisitions to enhance product offerings and market reach; estimated 5 deals in the historical period.
PVA Foam Embolization Particles Growth Trends & Insights
The PVA Foam Embolization Particles market is poised for significant growth, projected to witness a Compound Annual Growth Rate (CAGR) of approximately 7.5% over the forecast period. This expansion is underpinned by an increasing global incidence of target diseases, a rising preference for minimally invasive procedures over open surgery, and advancements in interventional radiology. The market size, valued at an estimated $1.2 billion in 2025, is expected to reach approximately $1.8 billion by 2033. Adoption rates are climbing as physicians become more proficient with embolization techniques and patient awareness regarding treatment options improves. Technological disruptions, such as the development of more precise particle delivery systems and the incorporation of drug-eluting capabilities into embolization agents, are further accelerating market penetration. Consumer behavior shifts are characterized by a growing demand for outpatient procedures and faster recovery times, which embolization therapies effectively address. Market penetration for uterine fibroid embolization, a key application, is estimated to grow by 15% in the next five years. The adoption of prostatic artery embolization for BPH is projected to witness a CAGR of 8% due to its favorable risk-benefit profile.
Dominant Regions, Countries, or Segments in PVA Foam Embolization Particles
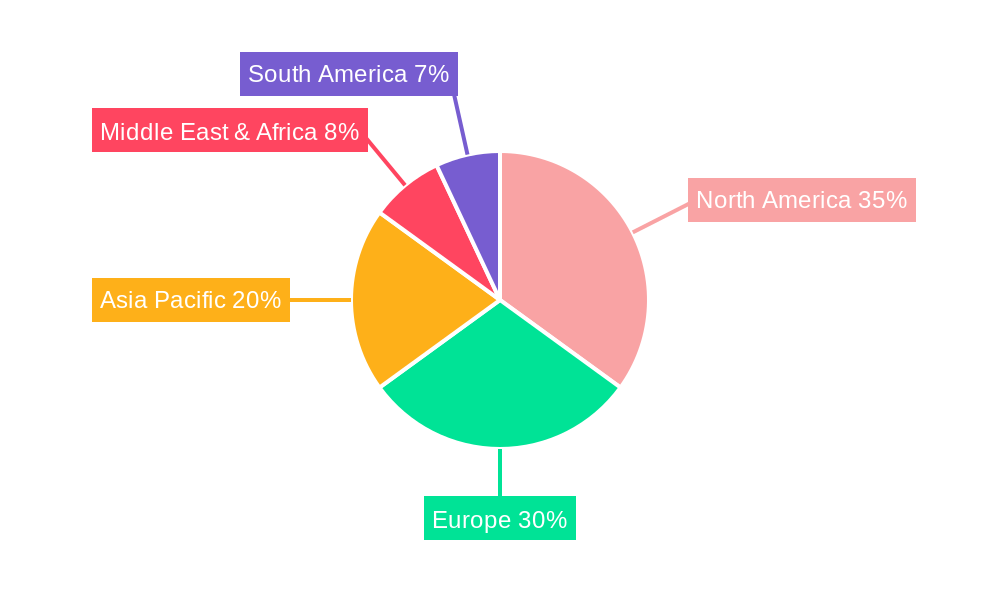
North America is currently the dominant region in the PVA Foam Embolization Particles market, driven by a high prevalence of chronic diseases, robust healthcare infrastructure, and significant investment in medical research and development. The United States, in particular, represents a substantial portion of the global market share, estimated at over 40% in 2025. The dominance is further fueled by advanced reimbursement policies and a high adoption rate of minimally invasive procedures.
- North America: Leading region due to high disease prevalence and advanced healthcare systems.
- United States: Accounted for over 40% of the global market share in 2025.
- Drivers: Strong reimbursement, advanced interventional radiology practices, and high patient acceptance of minimally invasive treatments.
- Europe: The second-largest market, with Germany, the UK, and France as key contributors.
- Drivers: Growing aging population, increasing healthcare expenditure, and a strong focus on improving treatment outcomes for benign prostatic hyperplasia and liver cancer.
- Market Share: Estimated at approximately 25% in 2025.
- Asia Pacific: Exhibiting the fastest growth potential, driven by an expanding middle class, increasing healthcare awareness, and a growing number of interventional radiologists.
- Key Markets: China and India are anticipated to witness substantial growth due to increasing investments in healthcare infrastructure and a rising demand for advanced medical treatments.
- CAGR: Projected to be around 9% over the forecast period.
- Dominant Application Segments:
- Prostatic Artery Embolization (PAE) for BPH: This segment is experiencing robust growth due to its minimally invasive nature and favorable outcomes for managing benign prostatic hyperplasia, a condition prevalent in aging male populations. Estimated market share for PAE is expected to reach 30% by 2033.
- Liver Tumor Embolization: Driven by the increasing incidence of liver cancers and the effectiveness of embolization as a palliative and therapeutic option for unresectable tumors.
- Dominant Particle Size Segment:
- 560μm~710μm and 710μm~1000μm: These particle sizes are widely preferred for their efficacy in occluding target vessels in applications like uterine fibroid embolization and liver tumor embolization, representing a significant portion of the market.
PVA Foam Embolization Particles Product Landscape
The PVA Foam Embolization Particles product landscape is characterized by continuous innovation aimed at enhancing procedural efficacy and patient outcomes. Manufacturers are focusing on developing particles with precise size distribution for predictable occlusion and minimizing non-target embolization. Advancements include the development of radiopaque particles for improved visualization under fluoroscopy and the exploration of novel formulations for targeted drug delivery alongside embolization. Unique selling propositions include the ability to achieve complete vessel stasis, biocompatibility, and ease of use by interventional radiologists. Technological advancements are also emphasizing biodegradability and controlled degradation profiles for some applications, further differentiating product offerings in this competitive market.
Key Drivers, Barriers & Challenges in PVA Foam Embolization Particles
Key Drivers:
- Rising Incidence of Target Diseases: Increasing prevalence of uterine fibroids, benign prostatic hyperplasia (BPH), and liver tumors globally fuels demand for embolization therapies.
- Shift Towards Minimally Invasive Procedures: Growing patient and physician preference for less invasive treatments with faster recovery times.
- Technological Advancements: Development of smaller, more precise particles and improved delivery systems enhances treatment efficacy and safety.
- Favorable Reimbursement Policies: Increasing coverage for embolization procedures by healthcare payers in developed markets.
Barriers & Challenges:
- Competition from Alternative Therapies: Established surgical options and emerging non-PVA embolization agents pose competitive threats.
- Regulatory Hurdles: Stringent approval processes for new medical devices can delay market entry and increase development costs.
- Physician Training and Adoption: While growing, widespread adoption requires continued education and training for interventional radiologists.
- Cost of Procedures: The overall cost of embolization procedures, including the particles, can be a barrier in some healthcare systems.
- Supply Chain Vulnerabilities: Dependence on specific raw material suppliers and global logistics can lead to supply disruptions.
Emerging Opportunities in PVA Foam Embolization Particles
Emerging opportunities in the PVA Foam Embolization Particles market lie in the expansion into underdeveloped regions with a growing need for advanced medical treatments. The development of novel drug-eluting PVA particles for targeted chemotherapy delivery in liver tumors presents a significant opportunity. Furthermore, exploring new applications for PVA foam in areas like peripheral vascular disease embolization and in veterinary medicine could unlock untapped market potential. The increasing focus on personalized medicine also opens avenues for tailored embolization particle formulations based on specific patient needs and disease characteristics.
Growth Accelerators in the PVA Foam Embolization Particles Industry
Growth accelerators in the PVA Foam Embolization Particles industry are primarily driven by ongoing technological breakthroughs in material science and delivery catheter innovation. Strategic partnerships between PVA particle manufacturers and leading medical device companies are crucial for co-development and wider market penetration. Market expansion strategies focusing on emerging economies with a burgeoning middle class and increasing healthcare expenditure will also significantly contribute to long-term growth. The continued advocacy and education efforts by professional radiology societies to promote the benefits of embolization procedures will further solidify market expansion.
Key Players Shaping the PVA Foam Embolization Particles Market
Cook Medical, Sirtex Medical, Merit Medical, BTG Medical, Boston Scientific, Terumo, HENGRUI Medical, Interface BIOmaterials, Alicon.
Notable Milestones in PVA Foam Embolization Particles Sector
- 2019: Introduction of new ultra-fine PVA particles (50μm~350μm) for enhanced precision in complex embolization procedures.
- 2020: Significant increase in demand for uterine fibroid embolization procedures, boosting PVA particle sales.
- 2021: Regulatory approval for new generation PVA particles with improved radiopacity by key regulatory bodies.
- 2022: Strategic acquisition of a smaller embolization agent developer by a major player to expand product portfolio.
- 2023: Increased research into biodegradable PVA formulations for embolization applications.
- 2024: Growing adoption of Prostatic Artery Embolization (PAE) as a first-line treatment for BPH, driving demand for specific PVA particle sizes.
In-Depth PVA Foam Embolization Particles Market Outlook
The future outlook for the PVA Foam Embolization Particles market remains exceptionally promising, fueled by an increasing global demand for effective and minimally invasive treatment options. Key growth accelerators, including persistent technological innovations in particle engineering and delivery systems, alongside strategic collaborations, will continue to propel the market forward. The expanding reach into underserved geographical markets and the exploration of novel therapeutic applications will further unlock substantial growth potential. This market is set to witness sustained expansion, driven by demographic trends and an unwavering commitment to advancing interventional radiology.
PVA Foam Embolization Particles Segmentation
-
1. Application
- 1.1. Uterine Fibroid Embolization
- 1.2. Prostatic Artery Embolization (treatment for Benign Prostatic Hyperplasia or BPH)
- 1.3. Liver Tumor Embolization
- 1.4. Trauma Embolization
- 1.5. Others
-
2. Types
- 2.1. 50μm~350μm
- 2.2. 350μm~560μm
- 2.3. 560μm~710μm
- 2.4. 710μm~1000μm
- 2.5. 1000μm~1400μm
- 2.6. 1400μm~2000μm
PVA Foam Embolization Particles Segmentation By Geography
-
1. North America
- 1.1. United States
- 1.2. Canada
- 1.3. Mexico
-
2. South America
- 2.1. Brazil
- 2.2. Argentina
- 2.3. Rest of South America
-
3. Europe
- 3.1. United Kingdom
- 3.2. Germany
- 3.3. France
- 3.4. Italy
- 3.5. Spain
- 3.6. Russia
- 3.7. Benelux
- 3.8. Nordics
- 3.9. Rest of Europe
-
4. Middle East & Africa
- 4.1. Turkey
- 4.2. Israel
- 4.3. GCC
- 4.4. North Africa
- 4.5. South Africa
- 4.6. Rest of Middle East & Africa
-
5. Asia Pacific
- 5.1. China
- 5.2. India
- 5.3. Japan
- 5.4. South Korea
- 5.5. ASEAN
- 5.6. Oceania
- 5.7. Rest of Asia Pacific
PVA Foam Embolization Particles Regional Market Share
Geographic Coverage of PVA Foam Embolization Particles
PVA Foam Embolization Particles REPORT HIGHLIGHTS
| Aspects | Details |
|---|---|
| Study Period | 2020-2034 |
| Base Year | 2025 |
| Estimated Year | 2026 |
| Forecast Period | 2026-2034 |
| Historical Period | 2020-2025 |
| Growth Rate | CAGR of XX% from 2020-2034 |
| Segmentation |
|
Table of Contents
- 1. Introduction
- 1.1. Research Scope
- 1.2. Market Segmentation
- 1.3. Research Methodology
- 1.4. Definitions and Assumptions
- 2. Executive Summary
- 2.1. Introduction
- 3. Market Dynamics
- 3.1. Introduction
- 3.2. Market Drivers
- 3.3. Market Restrains
- 3.4. Market Trends
- 4. Market Factor Analysis
- 4.1. Porters Five Forces
- 4.2. Supply/Value Chain
- 4.3. PESTEL analysis
- 4.4. Market Entropy
- 4.5. Patent/Trademark Analysis
- 5. Global PVA Foam Embolization Particles Analysis, Insights and Forecast, 2020-2032
- 5.1. Market Analysis, Insights and Forecast - by Application
- 5.1.1. Uterine Fibroid Embolization
- 5.1.2. Prostatic Artery Embolization (treatment for Benign Prostatic Hyperplasia or BPH)
- 5.1.3. Liver Tumor Embolization
- 5.1.4. Trauma Embolization
- 5.1.5. Others
- 5.2. Market Analysis, Insights and Forecast - by Types
- 5.2.1. 50μm~350μm
- 5.2.2. 350μm~560μm
- 5.2.3. 560μm~710μm
- 5.2.4. 710μm~1000μm
- 5.2.5. 1000μm~1400μm
- 5.2.6. 1400μm~2000μm
- 5.3. Market Analysis, Insights and Forecast - by Region
- 5.3.1. North America
- 5.3.2. South America
- 5.3.3. Europe
- 5.3.4. Middle East & Africa
- 5.3.5. Asia Pacific
- 5.1. Market Analysis, Insights and Forecast - by Application
- 6. North America PVA Foam Embolization Particles Analysis, Insights and Forecast, 2020-2032
- 6.1. Market Analysis, Insights and Forecast - by Application
- 6.1.1. Uterine Fibroid Embolization
- 6.1.2. Prostatic Artery Embolization (treatment for Benign Prostatic Hyperplasia or BPH)
- 6.1.3. Liver Tumor Embolization
- 6.1.4. Trauma Embolization
- 6.1.5. Others
- 6.2. Market Analysis, Insights and Forecast - by Types
- 6.2.1. 50μm~350μm
- 6.2.2. 350μm~560μm
- 6.2.3. 560μm~710μm
- 6.2.4. 710μm~1000μm
- 6.2.5. 1000μm~1400μm
- 6.2.6. 1400μm~2000μm
- 6.1. Market Analysis, Insights and Forecast - by Application
- 7. South America PVA Foam Embolization Particles Analysis, Insights and Forecast, 2020-2032
- 7.1. Market Analysis, Insights and Forecast - by Application
- 7.1.1. Uterine Fibroid Embolization
- 7.1.2. Prostatic Artery Embolization (treatment for Benign Prostatic Hyperplasia or BPH)
- 7.1.3. Liver Tumor Embolization
- 7.1.4. Trauma Embolization
- 7.1.5. Others
- 7.2. Market Analysis, Insights and Forecast - by Types
- 7.2.1. 50μm~350μm
- 7.2.2. 350μm~560μm
- 7.2.3. 560μm~710μm
- 7.2.4. 710μm~1000μm
- 7.2.5. 1000μm~1400μm
- 7.2.6. 1400μm~2000μm
- 7.1. Market Analysis, Insights and Forecast - by Application
- 8. Europe PVA Foam Embolization Particles Analysis, Insights and Forecast, 2020-2032
- 8.1. Market Analysis, Insights and Forecast - by Application
- 8.1.1. Uterine Fibroid Embolization
- 8.1.2. Prostatic Artery Embolization (treatment for Benign Prostatic Hyperplasia or BPH)
- 8.1.3. Liver Tumor Embolization
- 8.1.4. Trauma Embolization
- 8.1.5. Others
- 8.2. Market Analysis, Insights and Forecast - by Types
- 8.2.1. 50μm~350μm
- 8.2.2. 350μm~560μm
- 8.2.3. 560μm~710μm
- 8.2.4. 710μm~1000μm
- 8.2.5. 1000μm~1400μm
- 8.2.6. 1400μm~2000μm
- 8.1. Market Analysis, Insights and Forecast - by Application
- 9. Middle East & Africa PVA Foam Embolization Particles Analysis, Insights and Forecast, 2020-2032
- 9.1. Market Analysis, Insights and Forecast - by Application
- 9.1.1. Uterine Fibroid Embolization
- 9.1.2. Prostatic Artery Embolization (treatment for Benign Prostatic Hyperplasia or BPH)
- 9.1.3. Liver Tumor Embolization
- 9.1.4. Trauma Embolization
- 9.1.5. Others
- 9.2. Market Analysis, Insights and Forecast - by Types
- 9.2.1. 50μm~350μm
- 9.2.2. 350μm~560μm
- 9.2.3. 560μm~710μm
- 9.2.4. 710μm~1000μm
- 9.2.5. 1000μm~1400μm
- 9.2.6. 1400μm~2000μm
- 9.1. Market Analysis, Insights and Forecast - by Application
- 10. Asia Pacific PVA Foam Embolization Particles Analysis, Insights and Forecast, 2020-2032
- 10.1. Market Analysis, Insights and Forecast - by Application
- 10.1.1. Uterine Fibroid Embolization
- 10.1.2. Prostatic Artery Embolization (treatment for Benign Prostatic Hyperplasia or BPH)
- 10.1.3. Liver Tumor Embolization
- 10.1.4. Trauma Embolization
- 10.1.5. Others
- 10.2. Market Analysis, Insights and Forecast - by Types
- 10.2.1. 50μm~350μm
- 10.2.2. 350μm~560μm
- 10.2.3. 560μm~710μm
- 10.2.4. 710μm~1000μm
- 10.2.5. 1000μm~1400μm
- 10.2.6. 1400μm~2000μm
- 10.1. Market Analysis, Insights and Forecast - by Application
- 11. Competitive Analysis
- 11.1. Global Market Share Analysis 2025
- 11.2. Company Profiles
- 11.2.1 Cook Medical
- 11.2.1.1. Overview
- 11.2.1.2. Products
- 11.2.1.3. SWOT Analysis
- 11.2.1.4. Recent Developments
- 11.2.1.5. Financials (Based on Availability)
- 11.2.2 Sirtex Medical
- 11.2.2.1. Overview
- 11.2.2.2. Products
- 11.2.2.3. SWOT Analysis
- 11.2.2.4. Recent Developments
- 11.2.2.5. Financials (Based on Availability)
- 11.2.3 Merit Medical
- 11.2.3.1. Overview
- 11.2.3.2. Products
- 11.2.3.3. SWOT Analysis
- 11.2.3.4. Recent Developments
- 11.2.3.5. Financials (Based on Availability)
- 11.2.4 BTG Medical
- 11.2.4.1. Overview
- 11.2.4.2. Products
- 11.2.4.3. SWOT Analysis
- 11.2.4.4. Recent Developments
- 11.2.4.5. Financials (Based on Availability)
- 11.2.5 Boston Scientific
- 11.2.5.1. Overview
- 11.2.5.2. Products
- 11.2.5.3. SWOT Analysis
- 11.2.5.4. Recent Developments
- 11.2.5.5. Financials (Based on Availability)
- 11.2.6 Terumo
- 11.2.6.1. Overview
- 11.2.6.2. Products
- 11.2.6.3. SWOT Analysis
- 11.2.6.4. Recent Developments
- 11.2.6.5. Financials (Based on Availability)
- 11.2.7 HENGRUI Medical
- 11.2.7.1. Overview
- 11.2.7.2. Products
- 11.2.7.3. SWOT Analysis
- 11.2.7.4. Recent Developments
- 11.2.7.5. Financials (Based on Availability)
- 11.2.8 INterface BIOmaterials
- 11.2.8.1. Overview
- 11.2.8.2. Products
- 11.2.8.3. SWOT Analysis
- 11.2.8.4. Recent Developments
- 11.2.8.5. Financials (Based on Availability)
- 11.2.9 Alicon
- 11.2.9.1. Overview
- 11.2.9.2. Products
- 11.2.9.3. SWOT Analysis
- 11.2.9.4. Recent Developments
- 11.2.9.5. Financials (Based on Availability)
- 11.2.1 Cook Medical
List of Figures
- Figure 1: Global PVA Foam Embolization Particles Revenue Breakdown (million, %) by Region 2025 & 2033
- Figure 2: North America PVA Foam Embolization Particles Revenue (million), by Application 2025 & 2033
- Figure 3: North America PVA Foam Embolization Particles Revenue Share (%), by Application 2025 & 2033
- Figure 4: North America PVA Foam Embolization Particles Revenue (million), by Types 2025 & 2033
- Figure 5: North America PVA Foam Embolization Particles Revenue Share (%), by Types 2025 & 2033
- Figure 6: North America PVA Foam Embolization Particles Revenue (million), by Country 2025 & 2033
- Figure 7: North America PVA Foam Embolization Particles Revenue Share (%), by Country 2025 & 2033
- Figure 8: South America PVA Foam Embolization Particles Revenue (million), by Application 2025 & 2033
- Figure 9: South America PVA Foam Embolization Particles Revenue Share (%), by Application 2025 & 2033
- Figure 10: South America PVA Foam Embolization Particles Revenue (million), by Types 2025 & 2033
- Figure 11: South America PVA Foam Embolization Particles Revenue Share (%), by Types 2025 & 2033
- Figure 12: South America PVA Foam Embolization Particles Revenue (million), by Country 2025 & 2033
- Figure 13: South America PVA Foam Embolization Particles Revenue Share (%), by Country 2025 & 2033
- Figure 14: Europe PVA Foam Embolization Particles Revenue (million), by Application 2025 & 2033
- Figure 15: Europe PVA Foam Embolization Particles Revenue Share (%), by Application 2025 & 2033
- Figure 16: Europe PVA Foam Embolization Particles Revenue (million), by Types 2025 & 2033
- Figure 17: Europe PVA Foam Embolization Particles Revenue Share (%), by Types 2025 & 2033
- Figure 18: Europe PVA Foam Embolization Particles Revenue (million), by Country 2025 & 2033
- Figure 19: Europe PVA Foam Embolization Particles Revenue Share (%), by Country 2025 & 2033
- Figure 20: Middle East & Africa PVA Foam Embolization Particles Revenue (million), by Application 2025 & 2033
- Figure 21: Middle East & Africa PVA Foam Embolization Particles Revenue Share (%), by Application 2025 & 2033
- Figure 22: Middle East & Africa PVA Foam Embolization Particles Revenue (million), by Types 2025 & 2033
- Figure 23: Middle East & Africa PVA Foam Embolization Particles Revenue Share (%), by Types 2025 & 2033
- Figure 24: Middle East & Africa PVA Foam Embolization Particles Revenue (million), by Country 2025 & 2033
- Figure 25: Middle East & Africa PVA Foam Embolization Particles Revenue Share (%), by Country 2025 & 2033
- Figure 26: Asia Pacific PVA Foam Embolization Particles Revenue (million), by Application 2025 & 2033
- Figure 27: Asia Pacific PVA Foam Embolization Particles Revenue Share (%), by Application 2025 & 2033
- Figure 28: Asia Pacific PVA Foam Embolization Particles Revenue (million), by Types 2025 & 2033
- Figure 29: Asia Pacific PVA Foam Embolization Particles Revenue Share (%), by Types 2025 & 2033
- Figure 30: Asia Pacific PVA Foam Embolization Particles Revenue (million), by Country 2025 & 2033
- Figure 31: Asia Pacific PVA Foam Embolization Particles Revenue Share (%), by Country 2025 & 2033
List of Tables
- Table 1: Global PVA Foam Embolization Particles Revenue million Forecast, by Application 2020 & 2033
- Table 2: Global PVA Foam Embolization Particles Revenue million Forecast, by Types 2020 & 2033
- Table 3: Global PVA Foam Embolization Particles Revenue million Forecast, by Region 2020 & 2033
- Table 4: Global PVA Foam Embolization Particles Revenue million Forecast, by Application 2020 & 2033
- Table 5: Global PVA Foam Embolization Particles Revenue million Forecast, by Types 2020 & 2033
- Table 6: Global PVA Foam Embolization Particles Revenue million Forecast, by Country 2020 & 2033
- Table 7: United States PVA Foam Embolization Particles Revenue (million) Forecast, by Application 2020 & 2033
- Table 8: Canada PVA Foam Embolization Particles Revenue (million) Forecast, by Application 2020 & 2033
- Table 9: Mexico PVA Foam Embolization Particles Revenue (million) Forecast, by Application 2020 & 2033
- Table 10: Global PVA Foam Embolization Particles Revenue million Forecast, by Application 2020 & 2033
- Table 11: Global PVA Foam Embolization Particles Revenue million Forecast, by Types 2020 & 2033
- Table 12: Global PVA Foam Embolization Particles Revenue million Forecast, by Country 2020 & 2033
- Table 13: Brazil PVA Foam Embolization Particles Revenue (million) Forecast, by Application 2020 & 2033
- Table 14: Argentina PVA Foam Embolization Particles Revenue (million) Forecast, by Application 2020 & 2033
- Table 15: Rest of South America PVA Foam Embolization Particles Revenue (million) Forecast, by Application 2020 & 2033
- Table 16: Global PVA Foam Embolization Particles Revenue million Forecast, by Application 2020 & 2033
- Table 17: Global PVA Foam Embolization Particles Revenue million Forecast, by Types 2020 & 2033
- Table 18: Global PVA Foam Embolization Particles Revenue million Forecast, by Country 2020 & 2033
- Table 19: United Kingdom PVA Foam Embolization Particles Revenue (million) Forecast, by Application 2020 & 2033
- Table 20: Germany PVA Foam Embolization Particles Revenue (million) Forecast, by Application 2020 & 2033
- Table 21: France PVA Foam Embolization Particles Revenue (million) Forecast, by Application 2020 & 2033
- Table 22: Italy PVA Foam Embolization Particles Revenue (million) Forecast, by Application 2020 & 2033
- Table 23: Spain PVA Foam Embolization Particles Revenue (million) Forecast, by Application 2020 & 2033
- Table 24: Russia PVA Foam Embolization Particles Revenue (million) Forecast, by Application 2020 & 2033
- Table 25: Benelux PVA Foam Embolization Particles Revenue (million) Forecast, by Application 2020 & 2033
- Table 26: Nordics PVA Foam Embolization Particles Revenue (million) Forecast, by Application 2020 & 2033
- Table 27: Rest of Europe PVA Foam Embolization Particles Revenue (million) Forecast, by Application 2020 & 2033
- Table 28: Global PVA Foam Embolization Particles Revenue million Forecast, by Application 2020 & 2033
- Table 29: Global PVA Foam Embolization Particles Revenue million Forecast, by Types 2020 & 2033
- Table 30: Global PVA Foam Embolization Particles Revenue million Forecast, by Country 2020 & 2033
- Table 31: Turkey PVA Foam Embolization Particles Revenue (million) Forecast, by Application 2020 & 2033
- Table 32: Israel PVA Foam Embolization Particles Revenue (million) Forecast, by Application 2020 & 2033
- Table 33: GCC PVA Foam Embolization Particles Revenue (million) Forecast, by Application 2020 & 2033
- Table 34: North Africa PVA Foam Embolization Particles Revenue (million) Forecast, by Application 2020 & 2033
- Table 35: South Africa PVA Foam Embolization Particles Revenue (million) Forecast, by Application 2020 & 2033
- Table 36: Rest of Middle East & Africa PVA Foam Embolization Particles Revenue (million) Forecast, by Application 2020 & 2033
- Table 37: Global PVA Foam Embolization Particles Revenue million Forecast, by Application 2020 & 2033
- Table 38: Global PVA Foam Embolization Particles Revenue million Forecast, by Types 2020 & 2033
- Table 39: Global PVA Foam Embolization Particles Revenue million Forecast, by Country 2020 & 2033
- Table 40: China PVA Foam Embolization Particles Revenue (million) Forecast, by Application 2020 & 2033
- Table 41: India PVA Foam Embolization Particles Revenue (million) Forecast, by Application 2020 & 2033
- Table 42: Japan PVA Foam Embolization Particles Revenue (million) Forecast, by Application 2020 & 2033
- Table 43: South Korea PVA Foam Embolization Particles Revenue (million) Forecast, by Application 2020 & 2033
- Table 44: ASEAN PVA Foam Embolization Particles Revenue (million) Forecast, by Application 2020 & 2033
- Table 45: Oceania PVA Foam Embolization Particles Revenue (million) Forecast, by Application 2020 & 2033
- Table 46: Rest of Asia Pacific PVA Foam Embolization Particles Revenue (million) Forecast, by Application 2020 & 2033
Frequently Asked Questions
1. What is the projected Compound Annual Growth Rate (CAGR) of the PVA Foam Embolization Particles?
The projected CAGR is approximately XX%.
2. Which companies are prominent players in the PVA Foam Embolization Particles?
Key companies in the market include Cook Medical, Sirtex Medical, Merit Medical, BTG Medical, Boston Scientific, Terumo, HENGRUI Medical, INterface BIOmaterials, Alicon.
3. What are the main segments of the PVA Foam Embolization Particles?
The market segments include Application, Types.
4. Can you provide details about the market size?
The market size is estimated to be USD XXX million as of 2022.
5. What are some drivers contributing to market growth?
N/A
6. What are the notable trends driving market growth?
N/A
7. Are there any restraints impacting market growth?
N/A
8. Can you provide examples of recent developments in the market?
N/A
9. What pricing options are available for accessing the report?
Pricing options include single-user, multi-user, and enterprise licenses priced at USD 5600.00, USD 8400.00, and USD 11200.00 respectively.
10. Is the market size provided in terms of value or volume?
The market size is provided in terms of value, measured in million.
11. Are there any specific market keywords associated with the report?
Yes, the market keyword associated with the report is "PVA Foam Embolization Particles," which aids in identifying and referencing the specific market segment covered.
12. How do I determine which pricing option suits my needs best?
The pricing options vary based on user requirements and access needs. Individual users may opt for single-user licenses, while businesses requiring broader access may choose multi-user or enterprise licenses for cost-effective access to the report.
13. Are there any additional resources or data provided in the PVA Foam Embolization Particles report?
While the report offers comprehensive insights, it's advisable to review the specific contents or supplementary materials provided to ascertain if additional resources or data are available.
14. How can I stay updated on further developments or reports in the PVA Foam Embolization Particles?
To stay informed about further developments, trends, and reports in the PVA Foam Embolization Particles, consider subscribing to industry newsletters, following relevant companies and organizations, or regularly checking reputable industry news sources and publications.
Methodology
Step 1 - Identification of Relevant Samples Size from Population Database


Step 2 - Approaches for Defining Global Market Size (Value, Volume* & Price*)

Note*: In applicable scenarios
Step 3 - Data Sources
Primary Research
- Web Analytics
- Survey Reports
- Research Institute
- Latest Research Reports
- Opinion Leaders
Secondary Research
- Annual Reports
- White Paper
- Latest Press Release
- Industry Association
- Paid Database
- Investor Presentations

Step 4 - Data Triangulation
Involves using different sources of information in order to increase the validity of a study
These sources are likely to be stakeholders in a program - participants, other researchers, program staff, other community members, and so on.
Then we put all data in single framework & apply various statistical tools to find out the dynamic on the market.
During the analysis stage, feedback from the stakeholder groups would be compared to determine areas of agreement as well as areas of divergence

