

Key Insights
The global Pumps Market is poised for steady expansion, projected to reach an estimated USD 110.22 million by 2025, growing at a Compound Annual Growth Rate (CAGR) of 3.60% through 2033. This growth is underpinned by robust demand across key industrial sectors. The Oil and Gas industry continues to be a significant consumer, driven by upstream exploration and production activities, as well as the refining and transportation of hydrocarbons. Similarly, the burgeoning need for clean water and efficient wastewater management is fueling demand in the Water and Wastewater segment. The Chemicals and Petrochemicals industry also presents a substantial market, with ongoing investments in new facilities and the expansion of existing ones requiring advanced pumping solutions.
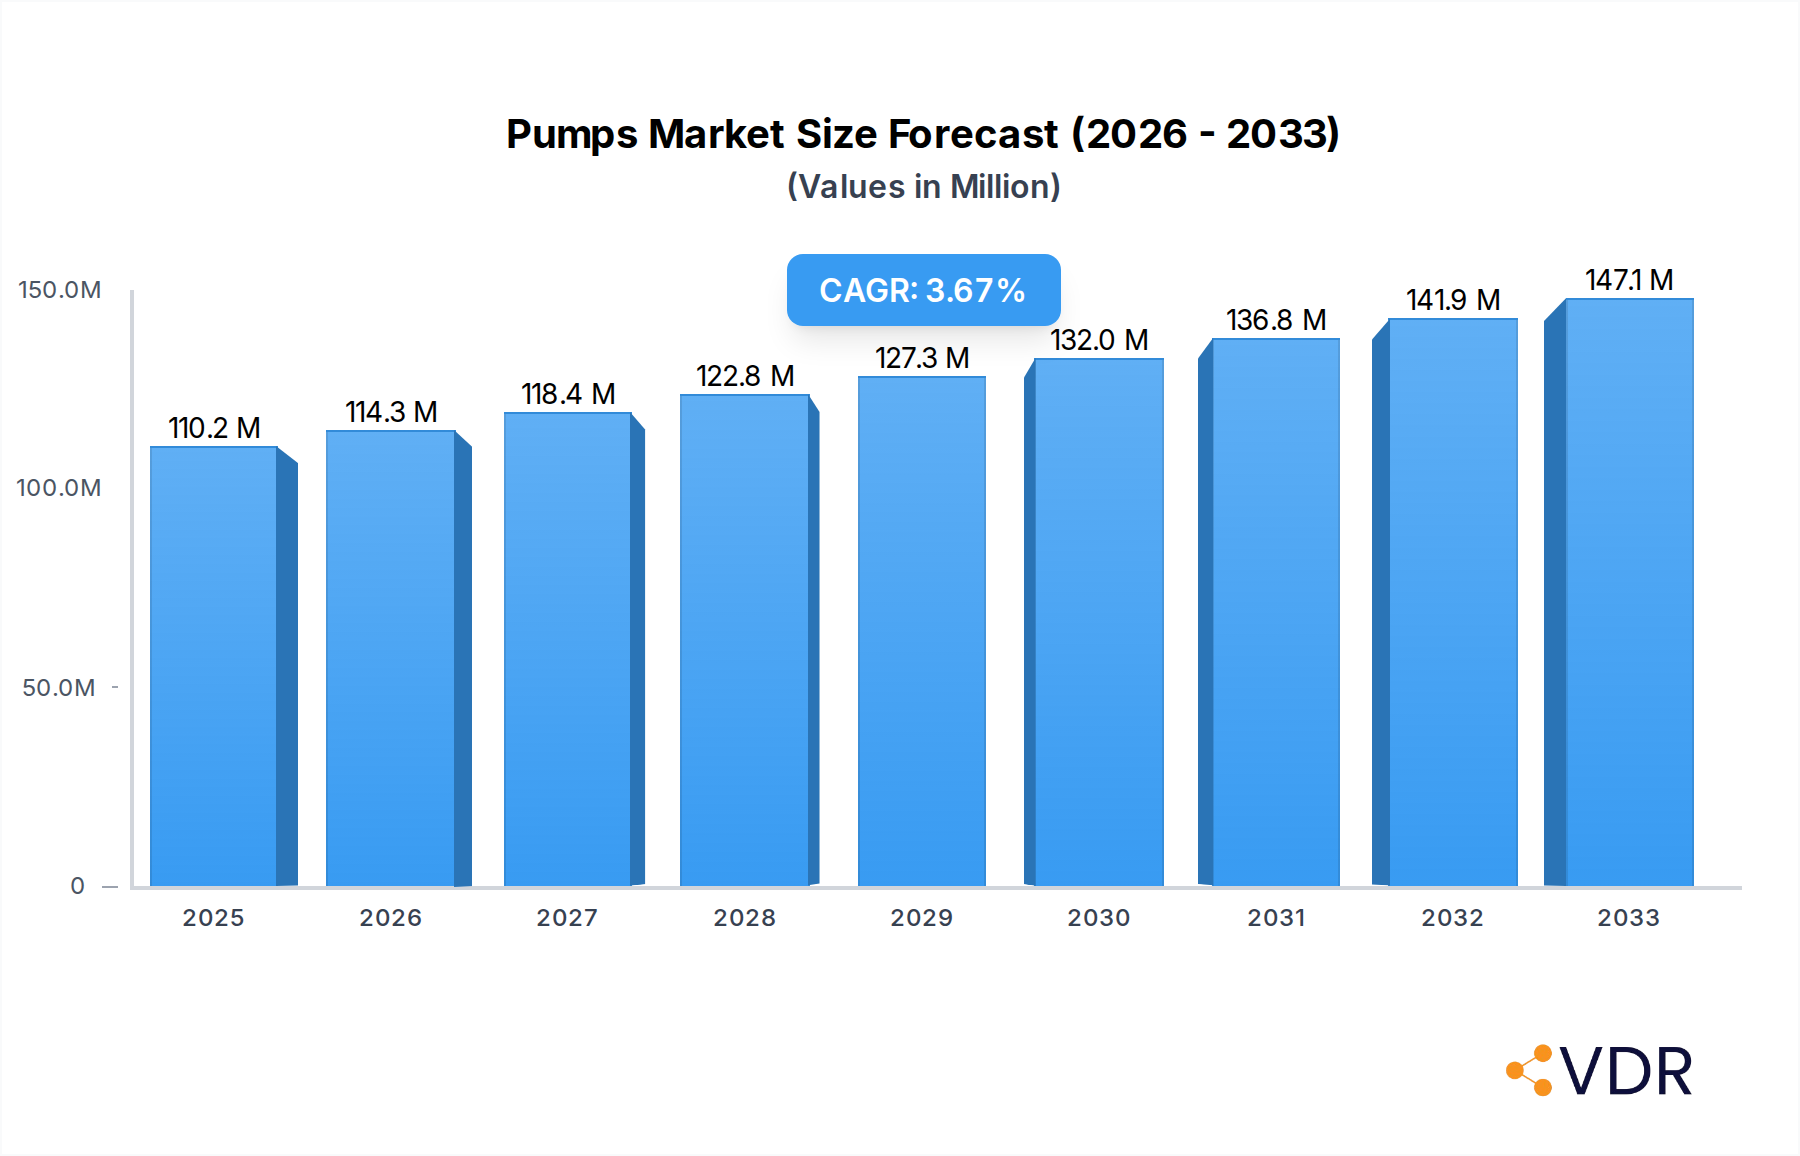
Pumps Market Market Size (In Million)
The market's trajectory is further supported by advancements in pump technology, including the development of energy-efficient and intelligent pumping systems that reduce operational costs and environmental impact. The Mining Industry, with its increasing mechanization and the need to extract resources from more challenging environments, is another key driver. While growth is generally positive, the market faces certain restraints. These may include stringent environmental regulations that necessitate the adoption of costly, compliant technologies, and the volatility of raw material prices that can impact manufacturing costs. However, emerging economies in the Asia Pacific region, particularly China and India, are anticipated to exhibit the highest growth rates due to rapid industrialization and infrastructure development, presenting significant opportunities for market players.

Pumps Market Company Market Share
This in-depth report provides a comprehensive analysis of the global Pumps Market, a critical sector supporting diverse industrial operations. Delving into market dynamics, growth trends, regional dominance, product innovations, key drivers, emerging opportunities, and competitive landscapes, this report offers actionable insights for stakeholders. We analyze the market in detail, from Centrifugal Pumps and Positive Displacement Pumps to their applications across Oil and Gas, Water and Wastewater, Chemicals and Petrochemicals, Mining Industry, Power Generation, and other vital end-user industries. With a robust Base Year of 2025 and a detailed Forecast Period of 2025–2033, this report quantifies market evolution and forecasts future trajectories, presenting all values in Million Units.
Pumps Market Market Dynamics & Structure
The global Pumps Market is characterized by a dynamic interplay of forces shaping its structure and future trajectory. Market concentration varies across segments, with specialized applications often exhibiting higher levels of focus. Technological innovation is a primary driver, with advancements in energy efficiency, smart monitoring capabilities, and material science continuously pushing the boundaries of pump performance. Regulatory frameworks, particularly concerning environmental standards and safety protocols, play a significant role in dictating product development and adoption rates, especially within the Water and Wastewater and Chemicals and Petrochemicals sectors. Competitive product substitutes, while present, often cater to niche requirements, with the core functionality of pumping liquids remaining paramount. End-user demographics are a crucial consideration, with the burgeoning infrastructure development in emerging economies and the ongoing maintenance and upgrade requirements in mature industrial bases influencing demand patterns. Mergers and acquisitions (M&A) trends are a notable aspect of the market's evolution, with larger players acquiring smaller, innovative firms to expand their portfolios and market reach. For instance, the acquisition of Precision Pump & Valve by Motion & Control Enterprises in February 2023 exemplifies the consolidation driven by a desire to enhance service offerings in key sectors like Oil and Gas.
- Market Concentration: Varies significantly by pump type and end-user segment, with specialized markets showing higher concentration.
- Technological Innovation Drivers: Energy efficiency, IoT integration, advanced materials, and predictive maintenance technologies are key catalysts.
- Regulatory Frameworks: Stringent environmental regulations (e.g., emissions, water discharge) and safety standards are critical influences.
- Competitive Product Substitutes: While alternatives exist for specific tasks, core pump functionality remains indispensable.
- End-User Demographics: Influenced by industrial growth, infrastructure investment, and maintenance cycles across diverse sectors.
- M&A Trends: Consolidation is ongoing, driven by the pursuit of market share, technological acquisition, and expanded service capabilities.
Pumps Market Growth Trends & Insights
The Pumps Market is poised for significant growth, driven by a confluence of escalating industrial activities, critical infrastructure development, and a persistent need for efficient fluid management across the globe. The market size is projected to witness a substantial increase, fueled by adoption rates that are steadily climbing in response to technological advancements and evolving industry demands. Technological disruptions are a constant, with the integration of smart technologies, such as IoT sensors and AI-powered diagnostics, revolutionizing pump performance monitoring, predictive maintenance, and operational efficiency. This shift towards intelligent pumping systems is a key differentiator, enabling reduced downtime and optimized energy consumption, particularly appealing to sectors like Oil and Gas and Power Generation. Consumer behavior, or rather end-user behavior, is also evolving, with a greater emphasis on total cost of ownership, lifecycle reliability, and adherence to stringent environmental mandates. This necessitates a move towards more sustainable and energy-efficient pump solutions.
The Pumps Market CAGR is estimated to be robust, reflecting the sustained demand from various end-use industries. For example, the Water and Wastewater sector, a perpetual growth engine, requires continuous investment in infrastructure and upgrades, thereby driving consistent demand for both centrifugal and positive displacement pumps. Similarly, the Chemicals and Petrochemicals industry, with its complex and often corrosive fluid handling needs, relies heavily on specialized pump technologies that offer high reliability and safety. The Mining Industry, while cyclical, presents significant opportunities due to its need for robust pumps capable of handling abrasive slurries and large volumes of water. Power Generation, whether traditional or renewable, also exhibits stable demand for pumps in cooling systems, water circulation, and other critical processes. The overall market penetration of advanced pumping solutions is increasing as industries recognize the long-term economic and operational benefits. The historical period from 2019 to 2024 laid the groundwork for this expansion, with the base year of 2025 serving as a pivotal point for accelerated growth in the subsequent forecast period of 2025–2033. The estimated year of 2025 marks the beginning of a period characterized by heightened innovation and strategic investments in pumping technologies.
XXX (Placeholder for specific market size value in Million Units) in the Pumps Market is expected to see a significant upward trend. The adoption rate of advanced pump technologies, particularly those incorporating smart features and enhanced energy efficiency, is expected to rise considerably across all major end-user segments. The Oil and Gas industry, despite fluctuations, continues to be a major consumer, with ongoing exploration, production, and refining activities demanding reliable pumping solutions. The Water and Wastewater segment is a consistent driver of growth, propelled by the global imperative for clean water access and effective wastewater management, leading to substantial investments in infrastructure and pump replacements. The Chemicals and Petrochemicals sector relies on pumps for the safe and efficient transfer of a wide array of fluids, including hazardous and corrosive substances, necessitating specialized and high-performance equipment. In the Mining Industry, the demand for pumps is linked to dewatering, material transport, and process fluid handling, often requiring rugged and high-capacity solutions. Power Generation facilities utilize pumps for cooling, steam generation, and water management, ensuring operational continuity. The Other End Users category, encompassing sectors like food and beverage, pharmaceuticals, and general industrial applications, also contributes to the overall market expansion.
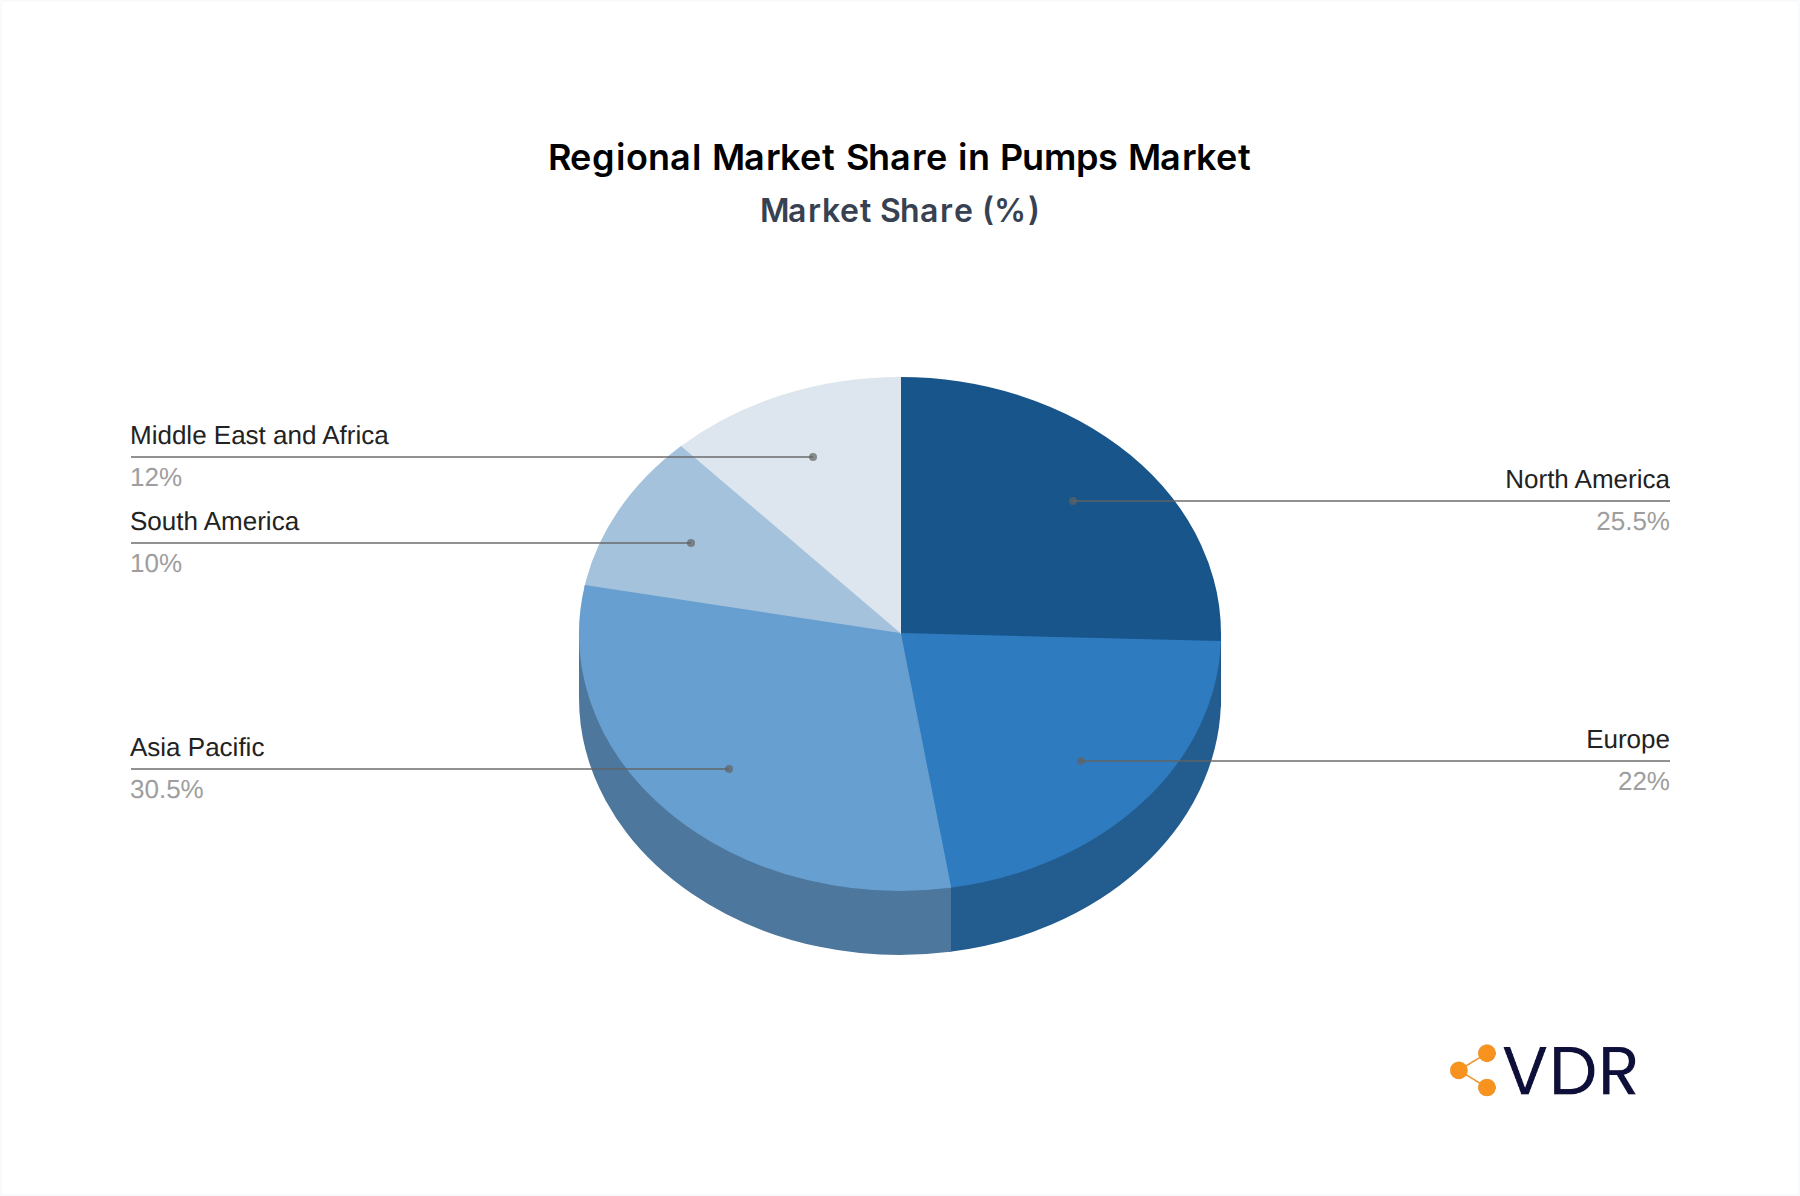
Dominant Regions, Countries, or Segments in Pumps Market
The global Pumps Market is characterized by distinct regional strengths and segment dominance, driven by varying industrial landscapes, economic policies, and infrastructure development. North America, particularly the United States, and Asia Pacific, with its rapidly industrializing economies like China and India, are consistently identified as leading regions. In North America, the mature Oil and Gas sector, coupled with substantial investments in Water and Wastewater infrastructure and a strong manufacturing base, fuels robust demand for a wide array of pumps. The regulatory environment also encourages the adoption of energy-efficient and advanced pumping technologies.
In the Asia Pacific region, rapid industrialization across sectors like Chemicals and Petrochemicals, Mining Industry, and Power Generation is a primary growth catalyst. Government initiatives focused on infrastructure development, including water treatment and energy projects, further bolster the demand for pumps. China, as a manufacturing powerhouse, and India, with its burgeoning industrial and infrastructure needs, are pivotal markets within this region.
Analyzing segments, Centrifugal Pumps generally hold the largest market share due to their versatility, wide range of applications, and cost-effectiveness for high-volume fluid transfer across numerous industries. However, Positive Displacement Pumps are critical in applications requiring precise flow control, high pressures, or the handling of viscous fluids, such as in the Chemicals and Petrochemicals and certain Oil and Gas upstream operations.
- Leading Regions: North America (driven by Oil & Gas, Water & Wastewater, Manufacturing) and Asia Pacific (driven by rapid industrialization, infrastructure development).
- Key Countries: United States, China, India, Germany, Japan.
- Dominant Segment (Type): Centrifugal Pumps due to broad applicability and volume.
- Dominant Segment (End User): Oil and Gas, Water and Wastewater, and Chemicals and Petrochemicals consistently represent the largest end-user segments.
- Drivers of Dominance: Economic policies supporting industrial growth, significant infrastructure investment, presence of major manufacturing hubs, and stringent environmental regulations.
- Growth Potential: Emerging economies in Asia Pacific and Africa present significant untapped growth potential due to ongoing infrastructure projects and industrial expansion.
Pumps Market Product Landscape
The Pumps Market product landscape is characterized by continuous innovation aimed at enhancing efficiency, reliability, and sustainability. Centrifugal pumps, the workhorses of the industry, are evolving with improved hydraulic designs, advanced materials for wear resistance, and integrated variable frequency drives (VFDs) for optimized energy consumption. Positive displacement pumps, including rotary and reciprocating types, are seeing advancements in sealing technologies, material compatibility for aggressive media, and modular designs for ease of maintenance. Applications span from the high-pressure, high-volume requirements in the Oil and Gas sector to the precise dosing needs in the Chemicals and Petrochemicals industry and the critical dewatering operations in the Mining Industry. Smart pumps, equipped with IoT sensors, are emerging as a significant trend, offering real-time performance monitoring, predictive maintenance alerts, and remote diagnostics, thereby reducing downtime and operational costs. The unique selling propositions of these advanced pumps lie in their ability to deliver superior energy efficiency, extended service life, and enhanced operational safety, catering to the increasingly stringent demands of various end-user industries.
Key Drivers, Barriers & Challenges in Pumps Market
The Pumps Market is propelled by several key drivers, including the increasing global demand for water and wastewater treatment, the expansion of the Oil and Gas industry, and the growth of manufacturing and infrastructure development worldwide. Technological advancements, such as the integration of smart technologies and the development of energy-efficient pumps, are also significant growth accelerators. Government initiatives supporting infrastructure development and environmental regulations promoting water conservation and pollution control further bolster market growth.
- Key Drivers:
- Growing demand for clean water and effective wastewater management.
- Expansion and maintenance needs in the Oil and Gas sector.
- Industrialization and infrastructure development globally.
- Technological innovation in energy efficiency and smart pump solutions.
- Stringent environmental regulations and sustainability mandates.
Conversely, the market faces several barriers and challenges that can impede its growth. Intense price competition among manufacturers, particularly for standard pump models, can limit profit margins. Fluctuations in raw material prices can impact production costs. Additionally, the complexity of certain industrial applications necessitates highly specialized and often expensive pump solutions, which can be a barrier to adoption for smaller enterprises. Supply chain disruptions, as witnessed in recent years, can affect the availability of components and lead to delivery delays.
- Key Barriers & Challenges:
- Intense price competition and pressure on profit margins.
- Volatility in raw material prices.
- High initial cost of specialized and advanced pump systems.
- Supply chain disruptions and component availability issues.
- Stringent and evolving regulatory compliance requirements.
- Skilled labor shortage for installation, maintenance, and repair of complex systems.
Emerging Opportunities in Pumps Market
Emerging opportunities within the Pumps Market are largely driven by the increasing focus on sustainability, digitalization, and the expansion into underserved regions. The growing adoption of renewable energy sources, such as solar and wind power, necessitates specialized pumps for cooling and water management systems, creating a new avenue for growth. Furthermore, the increasing emphasis on the circular economy is driving demand for pumps used in recycling and waste management processes. The development of highly efficient and low-emission pump technologies aligns with global environmental goals and presents significant market potential. Digitalization offers opportunities for the development of smart pump systems with advanced analytics, predictive maintenance capabilities, and remote monitoring, leading to optimized operational efficiency and reduced lifecycle costs. Untapped markets in developing economies, particularly in Africa and parts of Southeast Asia, represent significant growth potential due to ongoing infrastructure development and increasing industrial activities.
Growth Accelerators in the Pumps Market Industry
Several catalysts are accelerating the long-term growth trajectory of the Pumps Market. Technological breakthroughs, particularly in areas like advanced materials science, leading to more durable and corrosion-resistant pumps, and the refinement of IoT integration for enhanced data analytics and remote management, are transforming the industry. Strategic partnerships between pump manufacturers and technology providers are fostering innovation and the development of integrated solutions. Market expansion strategies, including the penetration into emerging economies and the development of application-specific pump solutions, are further broadening the market reach. Investments in research and development by key players are crucial for staying ahead of the curve, ensuring the continuous introduction of innovative products that meet evolving industry needs and regulatory requirements. The increasing global emphasis on water security and efficient water management will continue to be a significant growth accelerator for the Water and Wastewater pump segment.
Key Players Shaping the Pumps Market Market
- Sulzer Ltd
- Ebara Corporation
- Flowserve Corporation
- Weir Group PLC
- Dover Corporation
- Clyde Union Inc
- Schlumberger Ltd
- KSB SE & Co KGaA
- ITT Inc
- Grundfos Holding AS
- Baker Hughes Company
Notable Milestones in Pumps Market Sector
- December 2023: The Packo Pumps website merged with the Verder Liquids website, aiming to reinforce the relationship between Verder and Packo and provide customers with a broader range of pump technologies.
- May 2023: The ClydeUnion Pumps brand signed an agreement with ONGC to offer pump maintenance and spares services across its network of crude oil and natural gas assets in India.
- February 2023: Motion & Control Enterprises completed the acquisition of Precision Pump & Valve, an established distributor specializing in safety relief and control valves, pumps, and associated equipment. Precision Pump & Valve is renowned for providing tailored solutions to the oil and gas, petrochemical, and chemical processing markets.
In-Depth Pumps Market Market Outlook
The future outlook for the Pumps Market is exceptionally positive, driven by a confluence of robust demand from essential industries and continuous technological advancements. Growth accelerators, including the critical need for sustainable water management, the ongoing energy transition requiring efficient fluid handling in new power sources, and the persistent demand from the foundational Oil and Gas and Chemicals and Petrochemicals sectors, will sustain market expansion. The increasing integration of digital technologies, such as AI and IoT, will lead to smarter, more efficient, and predictive pumping systems, offering significant value to end-users. Emerging economies present substantial untapped potential, fueled by ongoing infrastructure development and industrialization efforts. Strategic investments in research and development, coupled with market consolidation through mergers and acquisitions, will continue to shape the competitive landscape, ensuring that players are well-positioned to meet the evolving demands for reliable, efficient, and environmentally responsible pumping solutions.
Pumps Market Segmentation
-
1. Type
- 1.1. Centrifugal Pump
- 1.2. Positive Displacement Pump
-
2. End User
- 2.1. Oil and Gas
- 2.2. Water and Wastewater
- 2.3. Chemicals and Petrochemicals
- 2.4. Mining Industry
- 2.5. Power Generation
- 2.6. Other End Users
Pumps Market Segmentation By Geography
-
1. North America
- 1.1. United States
- 1.2. Canada
- 1.3. Rest of North America
-
2. Europe
- 2.1. Germany
- 2.2. France
- 2.3. Spain
- 2.4. United Kingdom
- 2.5. Russia
- 2.6. NORDIC
- 2.7. Italy
- 2.8. Turkey
- 2.9. Rest of Europe
-
3. Asia Pacific
- 3.1. China
- 3.2. India
- 3.3. Japan
- 3.4. South Korea
- 3.5. Australia
- 3.6. Malaysia
- 3.7. Thailand
- 3.8. Indonesia
- 3.9. Vietnam
- 3.10. Rest of Asia Pacific
-
4. South America
- 4.1. Brazil
- 4.2. Argentina
- 4.3. Colombia
- 4.4. Rest of South America
-
5. Middle East and Africa
- 5.1. Saudi Arabia
- 5.2. United Arab Emirates
- 5.3. South Africa
- 5.4. Nigeria
- 5.5. Qatar
- 5.6. Egypt
- 5.7. Rest of the Middle East and Africa
Pumps Market Regional Market Share
Geographic Coverage of Pumps Market
Pumps Market REPORT HIGHLIGHTS
| Aspects | Details |
|---|---|
| Study Period | 2020-2034 |
| Base Year | 2025 |
| Estimated Year | 2026 |
| Forecast Period | 2026-2034 |
| Historical Period | 2020-2025 |
| Growth Rate | CAGR of 3.60% from 2020-2034 |
| Segmentation |
|
Table of Contents
- 1. Introduction
- 1.1. Research Scope
- 1.2. Market Segmentation
- 1.3. Research Objective
- 1.4. Definitions and Assumptions
- 2. Executive Summary
- 2.1. Market Snapshot
- 3. Market Dynamics
- 3.1. Market Drivers
- 3.2. Market Restrains
- 3.3. Market Trends
- 3.4. Market Opportunities
- 4. Market Factor Analysis
- 4.1. Porters Five Forces
- 4.1.1. Bargaining Power of Suppliers
- 4.1.2. Bargaining Power of Buyers
- 4.1.3. Threat of New Entrants
- 4.1.4. Threat of Substitutes
- 4.1.5. Competitive Rivalry
- 4.2. PESTEL analysis
- 4.3. BCG Analysis
- 4.3.1. Stars (High Growth, High Market Share)
- 4.3.2. Cash Cows (Low Growth, High Market Share)
- 4.3.3. Question Mark (High Growth, Low Market Share)
- 4.3.4. Dogs (Low Growth, Low Market Share)
- 4.4. Ansoff Matrix Analysis
- 4.5. Supply Chain Analysis
- 4.6. Regulatory Landscape
- 4.7. Current Market Potential and Opportunity Assessment (TAM–SAM–SOM Framework)
- 4.8. VDR Analyst Note
- 4.1. Porters Five Forces
- 5. Market Analysis, Insights and Forecast 2021-2033
- 5.1. Market Analysis, Insights and Forecast - by Type
- 5.1.1. Centrifugal Pump
- 5.1.2. Positive Displacement Pump
- 5.2. Market Analysis, Insights and Forecast - by End User
- 5.2.1. Oil and Gas
- 5.2.2. Water and Wastewater
- 5.2.3. Chemicals and Petrochemicals
- 5.2.4. Mining Industry
- 5.2.5. Power Generation
- 5.2.6. Other End Users
- 5.3. Market Analysis, Insights and Forecast - by Region
- 5.3.1. North America
- 5.3.2. Europe
- 5.3.3. Asia Pacific
- 5.3.4. South America
- 5.3.5. Middle East and Africa
- 5.1. Market Analysis, Insights and Forecast - by Type
- 6. Global Pumps Market Analysis, Insights and Forecast, 2021-2033
- 6.1. Market Analysis, Insights and Forecast - by Type
- 6.1.1. Centrifugal Pump
- 6.1.2. Positive Displacement Pump
- 6.2. Market Analysis, Insights and Forecast - by End User
- 6.2.1. Oil and Gas
- 6.2.2. Water and Wastewater
- 6.2.3. Chemicals and Petrochemicals
- 6.2.4. Mining Industry
- 6.2.5. Power Generation
- 6.2.6. Other End Users
- 6.1. Market Analysis, Insights and Forecast - by Type
- 7. North America Pumps Market Analysis, Insights and Forecast, 2021-2033
- 7.1. Market Analysis, Insights and Forecast - by Type
- 7.1.1. Centrifugal Pump
- 7.1.2. Positive Displacement Pump
- 7.2. Market Analysis, Insights and Forecast - by End User
- 7.2.1. Oil and Gas
- 7.2.2. Water and Wastewater
- 7.2.3. Chemicals and Petrochemicals
- 7.2.4. Mining Industry
- 7.2.5. Power Generation
- 7.2.6. Other End Users
- 7.1. Market Analysis, Insights and Forecast - by Type
- 8. Europe Pumps Market Analysis, Insights and Forecast, 2021-2033
- 8.1. Market Analysis, Insights and Forecast - by Type
- 8.1.1. Centrifugal Pump
- 8.1.2. Positive Displacement Pump
- 8.2. Market Analysis, Insights and Forecast - by End User
- 8.2.1. Oil and Gas
- 8.2.2. Water and Wastewater
- 8.2.3. Chemicals and Petrochemicals
- 8.2.4. Mining Industry
- 8.2.5. Power Generation
- 8.2.6. Other End Users
- 8.1. Market Analysis, Insights and Forecast - by Type
- 9. Asia Pacific Pumps Market Analysis, Insights and Forecast, 2021-2033
- 9.1. Market Analysis, Insights and Forecast - by Type
- 9.1.1. Centrifugal Pump
- 9.1.2. Positive Displacement Pump
- 9.2. Market Analysis, Insights and Forecast - by End User
- 9.2.1. Oil and Gas
- 9.2.2. Water and Wastewater
- 9.2.3. Chemicals and Petrochemicals
- 9.2.4. Mining Industry
- 9.2.5. Power Generation
- 9.2.6. Other End Users
- 9.1. Market Analysis, Insights and Forecast - by Type
- 10. South America Pumps Market Analysis, Insights and Forecast, 2021-2033
- 10.1. Market Analysis, Insights and Forecast - by Type
- 10.1.1. Centrifugal Pump
- 10.1.2. Positive Displacement Pump
- 10.2. Market Analysis, Insights and Forecast - by End User
- 10.2.1. Oil and Gas
- 10.2.2. Water and Wastewater
- 10.2.3. Chemicals and Petrochemicals
- 10.2.4. Mining Industry
- 10.2.5. Power Generation
- 10.2.6. Other End Users
- 10.1. Market Analysis, Insights and Forecast - by Type
- 11. Middle East and Africa Pumps Market Analysis, Insights and Forecast, 2021-2033
- 11.1. Market Analysis, Insights and Forecast - by Type
- 11.1.1. Centrifugal Pump
- 11.1.2. Positive Displacement Pump
- 11.2. Market Analysis, Insights and Forecast - by End User
- 11.2.1. Oil and Gas
- 11.2.2. Water and Wastewater
- 11.2.3. Chemicals and Petrochemicals
- 11.2.4. Mining Industry
- 11.2.5. Power Generation
- 11.2.6. Other End Users
- 11.1. Market Analysis, Insights and Forecast - by Type
- 12. Competitive Analysis
- 12.1. Company Profiles
- 12.1.1 Sulzer Ltd
- 12.1.1.1. Company Overview
- 12.1.1.2. Products
- 12.1.1.3. Company Financials
- 12.1.1.4. SWOT Analysis
- 12.1.2 Ebara Corporation
- 12.1.2.1. Company Overview
- 12.1.2.2. Products
- 12.1.2.3. Company Financials
- 12.1.2.4. SWOT Analysis
- 12.1.3 Flowserve Corporation
- 12.1.3.1. Company Overview
- 12.1.3.2. Products
- 12.1.3.3. Company Financials
- 12.1.3.4. SWOT Analysis
- 12.1.4 Weir Group PLC
- 12.1.4.1. Company Overview
- 12.1.4.2. Products
- 12.1.4.3. Company Financials
- 12.1.4.4. SWOT Analysis
- 12.1.5 Dover Corporation*List Not Exhaustive 6 4 Market Ranking/Share (%) Analysi
- 12.1.5.1. Company Overview
- 12.1.5.2. Products
- 12.1.5.3. Company Financials
- 12.1.5.4. SWOT Analysis
- 12.1.6 Clyde Union Inc
- 12.1.6.1. Company Overview
- 12.1.6.2. Products
- 12.1.6.3. Company Financials
- 12.1.6.4. SWOT Analysis
- 12.1.7 Schlumberger Ltd
- 12.1.7.1. Company Overview
- 12.1.7.2. Products
- 12.1.7.3. Company Financials
- 12.1.7.4. SWOT Analysis
- 12.1.8 KSB SE & Co KGaA
- 12.1.8.1. Company Overview
- 12.1.8.2. Products
- 12.1.8.3. Company Financials
- 12.1.8.4. SWOT Analysis
- 12.1.9 ITT Inc
- 12.1.9.1. Company Overview
- 12.1.9.2. Products
- 12.1.9.3. Company Financials
- 12.1.9.4. SWOT Analysis
- 12.1.10 Grundfos Holding AS
- 12.1.10.1. Company Overview
- 12.1.10.2. Products
- 12.1.10.3. Company Financials
- 12.1.10.4. SWOT Analysis
- 12.1.11 Baker Hughes Company
- 12.1.11.1. Company Overview
- 12.1.11.2. Products
- 12.1.11.3. Company Financials
- 12.1.11.4. SWOT Analysis
- 12.1.1 Sulzer Ltd
- 12.2. Market Entropy
- 12.2.1 Company's Key Areas Served
- 12.2.2 Recent Developments
- 12.3. Company Market Share Analysis 2025
- 12.3.1 Top 5 Companies Market Share Analysis
- 12.3.2 Top 3 Companies Market Share Analysis
- 12.4. List of Potential Customers
- 13. Research Methodology
List of Figures
- Figure 1: Global Pumps Market Revenue Breakdown (Million, %) by Region 2025 & 2033
- Figure 2: Global Pumps Market Volume Breakdown (K Unit, %) by Region 2025 & 2033
- Figure 3: North America Pumps Market Revenue (Million), by Type 2025 & 2033
- Figure 4: North America Pumps Market Volume (K Unit), by Type 2025 & 2033
- Figure 5: North America Pumps Market Revenue Share (%), by Type 2025 & 2033
- Figure 6: North America Pumps Market Volume Share (%), by Type 2025 & 2033
- Figure 7: North America Pumps Market Revenue (Million), by End User 2025 & 2033
- Figure 8: North America Pumps Market Volume (K Unit), by End User 2025 & 2033
- Figure 9: North America Pumps Market Revenue Share (%), by End User 2025 & 2033
- Figure 10: North America Pumps Market Volume Share (%), by End User 2025 & 2033
- Figure 11: North America Pumps Market Revenue (Million), by Country 2025 & 2033
- Figure 12: North America Pumps Market Volume (K Unit), by Country 2025 & 2033
- Figure 13: North America Pumps Market Revenue Share (%), by Country 2025 & 2033
- Figure 14: North America Pumps Market Volume Share (%), by Country 2025 & 2033
- Figure 15: Europe Pumps Market Revenue (Million), by Type 2025 & 2033
- Figure 16: Europe Pumps Market Volume (K Unit), by Type 2025 & 2033
- Figure 17: Europe Pumps Market Revenue Share (%), by Type 2025 & 2033
- Figure 18: Europe Pumps Market Volume Share (%), by Type 2025 & 2033
- Figure 19: Europe Pumps Market Revenue (Million), by End User 2025 & 2033
- Figure 20: Europe Pumps Market Volume (K Unit), by End User 2025 & 2033
- Figure 21: Europe Pumps Market Revenue Share (%), by End User 2025 & 2033
- Figure 22: Europe Pumps Market Volume Share (%), by End User 2025 & 2033
- Figure 23: Europe Pumps Market Revenue (Million), by Country 2025 & 2033
- Figure 24: Europe Pumps Market Volume (K Unit), by Country 2025 & 2033
- Figure 25: Europe Pumps Market Revenue Share (%), by Country 2025 & 2033
- Figure 26: Europe Pumps Market Volume Share (%), by Country 2025 & 2033
- Figure 27: Asia Pacific Pumps Market Revenue (Million), by Type 2025 & 2033
- Figure 28: Asia Pacific Pumps Market Volume (K Unit), by Type 2025 & 2033
- Figure 29: Asia Pacific Pumps Market Revenue Share (%), by Type 2025 & 2033
- Figure 30: Asia Pacific Pumps Market Volume Share (%), by Type 2025 & 2033
- Figure 31: Asia Pacific Pumps Market Revenue (Million), by End User 2025 & 2033
- Figure 32: Asia Pacific Pumps Market Volume (K Unit), by End User 2025 & 2033
- Figure 33: Asia Pacific Pumps Market Revenue Share (%), by End User 2025 & 2033
- Figure 34: Asia Pacific Pumps Market Volume Share (%), by End User 2025 & 2033
- Figure 35: Asia Pacific Pumps Market Revenue (Million), by Country 2025 & 2033
- Figure 36: Asia Pacific Pumps Market Volume (K Unit), by Country 2025 & 2033
- Figure 37: Asia Pacific Pumps Market Revenue Share (%), by Country 2025 & 2033
- Figure 38: Asia Pacific Pumps Market Volume Share (%), by Country 2025 & 2033
- Figure 39: South America Pumps Market Revenue (Million), by Type 2025 & 2033
- Figure 40: South America Pumps Market Volume (K Unit), by Type 2025 & 2033
- Figure 41: South America Pumps Market Revenue Share (%), by Type 2025 & 2033
- Figure 42: South America Pumps Market Volume Share (%), by Type 2025 & 2033
- Figure 43: South America Pumps Market Revenue (Million), by End User 2025 & 2033
- Figure 44: South America Pumps Market Volume (K Unit), by End User 2025 & 2033
- Figure 45: South America Pumps Market Revenue Share (%), by End User 2025 & 2033
- Figure 46: South America Pumps Market Volume Share (%), by End User 2025 & 2033
- Figure 47: South America Pumps Market Revenue (Million), by Country 2025 & 2033
- Figure 48: South America Pumps Market Volume (K Unit), by Country 2025 & 2033
- Figure 49: South America Pumps Market Revenue Share (%), by Country 2025 & 2033
- Figure 50: South America Pumps Market Volume Share (%), by Country 2025 & 2033
- Figure 51: Middle East and Africa Pumps Market Revenue (Million), by Type 2025 & 2033
- Figure 52: Middle East and Africa Pumps Market Volume (K Unit), by Type 2025 & 2033
- Figure 53: Middle East and Africa Pumps Market Revenue Share (%), by Type 2025 & 2033
- Figure 54: Middle East and Africa Pumps Market Volume Share (%), by Type 2025 & 2033
- Figure 55: Middle East and Africa Pumps Market Revenue (Million), by End User 2025 & 2033
- Figure 56: Middle East and Africa Pumps Market Volume (K Unit), by End User 2025 & 2033
- Figure 57: Middle East and Africa Pumps Market Revenue Share (%), by End User 2025 & 2033
- Figure 58: Middle East and Africa Pumps Market Volume Share (%), by End User 2025 & 2033
- Figure 59: Middle East and Africa Pumps Market Revenue (Million), by Country 2025 & 2033
- Figure 60: Middle East and Africa Pumps Market Volume (K Unit), by Country 2025 & 2033
- Figure 61: Middle East and Africa Pumps Market Revenue Share (%), by Country 2025 & 2033
- Figure 62: Middle East and Africa Pumps Market Volume Share (%), by Country 2025 & 2033
List of Tables
- Table 1: Global Pumps Market Revenue Million Forecast, by Type 2020 & 2033
- Table 2: Global Pumps Market Volume K Unit Forecast, by Type 2020 & 2033
- Table 3: Global Pumps Market Revenue Million Forecast, by End User 2020 & 2033
- Table 4: Global Pumps Market Volume K Unit Forecast, by End User 2020 & 2033
- Table 5: Global Pumps Market Revenue Million Forecast, by Region 2020 & 2033
- Table 6: Global Pumps Market Volume K Unit Forecast, by Region 2020 & 2033
- Table 7: Global Pumps Market Revenue Million Forecast, by Type 2020 & 2033
- Table 8: Global Pumps Market Volume K Unit Forecast, by Type 2020 & 2033
- Table 9: Global Pumps Market Revenue Million Forecast, by End User 2020 & 2033
- Table 10: Global Pumps Market Volume K Unit Forecast, by End User 2020 & 2033
- Table 11: Global Pumps Market Revenue Million Forecast, by Country 2020 & 2033
- Table 12: Global Pumps Market Volume K Unit Forecast, by Country 2020 & 2033
- Table 13: United States Pumps Market Revenue (Million) Forecast, by Application 2020 & 2033
- Table 14: United States Pumps Market Volume (K Unit) Forecast, by Application 2020 & 2033
- Table 15: Canada Pumps Market Revenue (Million) Forecast, by Application 2020 & 2033
- Table 16: Canada Pumps Market Volume (K Unit) Forecast, by Application 2020 & 2033
- Table 17: Rest of North America Pumps Market Revenue (Million) Forecast, by Application 2020 & 2033
- Table 18: Rest of North America Pumps Market Volume (K Unit) Forecast, by Application 2020 & 2033
- Table 19: Global Pumps Market Revenue Million Forecast, by Type 2020 & 2033
- Table 20: Global Pumps Market Volume K Unit Forecast, by Type 2020 & 2033
- Table 21: Global Pumps Market Revenue Million Forecast, by End User 2020 & 2033
- Table 22: Global Pumps Market Volume K Unit Forecast, by End User 2020 & 2033
- Table 23: Global Pumps Market Revenue Million Forecast, by Country 2020 & 2033
- Table 24: Global Pumps Market Volume K Unit Forecast, by Country 2020 & 2033
- Table 25: Germany Pumps Market Revenue (Million) Forecast, by Application 2020 & 2033
- Table 26: Germany Pumps Market Volume (K Unit) Forecast, by Application 2020 & 2033
- Table 27: France Pumps Market Revenue (Million) Forecast, by Application 2020 & 2033
- Table 28: France Pumps Market Volume (K Unit) Forecast, by Application 2020 & 2033
- Table 29: Spain Pumps Market Revenue (Million) Forecast, by Application 2020 & 2033
- Table 30: Spain Pumps Market Volume (K Unit) Forecast, by Application 2020 & 2033
- Table 31: United Kingdom Pumps Market Revenue (Million) Forecast, by Application 2020 & 2033
- Table 32: United Kingdom Pumps Market Volume (K Unit) Forecast, by Application 2020 & 2033
- Table 33: Russia Pumps Market Revenue (Million) Forecast, by Application 2020 & 2033
- Table 34: Russia Pumps Market Volume (K Unit) Forecast, by Application 2020 & 2033
- Table 35: NORDIC Pumps Market Revenue (Million) Forecast, by Application 2020 & 2033
- Table 36: NORDIC Pumps Market Volume (K Unit) Forecast, by Application 2020 & 2033
- Table 37: Italy Pumps Market Revenue (Million) Forecast, by Application 2020 & 2033
- Table 38: Italy Pumps Market Volume (K Unit) Forecast, by Application 2020 & 2033
- Table 39: Turkey Pumps Market Revenue (Million) Forecast, by Application 2020 & 2033
- Table 40: Turkey Pumps Market Volume (K Unit) Forecast, by Application 2020 & 2033
- Table 41: Rest of Europe Pumps Market Revenue (Million) Forecast, by Application 2020 & 2033
- Table 42: Rest of Europe Pumps Market Volume (K Unit) Forecast, by Application 2020 & 2033
- Table 43: Global Pumps Market Revenue Million Forecast, by Type 2020 & 2033
- Table 44: Global Pumps Market Volume K Unit Forecast, by Type 2020 & 2033
- Table 45: Global Pumps Market Revenue Million Forecast, by End User 2020 & 2033
- Table 46: Global Pumps Market Volume K Unit Forecast, by End User 2020 & 2033
- Table 47: Global Pumps Market Revenue Million Forecast, by Country 2020 & 2033
- Table 48: Global Pumps Market Volume K Unit Forecast, by Country 2020 & 2033
- Table 49: China Pumps Market Revenue (Million) Forecast, by Application 2020 & 2033
- Table 50: China Pumps Market Volume (K Unit) Forecast, by Application 2020 & 2033
- Table 51: India Pumps Market Revenue (Million) Forecast, by Application 2020 & 2033
- Table 52: India Pumps Market Volume (K Unit) Forecast, by Application 2020 & 2033
- Table 53: Japan Pumps Market Revenue (Million) Forecast, by Application 2020 & 2033
- Table 54: Japan Pumps Market Volume (K Unit) Forecast, by Application 2020 & 2033
- Table 55: South Korea Pumps Market Revenue (Million) Forecast, by Application 2020 & 2033
- Table 56: South Korea Pumps Market Volume (K Unit) Forecast, by Application 2020 & 2033
- Table 57: Australia Pumps Market Revenue (Million) Forecast, by Application 2020 & 2033
- Table 58: Australia Pumps Market Volume (K Unit) Forecast, by Application 2020 & 2033
- Table 59: Malaysia Pumps Market Revenue (Million) Forecast, by Application 2020 & 2033
- Table 60: Malaysia Pumps Market Volume (K Unit) Forecast, by Application 2020 & 2033
- Table 61: Thailand Pumps Market Revenue (Million) Forecast, by Application 2020 & 2033
- Table 62: Thailand Pumps Market Volume (K Unit) Forecast, by Application 2020 & 2033
- Table 63: Indonesia Pumps Market Revenue (Million) Forecast, by Application 2020 & 2033
- Table 64: Indonesia Pumps Market Volume (K Unit) Forecast, by Application 2020 & 2033
- Table 65: Vietnam Pumps Market Revenue (Million) Forecast, by Application 2020 & 2033
- Table 66: Vietnam Pumps Market Volume (K Unit) Forecast, by Application 2020 & 2033
- Table 67: Rest of Asia Pacific Pumps Market Revenue (Million) Forecast, by Application 2020 & 2033
- Table 68: Rest of Asia Pacific Pumps Market Volume (K Unit) Forecast, by Application 2020 & 2033
- Table 69: Global Pumps Market Revenue Million Forecast, by Type 2020 & 2033
- Table 70: Global Pumps Market Volume K Unit Forecast, by Type 2020 & 2033
- Table 71: Global Pumps Market Revenue Million Forecast, by End User 2020 & 2033
- Table 72: Global Pumps Market Volume K Unit Forecast, by End User 2020 & 2033
- Table 73: Global Pumps Market Revenue Million Forecast, by Country 2020 & 2033
- Table 74: Global Pumps Market Volume K Unit Forecast, by Country 2020 & 2033
- Table 75: Brazil Pumps Market Revenue (Million) Forecast, by Application 2020 & 2033
- Table 76: Brazil Pumps Market Volume (K Unit) Forecast, by Application 2020 & 2033
- Table 77: Argentina Pumps Market Revenue (Million) Forecast, by Application 2020 & 2033
- Table 78: Argentina Pumps Market Volume (K Unit) Forecast, by Application 2020 & 2033
- Table 79: Colombia Pumps Market Revenue (Million) Forecast, by Application 2020 & 2033
- Table 80: Colombia Pumps Market Volume (K Unit) Forecast, by Application 2020 & 2033
- Table 81: Rest of South America Pumps Market Revenue (Million) Forecast, by Application 2020 & 2033
- Table 82: Rest of South America Pumps Market Volume (K Unit) Forecast, by Application 2020 & 2033
- Table 83: Global Pumps Market Revenue Million Forecast, by Type 2020 & 2033
- Table 84: Global Pumps Market Volume K Unit Forecast, by Type 2020 & 2033
- Table 85: Global Pumps Market Revenue Million Forecast, by End User 2020 & 2033
- Table 86: Global Pumps Market Volume K Unit Forecast, by End User 2020 & 2033
- Table 87: Global Pumps Market Revenue Million Forecast, by Country 2020 & 2033
- Table 88: Global Pumps Market Volume K Unit Forecast, by Country 2020 & 2033
- Table 89: Saudi Arabia Pumps Market Revenue (Million) Forecast, by Application 2020 & 2033
- Table 90: Saudi Arabia Pumps Market Volume (K Unit) Forecast, by Application 2020 & 2033
- Table 91: United Arab Emirates Pumps Market Revenue (Million) Forecast, by Application 2020 & 2033
- Table 92: United Arab Emirates Pumps Market Volume (K Unit) Forecast, by Application 2020 & 2033
- Table 93: South Africa Pumps Market Revenue (Million) Forecast, by Application 2020 & 2033
- Table 94: South Africa Pumps Market Volume (K Unit) Forecast, by Application 2020 & 2033
- Table 95: Nigeria Pumps Market Revenue (Million) Forecast, by Application 2020 & 2033
- Table 96: Nigeria Pumps Market Volume (K Unit) Forecast, by Application 2020 & 2033
- Table 97: Qatar Pumps Market Revenue (Million) Forecast, by Application 2020 & 2033
- Table 98: Qatar Pumps Market Volume (K Unit) Forecast, by Application 2020 & 2033
- Table 99: Egypt Pumps Market Revenue (Million) Forecast, by Application 2020 & 2033
- Table 100: Egypt Pumps Market Volume (K Unit) Forecast, by Application 2020 & 2033
- Table 101: Rest of the Middle East and Africa Pumps Market Revenue (Million) Forecast, by Application 2020 & 2033
- Table 102: Rest of the Middle East and Africa Pumps Market Volume (K Unit) Forecast, by Application 2020 & 2033
Frequently Asked Questions
1. What is the projected Compound Annual Growth Rate (CAGR) of the Pumps Market?
The projected CAGR is approximately 3.60%.
2. Which companies are prominent players in the Pumps Market?
Key companies in the market include Sulzer Ltd, Ebara Corporation, Flowserve Corporation, Weir Group PLC, Dover Corporation*List Not Exhaustive 6 4 Market Ranking/Share (%) Analysi, Clyde Union Inc, Schlumberger Ltd, KSB SE & Co KGaA, ITT Inc, Grundfos Holding AS, Baker Hughes Company.
3. What are the main segments of the Pumps Market?
The market segments include Type, End User.
4. Can you provide details about the market size?
The market size is estimated to be USD 110.22 Million as of 2022.
5. What are some drivers contributing to market growth?
Increasing Infrastructure Development4.; Rising Emphasis Water and Wastewater Management.
6. What are the notable trends driving market growth?
Oil and Gas Sector Expected to Witness Significant Growth.
7. Are there any restraints impacting market growth?
Volatility in Raw Material Prices.
8. Can you provide examples of recent developments in the market?
December 2023: The Packo Pumps website merged with the Verder Liquids website. The collaboration aims to reinforce the relationship between Verder and Packo and provide customers with a broader range of pump technologies.
9. What pricing options are available for accessing the report?
Pricing options include single-user, multi-user, and enterprise licenses priced at USD 4750, USD 5250, and USD 8750 respectively.
10. Is the market size provided in terms of value or volume?
The market size is provided in terms of value, measured in Million and volume, measured in K Unit.
11. Are there any specific market keywords associated with the report?
Yes, the market keyword associated with the report is "Pumps Market," which aids in identifying and referencing the specific market segment covered.
12. How do I determine which pricing option suits my needs best?
The pricing options vary based on user requirements and access needs. Individual users may opt for single-user licenses, while businesses requiring broader access may choose multi-user or enterprise licenses for cost-effective access to the report.
13. Are there any additional resources or data provided in the Pumps Market report?
While the report offers comprehensive insights, it's advisable to review the specific contents or supplementary materials provided to ascertain if additional resources or data are available.
14. How can I stay updated on further developments or reports in the Pumps Market?
To stay informed about further developments, trends, and reports in the Pumps Market, consider subscribing to industry newsletters, following relevant companies and organizations, or regularly checking reputable industry news sources and publications.
Methodology
Step 1 - Identification of Relevant Samples Size from Population Database


Step 2 - Approaches for Defining Global Market Size (Value, Volume* & Price*)

Note*: In applicable scenarios
Step 3 - Data Sources
Primary Research
- Web Analytics
- Survey Reports
- Research Institute
- Latest Research Reports
- Opinion Leaders
Secondary Research
- Annual Reports
- White Paper
- Latest Press Release
- Industry Association
- Paid Database
- Investor Presentations

Step 4 - Data Triangulation
Involves using different sources of information in order to increase the validity of a study
These sources are likely to be stakeholders in a program - participants, other researchers, program staff, other community members, and so on.
Then we put all data in single framework & apply various statistical tools to find out the dynamic on the market.
During the analysis stage, feedback from the stakeholder groups would be compared to determine areas of agreement as well as areas of divergence