
Key Insights
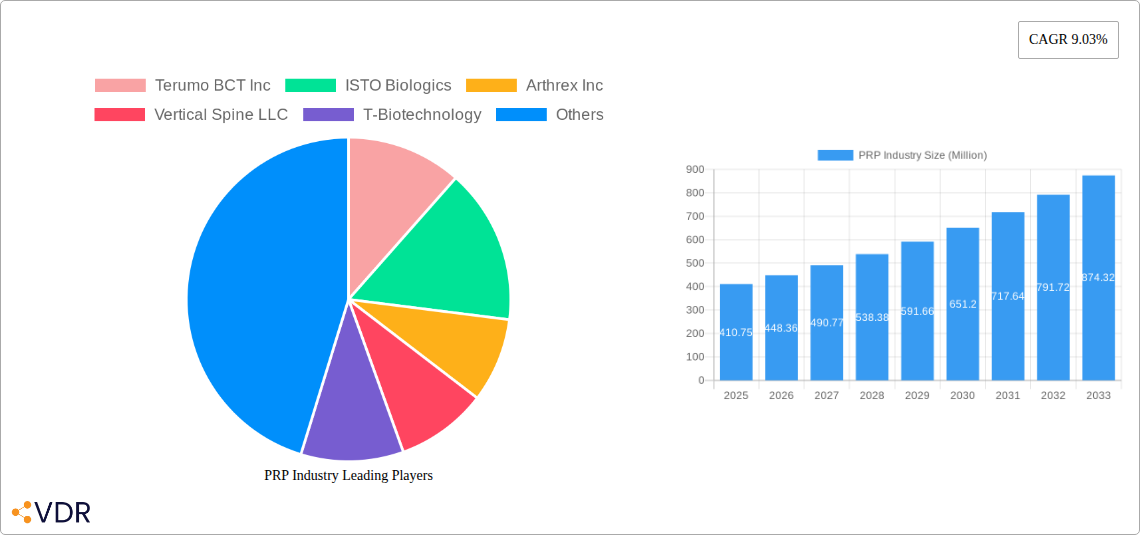
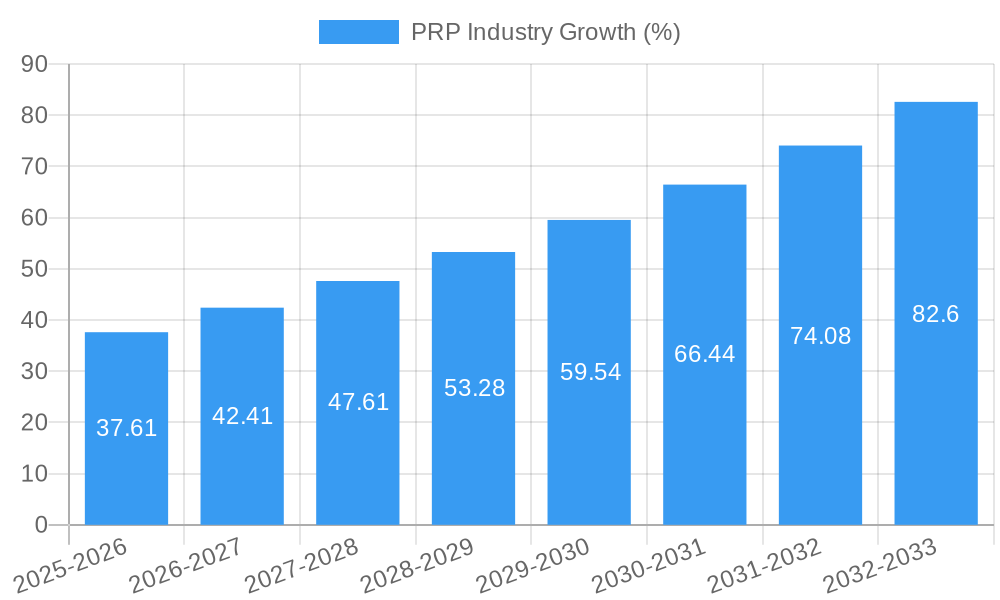
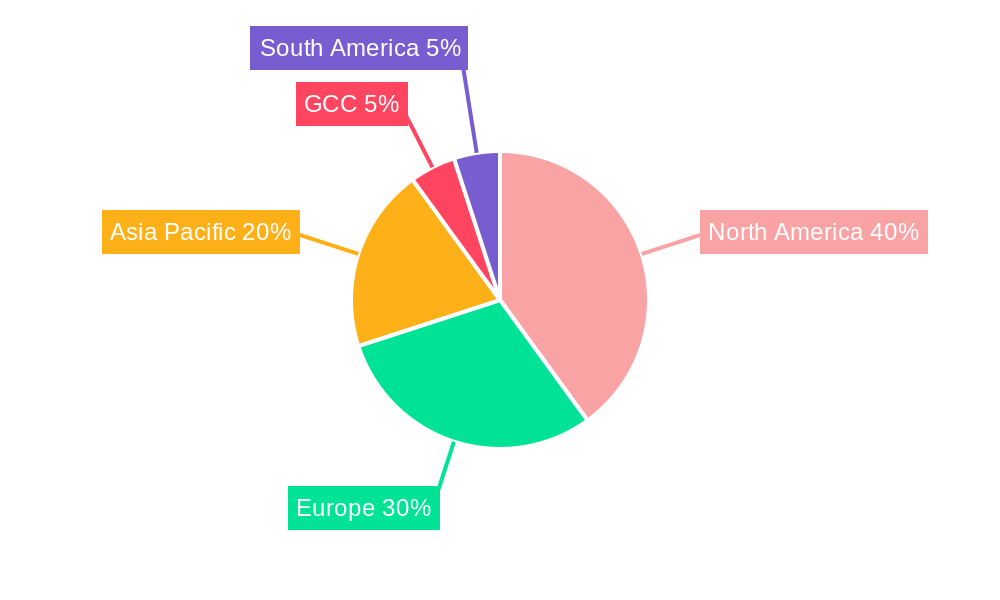
The platelet-rich plasma (PRP) industry is experiencing robust growth, projected to reach a market size of $410.75 million in 2025 and maintain a Compound Annual Growth Rate (CAGR) of 9.03% from 2025 to 2033. This expansion is driven by several key factors. The increasing prevalence of orthopedic injuries and conditions, coupled with the rising demand for minimally invasive and regenerative therapies, fuels significant market adoption. The growing awareness among both patients and healthcare professionals regarding the efficacy and safety of PRP treatments in various applications, including orthopedics, cosmetic surgery, and cardiology, further contributes to this positive trajectory. Technological advancements leading to improved PRP preparation methods and delivery systems are also enhancing market penetration. The market is segmented by end-user (hospitals and clinics, research institutes), type of PRP (pure PRP, leukocyte-rich PRP, leukocyte-rich fibrin, other), and application (orthopedics, cosmetic surgery and dermatology, neurology, cardiology, ophthalmology). The North American market currently holds a significant share, benefiting from advanced healthcare infrastructure and high adoption rates of innovative medical technologies. However, growing awareness and increasing disposable income in Asia Pacific and other emerging economies suggest strong future growth potential in these regions. Competition is intensifying with key players like Terumo BCT Inc, Arthrex Inc, and Zimmer Biomet vying for market share through product innovation and strategic partnerships.
The sustained growth of the PRP market is expected to continue due to several factors. Further research and clinical trials will likely lead to expanded applications and improved treatment protocols, driving wider adoption. Government initiatives supporting regenerative medicine and increasing healthcare expenditure globally will further stimulate market expansion. However, high treatment costs and potential side effects associated with PRP therapy pose challenges. Addressing these concerns through robust clinical evidence and cost-effective treatment options will be crucial for achieving broader market penetration. The ongoing development of novel PRP processing techniques and the expansion of distribution networks are expected to enhance market accessibility and further contribute to the industry's continued growth throughout the forecast period. The competitive landscape remains dynamic, with companies investing heavily in research and development to establish a leading position in this rapidly evolving market.
PRP Industry Market Report: 2019-2033
This comprehensive report provides an in-depth analysis of the Platelet-Rich Plasma (PRP) industry, encompassing market dynamics, growth trends, regional dominance, product landscape, key players, and future outlook. The report covers the period 2019-2033, with a focus on the base year 2025 and a forecast period of 2025-2033. This detailed analysis is crucial for industry professionals, investors, and strategic decision-makers seeking to navigate this rapidly evolving market. The report analyzes both parent (regenerative medicine) and child (orthopedics, cosmetic surgery) markets for a comprehensive understanding.
PRP Industry Market Dynamics & Structure
The PRP industry is characterized by moderate market concentration, with key players such as Terumo BCT Inc., Arthrex Inc., and Zimmer Biomet holding significant market share (xx%). Technological innovation, particularly in automated PRP processing systems and novel delivery methods, is a key driver. Regulatory frameworks, varying by region, influence market access and product approvals. Competitive substitutes, such as stem cell therapies, present challenges, but the relative affordability and established clinical track record of PRP maintain its position. End-user demographics, predominantly aging populations with increased demand for aesthetic and orthopedic procedures, fuel market growth. M&A activity, exemplified by EmCyte's acquisition of Cellmedix in 2020, suggests ongoing consolidation and expansion within the industry. The report also quantifies the impact of these factors and details current market concentration levels. The global market size in 2024 was estimated at xx Million, and it's projected to reach xx Million by 2033.
- Market Concentration: Moderately concentrated, with top 5 players holding xx% market share in 2024.
- Innovation Drivers: Automated processing, novel delivery methods, combination therapies.
- Regulatory Landscape: Varies significantly across regions; impacts product approvals and market entry.
- Competitive Substitutes: Stem cell therapies, other regenerative medicine approaches.
- End-User Demographics: Aging population, increased demand for aesthetic and orthopedic procedures.
- M&A Activity: Significant consolidation and expansion observed in recent years, with xx deals recorded between 2019 and 2024.
PRP Industry Growth Trends & Insights
The PRP industry exhibits robust growth, driven by increasing adoption across various applications and technological advancements. The market size has witnessed significant expansion over the historical period (2019-2024), demonstrating a Compound Annual Growth Rate (CAGR) of xx%. This growth is fueled by rising awareness of PRP's therapeutic benefits, coupled with technological innovations that enhance treatment efficacy and reduce costs. Consumer behavior trends show a preference for minimally invasive procedures and faster recovery times, aligning well with the advantages of PRP therapy. This report projects a CAGR of xx% during the forecast period (2025-2033), indicating continued market expansion. Factors such as improved product availability, increased physician training, and expanded regulatory approvals further bolster growth. The market penetration rate is currently estimated at xx%, with significant potential for future expansion in both established and emerging markets.
Dominant Regions, Countries, or Segments in PRP Industry
North America currently dominates the PRP industry, driven by high healthcare expenditure, advanced medical infrastructure, and a large number of hospitals and specialized clinics. Within North America, the United States holds the largest market share, followed by Canada. Europe is another significant market, with strong growth in Western European countries due to increased adoption rates and supportive regulatory environments. The orthopedics segment holds the largest market share, followed by cosmetic surgery and dermatology. Within the types of PRP, Leukocyte-rich PRP accounts for the highest share due to its efficacy across different applications. Growth is also being spurred by increasing research initiatives and government support.
- Key Drivers (North America): High healthcare expenditure, advanced medical infrastructure, high adoption rate.
- Key Drivers (Europe): Increased awareness, supportive regulatory environment, growing demand in aesthetic procedures.
- Dominant Segment: Orthopedics (xx% market share in 2024), followed by Cosmetic Surgery and Dermatology (xx%).
- Dominant PRP Type: Leukocyte-rich PRP (xx% market share in 2024).
PRP Industry Product Landscape
The PRP industry offers a range of products, including systems for PRP preparation (centrifuges, kits), and delivery devices (needles, cannulas). Recent innovations focus on automated systems that improve consistency, reduce processing time, and enhance ease of use. Furthermore, companies are developing advanced delivery methods and combination therapies to enhance treatment effectiveness. This constant innovation, coupled with a growing understanding of PRP's biological mechanisms, is leading to improvements in both the quality and range of available products. The competitive landscape is characterized by both established players and emerging companies offering innovative solutions.
Key Drivers, Barriers & Challenges in PRP Industry
Key Drivers:
- Increasing prevalence of chronic musculoskeletal conditions.
- Growing demand for minimally invasive procedures.
- Technological advancements leading to improved efficiency and efficacy.
- Favorable regulatory landscape in some regions.
Key Challenges:
- High cost of treatment limiting accessibility.
- Variation in PRP preparation and quality across different clinics.
- Lack of standardized protocols and clinical guidelines.
- Competition from other regenerative medicine therapies.
- xx% reduction in market growth projected for 2026 due to supply chain disruptions and raw material shortages.
Emerging Opportunities in PRP Industry
Untapped markets in developing economies, coupled with the increasing adoption of PRP in novel applications (e.g., wound healing, tissue regeneration) present significant opportunities. The increasing demand for personalized medicine and point-of-care testing also drives market growth. Furthermore, strategic partnerships between PRP manufacturers and healthcare providers can enhance market penetration and improve access to this valuable technology.
Growth Accelerators in the PRP Industry
Technological breakthroughs in automated PRP processing, coupled with research advancements focused on understanding PRP's biological mechanisms, are key growth drivers. Strategic partnerships between key players and healthcare institutions are also expanding market access and broadening adoption. The expansion of regulatory approvals into new applications and geographical markets will further enhance growth and make PRP therapies more accessible.
Key Players Shaping the PRP Industry Market
- Terumo BCT Inc.
- ISTO Biologics
- Arthrex Inc.
- Vertical Spine LLC
- T-Biotechnology
- DePuy Synthes
- EmCyte Corporation
- Isto Biologics
- Harvest Technologies Corporation
- Glofinn Oy
- Zimmer Biomet
- Dr PRP USA LLC
Notable Milestones in PRP Industry Sector
- February 2021: Atlas Health Medical Group announces PRP Microneedling Facelifts.
- February 2020: EmCyte acquires Cellmedix Holdings LLC, including the Centrepid Platelet Concentrator.
In-Depth PRP Industry Market Outlook
The PRP industry is poised for continued growth, driven by technological advancements, expanding applications, and increased market penetration. Strategic partnerships, regulatory approvals, and the development of standardized protocols will further accelerate market expansion. The projected growth trajectory indicates significant market potential, with opportunities for both established players and new entrants to capitalize on this burgeoning field of regenerative medicine.
PRP Industry Segmentation
-
1. Type
- 1.1. Pure PRP
- 1.2. Leukocyte-rich PRP
- 1.3. Leukocyte-rich Fibrin
- 1.4. Other Types
-
2. Application
- 2.1. Orthopedics
- 2.2. Cosmetic Surgery and Dermatology
- 2.3. Neurology
- 2.4. Cardiology
- 2.5. Ophthalmology
- 2.6. Other Applications
-
3. End User
- 3.1. Hospitals and Clinics
- 3.2. Research Institutes
PRP Industry Segmentation By Geography
-
1. North America
- 1.1. United States
- 1.2. Canada
- 1.3. Mexico
-
2. Europe
- 2.1. Germany
- 2.2. United Kingdom
- 2.3. France
- 2.4. Italy
- 2.5. Spain
- 2.6. Rest of Europe
-
3. Asia Pacific
- 3.1. China
- 3.2. Japan
- 3.3. India
- 3.4. Australia
- 3.5. South Korea
- 3.6. Rest of Asia Pacific
- 4. Middle East
-
5. GCC
- 5.1. South Africa
- 5.2. Rest of Middle East
-
6. South America
- 6.1. Brazil
- 6.2. Argentina
- 6.3. Rest of South America
PRP Industry REPORT HIGHLIGHTS
| Aspects | Details |
|---|---|
| Study Period | 2019-2033 |
| Base Year | 2024 |
| Estimated Year | 2025 |
| Forecast Period | 2025-2033 |
| Historical Period | 2019-2024 |
| Growth Rate | CAGR of 9.03% from 2019-2033 |
| Segmentation |
|
Table of Contents
- 1. Introduction
- 1.1. Research Scope
- 1.2. Market Segmentation
- 1.3. Research Methodology
- 1.4. Definitions and Assumptions
- 2. Executive Summary
- 2.1. Introduction
- 3. Market Dynamics
- 3.1. Introduction
- 3.2. Market Drivers
- 3.2.1. Rising Incidences of Sports Injuries; Increasing Number of Cosmetic and Surgical Procedures; Growing use of Platelet-rich Plasma in Various Therapeutic Areas
- 3.3. Market Restrains
- 3.3.1. Stringent Regulatory Policies; High Prices of Plasma Therapy
- 3.4. Market Trends
- 3.4.1. The Orthopedics Segment is Expected to Hold the Largest Market Share
- 4. Market Factor Analysis
- 4.1. Porters Five Forces
- 4.2. Supply/Value Chain
- 4.3. PESTEL analysis
- 4.4. Market Entropy
- 4.5. Patent/Trademark Analysis
- 5. Global PRP Industry Analysis, Insights and Forecast, 2019-2031
- 5.1. Market Analysis, Insights and Forecast - by Type
- 5.1.1. Pure PRP
- 5.1.2. Leukocyte-rich PRP
- 5.1.3. Leukocyte-rich Fibrin
- 5.1.4. Other Types
- 5.2. Market Analysis, Insights and Forecast - by Application
- 5.2.1. Orthopedics
- 5.2.2. Cosmetic Surgery and Dermatology
- 5.2.3. Neurology
- 5.2.4. Cardiology
- 5.2.5. Ophthalmology
- 5.2.6. Other Applications
- 5.3. Market Analysis, Insights and Forecast - by End User
- 5.3.1. Hospitals and Clinics
- 5.3.2. Research Institutes
- 5.4. Market Analysis, Insights and Forecast - by Region
- 5.4.1. North America
- 5.4.2. Europe
- 5.4.3. Asia Pacific
- 5.4.4. Middle East
- 5.4.5. GCC
- 5.4.6. South America
- 5.1. Market Analysis, Insights and Forecast - by Type
- 6. North America PRP Industry Analysis, Insights and Forecast, 2019-2031
- 6.1. Market Analysis, Insights and Forecast - by Type
- 6.1.1. Pure PRP
- 6.1.2. Leukocyte-rich PRP
- 6.1.3. Leukocyte-rich Fibrin
- 6.1.4. Other Types
- 6.2. Market Analysis, Insights and Forecast - by Application
- 6.2.1. Orthopedics
- 6.2.2. Cosmetic Surgery and Dermatology
- 6.2.3. Neurology
- 6.2.4. Cardiology
- 6.2.5. Ophthalmology
- 6.2.6. Other Applications
- 6.3. Market Analysis, Insights and Forecast - by End User
- 6.3.1. Hospitals and Clinics
- 6.3.2. Research Institutes
- 6.1. Market Analysis, Insights and Forecast - by Type
- 7. Europe PRP Industry Analysis, Insights and Forecast, 2019-2031
- 7.1. Market Analysis, Insights and Forecast - by Type
- 7.1.1. Pure PRP
- 7.1.2. Leukocyte-rich PRP
- 7.1.3. Leukocyte-rich Fibrin
- 7.1.4. Other Types
- 7.2. Market Analysis, Insights and Forecast - by Application
- 7.2.1. Orthopedics
- 7.2.2. Cosmetic Surgery and Dermatology
- 7.2.3. Neurology
- 7.2.4. Cardiology
- 7.2.5. Ophthalmology
- 7.2.6. Other Applications
- 7.3. Market Analysis, Insights and Forecast - by End User
- 7.3.1. Hospitals and Clinics
- 7.3.2. Research Institutes
- 7.1. Market Analysis, Insights and Forecast - by Type
- 8. Asia Pacific PRP Industry Analysis, Insights and Forecast, 2019-2031
- 8.1. Market Analysis, Insights and Forecast - by Type
- 8.1.1. Pure PRP
- 8.1.2. Leukocyte-rich PRP
- 8.1.3. Leukocyte-rich Fibrin
- 8.1.4. Other Types
- 8.2. Market Analysis, Insights and Forecast - by Application
- 8.2.1. Orthopedics
- 8.2.2. Cosmetic Surgery and Dermatology
- 8.2.3. Neurology
- 8.2.4. Cardiology
- 8.2.5. Ophthalmology
- 8.2.6. Other Applications
- 8.3. Market Analysis, Insights and Forecast - by End User
- 8.3.1. Hospitals and Clinics
- 8.3.2. Research Institutes
- 8.1. Market Analysis, Insights and Forecast - by Type
- 9. Middle East PRP Industry Analysis, Insights and Forecast, 2019-2031
- 9.1. Market Analysis, Insights and Forecast - by Type
- 9.1.1. Pure PRP
- 9.1.2. Leukocyte-rich PRP
- 9.1.3. Leukocyte-rich Fibrin
- 9.1.4. Other Types
- 9.2. Market Analysis, Insights and Forecast - by Application
- 9.2.1. Orthopedics
- 9.2.2. Cosmetic Surgery and Dermatology
- 9.2.3. Neurology
- 9.2.4. Cardiology
- 9.2.5. Ophthalmology
- 9.2.6. Other Applications
- 9.3. Market Analysis, Insights and Forecast - by End User
- 9.3.1. Hospitals and Clinics
- 9.3.2. Research Institutes
- 9.1. Market Analysis, Insights and Forecast - by Type
- 10. GCC PRP Industry Analysis, Insights and Forecast, 2019-2031
- 10.1. Market Analysis, Insights and Forecast - by Type
- 10.1.1. Pure PRP
- 10.1.2. Leukocyte-rich PRP
- 10.1.3. Leukocyte-rich Fibrin
- 10.1.4. Other Types
- 10.2. Market Analysis, Insights and Forecast - by Application
- 10.2.1. Orthopedics
- 10.2.2. Cosmetic Surgery and Dermatology
- 10.2.3. Neurology
- 10.2.4. Cardiology
- 10.2.5. Ophthalmology
- 10.2.6. Other Applications
- 10.3. Market Analysis, Insights and Forecast - by End User
- 10.3.1. Hospitals and Clinics
- 10.3.2. Research Institutes
- 10.1. Market Analysis, Insights and Forecast - by Type
- 11. South America PRP Industry Analysis, Insights and Forecast, 2019-2031
- 11.1. Market Analysis, Insights and Forecast - by Type
- 11.1.1. Pure PRP
- 11.1.2. Leukocyte-rich PRP
- 11.1.3. Leukocyte-rich Fibrin
- 11.1.4. Other Types
- 11.2. Market Analysis, Insights and Forecast - by Application
- 11.2.1. Orthopedics
- 11.2.2. Cosmetic Surgery and Dermatology
- 11.2.3. Neurology
- 11.2.4. Cardiology
- 11.2.5. Ophthalmology
- 11.2.6. Other Applications
- 11.3. Market Analysis, Insights and Forecast - by End User
- 11.3.1. Hospitals and Clinics
- 11.3.2. Research Institutes
- 11.1. Market Analysis, Insights and Forecast - by Type
- 12. North America PRP Industry Analysis, Insights and Forecast, 2019-2031
- 12.1. Market Analysis, Insights and Forecast - By Country/Sub-region
- 12.1.1. undefined
- 13. Europe PRP Industry Analysis, Insights and Forecast, 2019-2031
- 13.1. Market Analysis, Insights and Forecast - By Country/Sub-region
- 13.1.1. undefined
- 14. Asia Pacific PRP Industry Analysis, Insights and Forecast, 2019-2031
- 14.1. Market Analysis, Insights and Forecast - By Country/Sub-region
- 14.1.1. undefined
- 15. GCC PRP Industry Analysis, Insights and Forecast, 2019-2031
- 15.1. Market Analysis, Insights and Forecast - By Country/Sub-region
- 15.1.1. undefined
- 16. South America PRP Industry Analysis, Insights and Forecast, 2019-2031
- 16.1. Market Analysis, Insights and Forecast - By Country/Sub-region
- 16.1.1. undefined
- 17. Competitive Analysis
- 17.1. Global Market Share Analysis 2024
- 17.2. Company Profiles
- 17.2.1 Terumo BCT Inc
- 17.2.1.1. Overview
- 17.2.1.2. Products
- 17.2.1.3. SWOT Analysis
- 17.2.1.4. Recent Developments
- 17.2.1.5. Financials (Based on Availability)
- 17.2.2 ISTO Biologics
- 17.2.2.1. Overview
- 17.2.2.2. Products
- 17.2.2.3. SWOT Analysis
- 17.2.2.4. Recent Developments
- 17.2.2.5. Financials (Based on Availability)
- 17.2.3 Arthrex Inc
- 17.2.3.1. Overview
- 17.2.3.2. Products
- 17.2.3.3. SWOT Analysis
- 17.2.3.4. Recent Developments
- 17.2.3.5. Financials (Based on Availability)
- 17.2.4 Vertical Spine LLC
- 17.2.4.1. Overview
- 17.2.4.2. Products
- 17.2.4.3. SWOT Analysis
- 17.2.4.4. Recent Developments
- 17.2.4.5. Financials (Based on Availability)
- 17.2.5 T-Biotechnology
- 17.2.5.1. Overview
- 17.2.5.2. Products
- 17.2.5.3. SWOT Analysis
- 17.2.5.4. Recent Developments
- 17.2.5.5. Financials (Based on Availability)
- 17.2.6 DePuy Synthes
- 17.2.6.1. Overview
- 17.2.6.2. Products
- 17.2.6.3. SWOT Analysis
- 17.2.6.4. Recent Developments
- 17.2.6.5. Financials (Based on Availability)
- 17.2.7 EmCyte Corporation
- 17.2.7.1. Overview
- 17.2.7.2. Products
- 17.2.7.3. SWOT Analysis
- 17.2.7.4. Recent Developments
- 17.2.7.5. Financials (Based on Availability)
- 17.2.8 Isto Biologics
- 17.2.8.1. Overview
- 17.2.8.2. Products
- 17.2.8.3. SWOT Analysis
- 17.2.8.4. Recent Developments
- 17.2.8.5. Financials (Based on Availability)
- 17.2.9 Harvest Technologies Corporation
- 17.2.9.1. Overview
- 17.2.9.2. Products
- 17.2.9.3. SWOT Analysis
- 17.2.9.4. Recent Developments
- 17.2.9.5. Financials (Based on Availability)
- 17.2.10 Glofinn Oy
- 17.2.10.1. Overview
- 17.2.10.2. Products
- 17.2.10.3. SWOT Analysis
- 17.2.10.4. Recent Developments
- 17.2.10.5. Financials (Based on Availability)
- 17.2.11 Zimmer Biomet
- 17.2.11.1. Overview
- 17.2.11.2. Products
- 17.2.11.3. SWOT Analysis
- 17.2.11.4. Recent Developments
- 17.2.11.5. Financials (Based on Availability)
- 17.2.12 Dr PRP USA LLC
- 17.2.12.1. Overview
- 17.2.12.2. Products
- 17.2.12.3. SWOT Analysis
- 17.2.12.4. Recent Developments
- 17.2.12.5. Financials (Based on Availability)
- 17.2.1 Terumo BCT Inc
List of Figures
- Figure 1: Global PRP Industry Revenue Breakdown (Million, %) by Region 2024 & 2032
- Figure 2: Global PRP Industry Volume Breakdown (K Unit, %) by Region 2024 & 2032
- Figure 3: North America PRP Industry Revenue (Million), by Country 2024 & 2032
- Figure 4: North America PRP Industry Volume (K Unit), by Country 2024 & 2032
- Figure 5: North America PRP Industry Revenue Share (%), by Country 2024 & 2032
- Figure 6: North America PRP Industry Volume Share (%), by Country 2024 & 2032
- Figure 7: Europe PRP Industry Revenue (Million), by Country 2024 & 2032
- Figure 8: Europe PRP Industry Volume (K Unit), by Country 2024 & 2032
- Figure 9: Europe PRP Industry Revenue Share (%), by Country 2024 & 2032
- Figure 10: Europe PRP Industry Volume Share (%), by Country 2024 & 2032
- Figure 11: Asia Pacific PRP Industry Revenue (Million), by Country 2024 & 2032
- Figure 12: Asia Pacific PRP Industry Volume (K Unit), by Country 2024 & 2032
- Figure 13: Asia Pacific PRP Industry Revenue Share (%), by Country 2024 & 2032
- Figure 14: Asia Pacific PRP Industry Volume Share (%), by Country 2024 & 2032
- Figure 15: GCC PRP Industry Revenue (Million), by Country 2024 & 2032
- Figure 16: GCC PRP Industry Volume (K Unit), by Country 2024 & 2032
- Figure 17: GCC PRP Industry Revenue Share (%), by Country 2024 & 2032
- Figure 18: GCC PRP Industry Volume Share (%), by Country 2024 & 2032
- Figure 19: South America PRP Industry Revenue (Million), by Country 2024 & 2032
- Figure 20: South America PRP Industry Volume (K Unit), by Country 2024 & 2032
- Figure 21: South America PRP Industry Revenue Share (%), by Country 2024 & 2032
- Figure 22: South America PRP Industry Volume Share (%), by Country 2024 & 2032
- Figure 23: North America PRP Industry Revenue (Million), by Type 2024 & 2032
- Figure 24: North America PRP Industry Volume (K Unit), by Type 2024 & 2032
- Figure 25: North America PRP Industry Revenue Share (%), by Type 2024 & 2032
- Figure 26: North America PRP Industry Volume Share (%), by Type 2024 & 2032
- Figure 27: North America PRP Industry Revenue (Million), by Application 2024 & 2032
- Figure 28: North America PRP Industry Volume (K Unit), by Application 2024 & 2032
- Figure 29: North America PRP Industry Revenue Share (%), by Application 2024 & 2032
- Figure 30: North America PRP Industry Volume Share (%), by Application 2024 & 2032
- Figure 31: North America PRP Industry Revenue (Million), by End User 2024 & 2032
- Figure 32: North America PRP Industry Volume (K Unit), by End User 2024 & 2032
- Figure 33: North America PRP Industry Revenue Share (%), by End User 2024 & 2032
- Figure 34: North America PRP Industry Volume Share (%), by End User 2024 & 2032
- Figure 35: North America PRP Industry Revenue (Million), by Country 2024 & 2032
- Figure 36: North America PRP Industry Volume (K Unit), by Country 2024 & 2032
- Figure 37: North America PRP Industry Revenue Share (%), by Country 2024 & 2032
- Figure 38: North America PRP Industry Volume Share (%), by Country 2024 & 2032
- Figure 39: Europe PRP Industry Revenue (Million), by Type 2024 & 2032
- Figure 40: Europe PRP Industry Volume (K Unit), by Type 2024 & 2032
- Figure 41: Europe PRP Industry Revenue Share (%), by Type 2024 & 2032
- Figure 42: Europe PRP Industry Volume Share (%), by Type 2024 & 2032
- Figure 43: Europe PRP Industry Revenue (Million), by Application 2024 & 2032
- Figure 44: Europe PRP Industry Volume (K Unit), by Application 2024 & 2032
- Figure 45: Europe PRP Industry Revenue Share (%), by Application 2024 & 2032
- Figure 46: Europe PRP Industry Volume Share (%), by Application 2024 & 2032
- Figure 47: Europe PRP Industry Revenue (Million), by End User 2024 & 2032
- Figure 48: Europe PRP Industry Volume (K Unit), by End User 2024 & 2032
- Figure 49: Europe PRP Industry Revenue Share (%), by End User 2024 & 2032
- Figure 50: Europe PRP Industry Volume Share (%), by End User 2024 & 2032
- Figure 51: Europe PRP Industry Revenue (Million), by Country 2024 & 2032
- Figure 52: Europe PRP Industry Volume (K Unit), by Country 2024 & 2032
- Figure 53: Europe PRP Industry Revenue Share (%), by Country 2024 & 2032
- Figure 54: Europe PRP Industry Volume Share (%), by Country 2024 & 2032
- Figure 55: Asia Pacific PRP Industry Revenue (Million), by Type 2024 & 2032
- Figure 56: Asia Pacific PRP Industry Volume (K Unit), by Type 2024 & 2032
- Figure 57: Asia Pacific PRP Industry Revenue Share (%), by Type 2024 & 2032
- Figure 58: Asia Pacific PRP Industry Volume Share (%), by Type 2024 & 2032
- Figure 59: Asia Pacific PRP Industry Revenue (Million), by Application 2024 & 2032
- Figure 60: Asia Pacific PRP Industry Volume (K Unit), by Application 2024 & 2032
- Figure 61: Asia Pacific PRP Industry Revenue Share (%), by Application 2024 & 2032
- Figure 62: Asia Pacific PRP Industry Volume Share (%), by Application 2024 & 2032
- Figure 63: Asia Pacific PRP Industry Revenue (Million), by End User 2024 & 2032
- Figure 64: Asia Pacific PRP Industry Volume (K Unit), by End User 2024 & 2032
- Figure 65: Asia Pacific PRP Industry Revenue Share (%), by End User 2024 & 2032
- Figure 66: Asia Pacific PRP Industry Volume Share (%), by End User 2024 & 2032
- Figure 67: Asia Pacific PRP Industry Revenue (Million), by Country 2024 & 2032
- Figure 68: Asia Pacific PRP Industry Volume (K Unit), by Country 2024 & 2032
- Figure 69: Asia Pacific PRP Industry Revenue Share (%), by Country 2024 & 2032
- Figure 70: Asia Pacific PRP Industry Volume Share (%), by Country 2024 & 2032
- Figure 71: Middle East PRP Industry Revenue (Million), by Type 2024 & 2032
- Figure 72: Middle East PRP Industry Volume (K Unit), by Type 2024 & 2032
- Figure 73: Middle East PRP Industry Revenue Share (%), by Type 2024 & 2032
- Figure 74: Middle East PRP Industry Volume Share (%), by Type 2024 & 2032
- Figure 75: Middle East PRP Industry Revenue (Million), by Application 2024 & 2032
- Figure 76: Middle East PRP Industry Volume (K Unit), by Application 2024 & 2032
- Figure 77: Middle East PRP Industry Revenue Share (%), by Application 2024 & 2032
- Figure 78: Middle East PRP Industry Volume Share (%), by Application 2024 & 2032
- Figure 79: Middle East PRP Industry Revenue (Million), by End User 2024 & 2032
- Figure 80: Middle East PRP Industry Volume (K Unit), by End User 2024 & 2032
- Figure 81: Middle East PRP Industry Revenue Share (%), by End User 2024 & 2032
- Figure 82: Middle East PRP Industry Volume Share (%), by End User 2024 & 2032
- Figure 83: Middle East PRP Industry Revenue (Million), by Country 2024 & 2032
- Figure 84: Middle East PRP Industry Volume (K Unit), by Country 2024 & 2032
- Figure 85: Middle East PRP Industry Revenue Share (%), by Country 2024 & 2032
- Figure 86: Middle East PRP Industry Volume Share (%), by Country 2024 & 2032
- Figure 87: GCC PRP Industry Revenue (Million), by Type 2024 & 2032
- Figure 88: GCC PRP Industry Volume (K Unit), by Type 2024 & 2032
- Figure 89: GCC PRP Industry Revenue Share (%), by Type 2024 & 2032
- Figure 90: GCC PRP Industry Volume Share (%), by Type 2024 & 2032
- Figure 91: GCC PRP Industry Revenue (Million), by Application 2024 & 2032
- Figure 92: GCC PRP Industry Volume (K Unit), by Application 2024 & 2032
- Figure 93: GCC PRP Industry Revenue Share (%), by Application 2024 & 2032
- Figure 94: GCC PRP Industry Volume Share (%), by Application 2024 & 2032
- Figure 95: GCC PRP Industry Revenue (Million), by End User 2024 & 2032
- Figure 96: GCC PRP Industry Volume (K Unit), by End User 2024 & 2032
- Figure 97: GCC PRP Industry Revenue Share (%), by End User 2024 & 2032
- Figure 98: GCC PRP Industry Volume Share (%), by End User 2024 & 2032
- Figure 99: GCC PRP Industry Revenue (Million), by Country 2024 & 2032
- Figure 100: GCC PRP Industry Volume (K Unit), by Country 2024 & 2032
- Figure 101: GCC PRP Industry Revenue Share (%), by Country 2024 & 2032
- Figure 102: GCC PRP Industry Volume Share (%), by Country 2024 & 2032
- Figure 103: South America PRP Industry Revenue (Million), by Type 2024 & 2032
- Figure 104: South America PRP Industry Volume (K Unit), by Type 2024 & 2032
- Figure 105: South America PRP Industry Revenue Share (%), by Type 2024 & 2032
- Figure 106: South America PRP Industry Volume Share (%), by Type 2024 & 2032
- Figure 107: South America PRP Industry Revenue (Million), by Application 2024 & 2032
- Figure 108: South America PRP Industry Volume (K Unit), by Application 2024 & 2032
- Figure 109: South America PRP Industry Revenue Share (%), by Application 2024 & 2032
- Figure 110: South America PRP Industry Volume Share (%), by Application 2024 & 2032
- Figure 111: South America PRP Industry Revenue (Million), by End User 2024 & 2032
- Figure 112: South America PRP Industry Volume (K Unit), by End User 2024 & 2032
- Figure 113: South America PRP Industry Revenue Share (%), by End User 2024 & 2032
- Figure 114: South America PRP Industry Volume Share (%), by End User 2024 & 2032
- Figure 115: South America PRP Industry Revenue (Million), by Country 2024 & 2032
- Figure 116: South America PRP Industry Volume (K Unit), by Country 2024 & 2032
- Figure 117: South America PRP Industry Revenue Share (%), by Country 2024 & 2032
- Figure 118: South America PRP Industry Volume Share (%), by Country 2024 & 2032
List of Tables
- Table 1: Global PRP Industry Revenue Million Forecast, by Region 2019 & 2032
- Table 2: Global PRP Industry Volume K Unit Forecast, by Region 2019 & 2032
- Table 3: Global PRP Industry Revenue Million Forecast, by Type 2019 & 2032
- Table 4: Global PRP Industry Volume K Unit Forecast, by Type 2019 & 2032
- Table 5: Global PRP Industry Revenue Million Forecast, by Application 2019 & 2032
- Table 6: Global PRP Industry Volume K Unit Forecast, by Application 2019 & 2032
- Table 7: Global PRP Industry Revenue Million Forecast, by End User 2019 & 2032
- Table 8: Global PRP Industry Volume K Unit Forecast, by End User 2019 & 2032
- Table 9: Global PRP Industry Revenue Million Forecast, by Region 2019 & 2032
- Table 10: Global PRP Industry Volume K Unit Forecast, by Region 2019 & 2032
- Table 11: Global PRP Industry Revenue Million Forecast, by Country 2019 & 2032
- Table 12: Global PRP Industry Volume K Unit Forecast, by Country 2019 & 2032
- Table 13: Global PRP Industry Revenue Million Forecast, by Country 2019 & 2032
- Table 14: Global PRP Industry Volume K Unit Forecast, by Country 2019 & 2032
- Table 15: Global PRP Industry Revenue Million Forecast, by Country 2019 & 2032
- Table 16: Global PRP Industry Volume K Unit Forecast, by Country 2019 & 2032
- Table 17: Global PRP Industry Revenue Million Forecast, by Country 2019 & 2032
- Table 18: Global PRP Industry Volume K Unit Forecast, by Country 2019 & 2032
- Table 19: Global PRP Industry Revenue Million Forecast, by Country 2019 & 2032
- Table 20: Global PRP Industry Volume K Unit Forecast, by Country 2019 & 2032
- Table 21: Global PRP Industry Revenue Million Forecast, by Type 2019 & 2032
- Table 22: Global PRP Industry Volume K Unit Forecast, by Type 2019 & 2032
- Table 23: Global PRP Industry Revenue Million Forecast, by Application 2019 & 2032
- Table 24: Global PRP Industry Volume K Unit Forecast, by Application 2019 & 2032
- Table 25: Global PRP Industry Revenue Million Forecast, by End User 2019 & 2032
- Table 26: Global PRP Industry Volume K Unit Forecast, by End User 2019 & 2032
- Table 27: Global PRP Industry Revenue Million Forecast, by Country 2019 & 2032
- Table 28: Global PRP Industry Volume K Unit Forecast, by Country 2019 & 2032
- Table 29: United States PRP Industry Revenue (Million) Forecast, by Application 2019 & 2032
- Table 30: United States PRP Industry Volume (K Unit) Forecast, by Application 2019 & 2032
- Table 31: Canada PRP Industry Revenue (Million) Forecast, by Application 2019 & 2032
- Table 32: Canada PRP Industry Volume (K Unit) Forecast, by Application 2019 & 2032
- Table 33: Mexico PRP Industry Revenue (Million) Forecast, by Application 2019 & 2032
- Table 34: Mexico PRP Industry Volume (K Unit) Forecast, by Application 2019 & 2032
- Table 35: Global PRP Industry Revenue Million Forecast, by Type 2019 & 2032
- Table 36: Global PRP Industry Volume K Unit Forecast, by Type 2019 & 2032
- Table 37: Global PRP Industry Revenue Million Forecast, by Application 2019 & 2032
- Table 38: Global PRP Industry Volume K Unit Forecast, by Application 2019 & 2032
- Table 39: Global PRP Industry Revenue Million Forecast, by End User 2019 & 2032
- Table 40: Global PRP Industry Volume K Unit Forecast, by End User 2019 & 2032
- Table 41: Global PRP Industry Revenue Million Forecast, by Country 2019 & 2032
- Table 42: Global PRP Industry Volume K Unit Forecast, by Country 2019 & 2032
- Table 43: Germany PRP Industry Revenue (Million) Forecast, by Application 2019 & 2032
- Table 44: Germany PRP Industry Volume (K Unit) Forecast, by Application 2019 & 2032
- Table 45: United Kingdom PRP Industry Revenue (Million) Forecast, by Application 2019 & 2032
- Table 46: United Kingdom PRP Industry Volume (K Unit) Forecast, by Application 2019 & 2032
- Table 47: France PRP Industry Revenue (Million) Forecast, by Application 2019 & 2032
- Table 48: France PRP Industry Volume (K Unit) Forecast, by Application 2019 & 2032
- Table 49: Italy PRP Industry Revenue (Million) Forecast, by Application 2019 & 2032
- Table 50: Italy PRP Industry Volume (K Unit) Forecast, by Application 2019 & 2032
- Table 51: Spain PRP Industry Revenue (Million) Forecast, by Application 2019 & 2032
- Table 52: Spain PRP Industry Volume (K Unit) Forecast, by Application 2019 & 2032
- Table 53: Rest of Europe PRP Industry Revenue (Million) Forecast, by Application 2019 & 2032
- Table 54: Rest of Europe PRP Industry Volume (K Unit) Forecast, by Application 2019 & 2032
- Table 55: Global PRP Industry Revenue Million Forecast, by Type 2019 & 2032
- Table 56: Global PRP Industry Volume K Unit Forecast, by Type 2019 & 2032
- Table 57: Global PRP Industry Revenue Million Forecast, by Application 2019 & 2032
- Table 58: Global PRP Industry Volume K Unit Forecast, by Application 2019 & 2032
- Table 59: Global PRP Industry Revenue Million Forecast, by End User 2019 & 2032
- Table 60: Global PRP Industry Volume K Unit Forecast, by End User 2019 & 2032
- Table 61: Global PRP Industry Revenue Million Forecast, by Country 2019 & 2032
- Table 62: Global PRP Industry Volume K Unit Forecast, by Country 2019 & 2032
- Table 63: China PRP Industry Revenue (Million) Forecast, by Application 2019 & 2032
- Table 64: China PRP Industry Volume (K Unit) Forecast, by Application 2019 & 2032
- Table 65: Japan PRP Industry Revenue (Million) Forecast, by Application 2019 & 2032
- Table 66: Japan PRP Industry Volume (K Unit) Forecast, by Application 2019 & 2032
- Table 67: India PRP Industry Revenue (Million) Forecast, by Application 2019 & 2032
- Table 68: India PRP Industry Volume (K Unit) Forecast, by Application 2019 & 2032
- Table 69: Australia PRP Industry Revenue (Million) Forecast, by Application 2019 & 2032
- Table 70: Australia PRP Industry Volume (K Unit) Forecast, by Application 2019 & 2032
- Table 71: South Korea PRP Industry Revenue (Million) Forecast, by Application 2019 & 2032
- Table 72: South Korea PRP Industry Volume (K Unit) Forecast, by Application 2019 & 2032
- Table 73: Rest of Asia Pacific PRP Industry Revenue (Million) Forecast, by Application 2019 & 2032
- Table 74: Rest of Asia Pacific PRP Industry Volume (K Unit) Forecast, by Application 2019 & 2032
- Table 75: Global PRP Industry Revenue Million Forecast, by Type 2019 & 2032
- Table 76: Global PRP Industry Volume K Unit Forecast, by Type 2019 & 2032
- Table 77: Global PRP Industry Revenue Million Forecast, by Application 2019 & 2032
- Table 78: Global PRP Industry Volume K Unit Forecast, by Application 2019 & 2032
- Table 79: Global PRP Industry Revenue Million Forecast, by End User 2019 & 2032
- Table 80: Global PRP Industry Volume K Unit Forecast, by End User 2019 & 2032
- Table 81: Global PRP Industry Revenue Million Forecast, by Country 2019 & 2032
- Table 82: Global PRP Industry Volume K Unit Forecast, by Country 2019 & 2032
- Table 83: Global PRP Industry Revenue Million Forecast, by Type 2019 & 2032
- Table 84: Global PRP Industry Volume K Unit Forecast, by Type 2019 & 2032
- Table 85: Global PRP Industry Revenue Million Forecast, by Application 2019 & 2032
- Table 86: Global PRP Industry Volume K Unit Forecast, by Application 2019 & 2032
- Table 87: Global PRP Industry Revenue Million Forecast, by End User 2019 & 2032
- Table 88: Global PRP Industry Volume K Unit Forecast, by End User 2019 & 2032
- Table 89: Global PRP Industry Revenue Million Forecast, by Country 2019 & 2032
- Table 90: Global PRP Industry Volume K Unit Forecast, by Country 2019 & 2032
- Table 91: South Africa PRP Industry Revenue (Million) Forecast, by Application 2019 & 2032
- Table 92: South Africa PRP Industry Volume (K Unit) Forecast, by Application 2019 & 2032
- Table 93: Rest of Middle East PRP Industry Revenue (Million) Forecast, by Application 2019 & 2032
- Table 94: Rest of Middle East PRP Industry Volume (K Unit) Forecast, by Application 2019 & 2032
- Table 95: Global PRP Industry Revenue Million Forecast, by Type 2019 & 2032
- Table 96: Global PRP Industry Volume K Unit Forecast, by Type 2019 & 2032
- Table 97: Global PRP Industry Revenue Million Forecast, by Application 2019 & 2032
- Table 98: Global PRP Industry Volume K Unit Forecast, by Application 2019 & 2032
- Table 99: Global PRP Industry Revenue Million Forecast, by End User 2019 & 2032
- Table 100: Global PRP Industry Volume K Unit Forecast, by End User 2019 & 2032
- Table 101: Global PRP Industry Revenue Million Forecast, by Country 2019 & 2032
- Table 102: Global PRP Industry Volume K Unit Forecast, by Country 2019 & 2032
- Table 103: Brazil PRP Industry Revenue (Million) Forecast, by Application 2019 & 2032
- Table 104: Brazil PRP Industry Volume (K Unit) Forecast, by Application 2019 & 2032
- Table 105: Argentina PRP Industry Revenue (Million) Forecast, by Application 2019 & 2032
- Table 106: Argentina PRP Industry Volume (K Unit) Forecast, by Application 2019 & 2032
- Table 107: Rest of South America PRP Industry Revenue (Million) Forecast, by Application 2019 & 2032
- Table 108: Rest of South America PRP Industry Volume (K Unit) Forecast, by Application 2019 & 2032
Frequently Asked Questions
1. What is the projected Compound Annual Growth Rate (CAGR) of the PRP Industry?
The projected CAGR is approximately 9.03%.
2. Which companies are prominent players in the PRP Industry?
Key companies in the market include Terumo BCT Inc, ISTO Biologics, Arthrex Inc, Vertical Spine LLC, T-Biotechnology, DePuy Synthes, EmCyte Corporation, Isto Biologics, Harvest Technologies Corporation, Glofinn Oy, Zimmer Biomet, Dr PRP USA LLC.
3. What are the main segments of the PRP Industry?
The market segments include Type, Application, End User.
4. Can you provide details about the market size?
The market size is estimated to be USD 410.75 Million as of 2022.
5. What are some drivers contributing to market growth?
Rising Incidences of Sports Injuries; Increasing Number of Cosmetic and Surgical Procedures; Growing use of Platelet-rich Plasma in Various Therapeutic Areas.
6. What are the notable trends driving market growth?
The Orthopedics Segment is Expected to Hold the Largest Market Share.
7. Are there any restraints impacting market growth?
Stringent Regulatory Policies; High Prices of Plasma Therapy.
8. Can you provide examples of recent developments in the market?
In February 2021, Atlas Health Medical Group announced PRP (Platelet-rich Plasma) Microneedling Facelifts for patients.
9. What pricing options are available for accessing the report?
Pricing options include single-user, multi-user, and enterprise licenses priced at USD 4750, USD 5250, and USD 8750 respectively.
10. Is the market size provided in terms of value or volume?
The market size is provided in terms of value, measured in Million and volume, measured in K Unit.
11. Are there any specific market keywords associated with the report?
Yes, the market keyword associated with the report is "PRP Industry," which aids in identifying and referencing the specific market segment covered.
12. How do I determine which pricing option suits my needs best?
The pricing options vary based on user requirements and access needs. Individual users may opt for single-user licenses, while businesses requiring broader access may choose multi-user or enterprise licenses for cost-effective access to the report.
13. Are there any additional resources or data provided in the PRP Industry report?
While the report offers comprehensive insights, it's advisable to review the specific contents or supplementary materials provided to ascertain if additional resources or data are available.
14. How can I stay updated on further developments or reports in the PRP Industry?
To stay informed about further developments, trends, and reports in the PRP Industry, consider subscribing to industry newsletters, following relevant companies and organizations, or regularly checking reputable industry news sources and publications.
Methodology
Step 1 - Identification of Relevant Samples Size from Population Database


Step 2 - Approaches for Defining Global Market Size (Value, Volume* & Price*)

Note*: In applicable scenarios
Step 3 - Data Sources
Primary Research
- Web Analytics
- Survey Reports
- Research Institute
- Latest Research Reports
- Opinion Leaders
Secondary Research
- Annual Reports
- White Paper
- Latest Press Release
- Industry Association
- Paid Database
- Investor Presentations

Step 4 - Data Triangulation
Involves using different sources of information in order to increase the validity of a study
These sources are likely to be stakeholders in a program - participants, other researchers, program staff, other community members, and so on.
Then we put all data in single framework & apply various statistical tools to find out the dynamic on the market.
During the analysis stage, feedback from the stakeholder groups would be compared to determine areas of agreement as well as areas of divergence


