
Key Insights
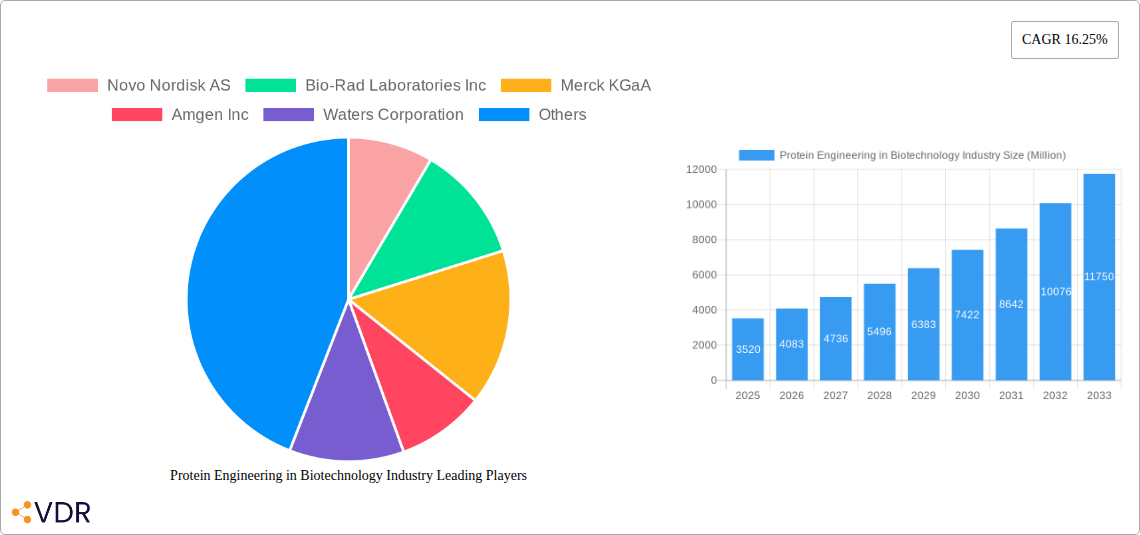
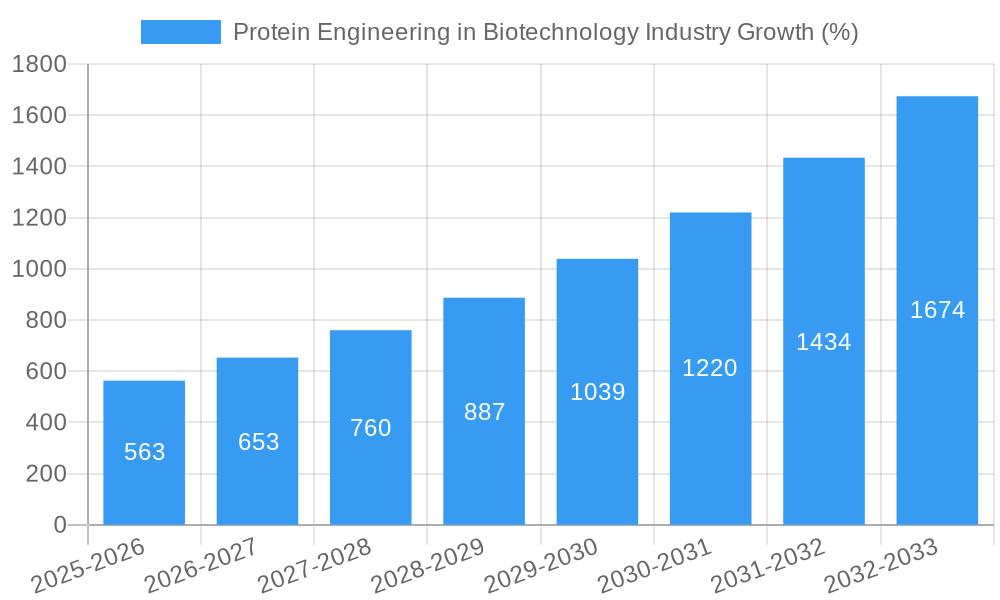
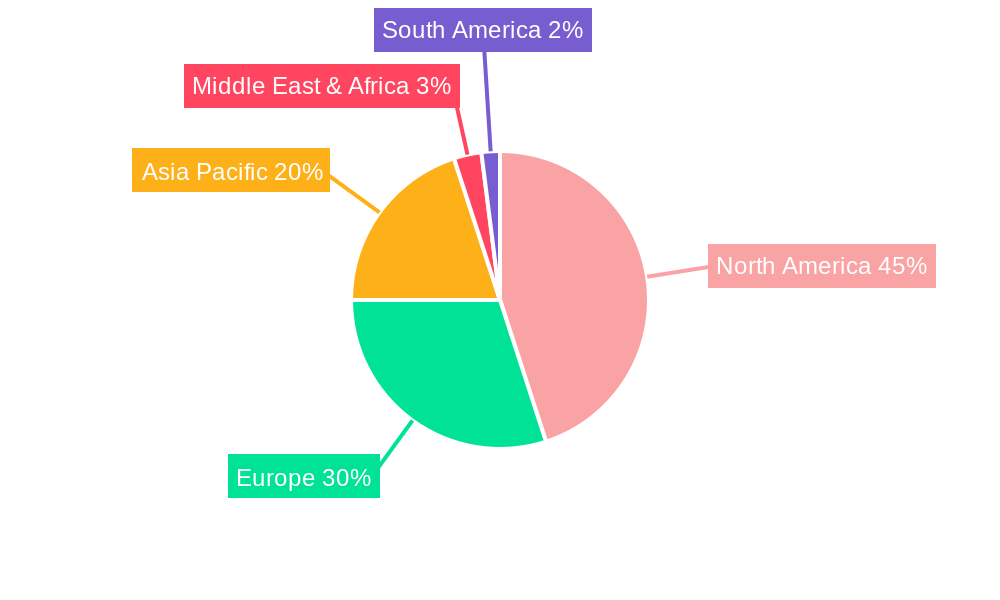
The protein engineering in biotechnology market, valued at $3.52 billion in 2025, is experiencing robust growth, projected to expand at a compound annual growth rate (CAGR) of 16.25% from 2025 to 2033. This surge is driven by several key factors. Firstly, the increasing demand for novel biotherapeutics, such as advanced vaccines and monoclonal antibodies, fuels the need for efficient protein engineering techniques to optimize their efficacy and safety. Secondly, technological advancements in rational and irrational protein design are accelerating the development of more effective and customized biopharmaceuticals. Irrational protein design, leveraging techniques like directed evolution, allows for the exploration of a wider sequence space, while rational design utilizes computational modeling and structural biology to engineer proteins with precise modifications. The pharmaceutical and biotechnology companies are the primary end-users, significantly contributing to market growth. Further expansion is fueled by academic research institutions and contract research organizations (CROs) driving innovation and translating research into commercial applications. Strong regional growth is anticipated across North America (particularly the US), Europe (especially Germany and the UK), and the Asia-Pacific region (led by China and India), driven by established biopharmaceutical hubs and burgeoning research infrastructures. However, challenges such as high R&D costs and stringent regulatory approvals for new biopharmaceuticals could potentially restrain market growth.
The market segmentation reveals significant opportunities across various product types. Insulin, monoclonal antibodies, and coagulation factors constitute substantial portions of the market, with growth factors and other emerging product types showing promising future potential. Leading companies like Novo Nordisk, Amgen, Merck KGaA, and Bio-Rad Laboratories are at the forefront of innovation, actively investing in research and development to enhance their product portfolios. Their technological capabilities in rational and irrational protein design are crucial for maintaining competitive advantage. The market's future trajectory is projected to be significantly influenced by factors such as increasing investments in biotechnology research, growing prevalence of chronic diseases requiring advanced therapeutic solutions, and an expanding global population. This creates a significant market opportunity for companies involved in protein engineering, with continued investment in cutting-edge technologies promising further market expansion.
Protein Engineering in Biotechnology Industry Market Report: 2019-2033
This comprehensive report provides an in-depth analysis of the Protein Engineering in Biotechnology market, encompassing market dynamics, growth trends, regional segmentation, product landscape, key players, and future outlook. The study period spans 2019-2033, with 2025 as the base and estimated year. The report is crucial for pharmaceutical and biotechnology companies, academic institutions, contract research organizations, and investors seeking to understand this rapidly evolving market. The total market size is projected to reach xx Million by 2033.
Protein Engineering in Biotechnology Industry Market Dynamics & Structure
The protein engineering market is characterized by high concentration among leading players like Novo Nordisk AS, Amgen Inc, and Merck KGaA, while numerous smaller companies contribute to innovation. Technological advancements, particularly in rational and irrational protein design, are key growth drivers. Stringent regulatory frameworks and the need for extensive clinical trials influence market entry and expansion. Competitive pressures exist from alternative therapeutic modalities. The market is witnessing a surge in M&A activities, with xx deals recorded in the historical period (2019-2024), driven by the need for expertise and product diversification. The pharmaceutical and biotechnology sector accounts for the largest share (xx%) of the end-user segment.
- Market Concentration: High, with top 5 players holding xx% market share.
- Technological Innovation: Rational and irrational protein design driving growth.
- Regulatory Landscape: Stringent approvals impacting market entry.
- Competitive Substitutes: Gene therapy and other biologics pose competitive pressure.
- M&A Activity: xx deals recorded during 2019-2024, signaling consolidation.
- End-User Demographics: Pharmaceutical and biotech companies dominate (xx%).
Protein Engineering in Biotechnology Industry Growth Trends & Insights
The protein engineering market exhibited a CAGR of xx% during the historical period (2019-2024) and is projected to maintain a CAGR of xx% during the forecast period (2025-2033). This growth is fueled by increasing demand for protein-based therapeutics, rising prevalence of chronic diseases, and ongoing technological advancements enabling improved protein design and production. Adoption rates are highest in developed regions, with emerging markets showing significant growth potential. Consumer preference for targeted therapies and personalized medicine are driving the demand for advanced protein engineering technologies. Disruptive technologies like AI-powered protein design are accelerating product development timelines and cost efficiency. The market size is estimated at xx Million in 2025 and is projected to reach xx Million by 2033.
Dominant Regions, Countries, or Segments in Protein Engineering in Biotechnology Industry
North America currently holds the largest market share (xx%), driven by strong R&D investments, robust regulatory support, and a large number of pharmaceutical and biotechnology companies. Within product types, monoclonal antibodies command the largest segment (xx%), followed by insulin (xx%). Rational protein design technology dominates the market (xx%), while irrational design is gaining traction.
- Key Regional Drivers: North America (strong R&D, regulatory support), Europe (growing biotech sector), Asia-Pacific (rising healthcare expenditure).
- Leading Product Types: Monoclonal antibodies (xx%), Insulin (xx%).
- Dominant Technology: Rational Protein Design (xx%).
- Growth Potential: Emerging markets (Asia-Pacific, Latin America) offer significant opportunities.
Protein Engineering in Biotechnology Industry Product Landscape
The protein engineering market offers a wide range of products, including modified enzymes, therapeutic proteins (e.g., insulin, monoclonal antibodies), and diagnostic tools. Recent innovations focus on enhancing protein stability, efficacy, and reducing immunogenicity. Advancements in high-throughput screening and directed evolution techniques have improved the speed and efficiency of protein engineering processes. Key performance indicators include protein yield, purity, and specific activity. Unique selling propositions often center on improved therapeutic efficacy, reduced side effects, and cost-effectiveness.
Key Drivers, Barriers & Challenges in Protein Engineering in Biotechnology Industry
Key Drivers:
- Rising prevalence of chronic diseases driving demand for effective therapies.
- Technological advancements in protein design and production.
- Increasing investments in R&D by pharmaceutical and biotechnology companies.
Challenges & Restraints:
- High development costs and regulatory hurdles.
- Complex manufacturing processes with potential supply chain disruptions.
- Competition from other therapeutic modalities.
- The cost of bringing a novel protein-based therapeutic to market averages xx Million, impacting the profitability of smaller players.
Emerging Opportunities in Protein Engineering in Biotechnology Industry
- Development of novel protein-based therapeutics for unmet medical needs.
- Expansion into emerging markets with high disease prevalence.
- Application of AI and machine learning in protein design and optimization.
- Personalized medicine and targeted therapies utilizing protein engineering.
Growth Accelerators in the Protein Engineering in Biotechnology Industry
Strategic partnerships between pharmaceutical companies and technology providers are driving market growth. The increasing adoption of AI-powered design tools and automation of manufacturing processes is further accelerating innovation. Expansion into emerging markets with unmet medical needs, such as biosimilars, will continue to fuel market growth.
Key Players Shaping the Protein Engineering in Biotechnology Industry Market
- Novo Nordisk AS
- Bio-Rad Laboratories Inc
- Merck KGaA
- Amgen Inc
- Waters Corporation
- Thermo Fisher Scientific Inc
- Eli Lilly and Company
- GenScript Biotech Corporation
- Agilent Technologies Inc
- PerkinElmer Inc
- Bruker Corporation
- GE HealthCare
Notable Milestones in Protein Engineering in Biotechnology Industry Sector
- April 2024: Northpond-funded Laboratory for Bioengineering Research and Innovation invests in the Wyss Institute's AmnioX project for protein-based drug development.
- March 2023: Arzeda partners with Takeda to utilize AI-powered protein design for optimizing biologics.
In-Depth Protein Engineering in Biotechnology Industry Market Outlook
The protein engineering market is poised for substantial growth, driven by technological advancements, strategic partnerships, and expanding applications in various therapeutic areas. The market's future potential is significant, particularly in areas such as personalized medicine and the development of novel protein-based therapeutics for currently incurable diseases. Strategic investments in R&D, coupled with the ongoing development of innovative technologies, will shape the market's trajectory in the coming years.
Protein Engineering in Biotechnology Industry Segmentation
-
1. Product Type
- 1.1. Insulin
- 1.2. Monoclonal Antibodies
- 1.3. Coagulation Factors
- 1.4. Vaccines
- 1.5. Growth Factors
- 1.6. Other Product Types
-
2. Technology
- 2.1. Irrational Protein Design
- 2.2. Rational Protein Design
-
3. End User
- 3.1. Pharmaceutical and Biotechnology Companies
- 3.2. Academic Institutions
- 3.3. Contract Research Organizations
Protein Engineering in Biotechnology Industry Segmentation By Geography
-
1. North America
- 1.1. United States
- 1.2. Canada
- 1.3. Mexico
-
2. Europe
- 2.1. Germany
- 2.2. United Kingdom
- 2.3. France
- 2.4. Italy
- 2.5. Spain
- 2.6. Rest of Europe
-
3. Asia Pacific
- 3.1. China
- 3.2. Japan
- 3.3. India
- 3.4. Australia
- 3.5. South Korea
- 3.6. Rest of Asia Pacific
-
4. Middle East and Africa
- 4.1. GCC
- 4.2. South Africa
- 4.3. Rest of Middle East and Africa
-
5. South America
- 5.1. Brazil
- 5.2. Argentina
- 5.3. Rest of South America
Protein Engineering in Biotechnology Industry REPORT HIGHLIGHTS
| Aspects | Details |
|---|---|
| Study Period | 2019-2033 |
| Base Year | 2024 |
| Estimated Year | 2025 |
| Forecast Period | 2025-2033 |
| Historical Period | 2019-2024 |
| Growth Rate | CAGR of 16.25% from 2019-2033 |
| Segmentation |
|
Table of Contents
- 1. Introduction
- 1.1. Research Scope
- 1.2. Market Segmentation
- 1.3. Research Methodology
- 1.4. Definitions and Assumptions
- 2. Executive Summary
- 2.1. Introduction
- 3. Market Dynamics
- 3.1. Introduction
- 3.2. Market Drivers
- 3.2.1. Increasing Prevalence of Chronic Diseases and Rise in Demand for Targeted Therapies; Rising Government Funding for Protein Engineering Studies
- 3.3. Market Restrains
- 3.3.1. High Costs of Protein Engineering Techniques
- 3.4. Market Trends
- 3.4.1. The Monoclonal Antibodies Segment is Anticipated to Witness Notable Growth Over the Forecast Period
- 4. Market Factor Analysis
- 4.1. Porters Five Forces
- 4.2. Supply/Value Chain
- 4.3. PESTEL analysis
- 4.4. Market Entropy
- 4.5. Patent/Trademark Analysis
- 5. Global Protein Engineering in Biotechnology Industry Analysis, Insights and Forecast, 2019-2031
- 5.1. Market Analysis, Insights and Forecast - by Product Type
- 5.1.1. Insulin
- 5.1.2. Monoclonal Antibodies
- 5.1.3. Coagulation Factors
- 5.1.4. Vaccines
- 5.1.5. Growth Factors
- 5.1.6. Other Product Types
- 5.2. Market Analysis, Insights and Forecast - by Technology
- 5.2.1. Irrational Protein Design
- 5.2.2. Rational Protein Design
- 5.3. Market Analysis, Insights and Forecast - by End User
- 5.3.1. Pharmaceutical and Biotechnology Companies
- 5.3.2. Academic Institutions
- 5.3.3. Contract Research Organizations
- 5.4. Market Analysis, Insights and Forecast - by Region
- 5.4.1. North America
- 5.4.2. Europe
- 5.4.3. Asia Pacific
- 5.4.4. Middle East and Africa
- 5.4.5. South America
- 5.1. Market Analysis, Insights and Forecast - by Product Type
- 6. North America Protein Engineering in Biotechnology Industry Analysis, Insights and Forecast, 2019-2031
- 6.1. Market Analysis, Insights and Forecast - by Product Type
- 6.1.1. Insulin
- 6.1.2. Monoclonal Antibodies
- 6.1.3. Coagulation Factors
- 6.1.4. Vaccines
- 6.1.5. Growth Factors
- 6.1.6. Other Product Types
- 6.2. Market Analysis, Insights and Forecast - by Technology
- 6.2.1. Irrational Protein Design
- 6.2.2. Rational Protein Design
- 6.3. Market Analysis, Insights and Forecast - by End User
- 6.3.1. Pharmaceutical and Biotechnology Companies
- 6.3.2. Academic Institutions
- 6.3.3. Contract Research Organizations
- 6.1. Market Analysis, Insights and Forecast - by Product Type
- 7. Europe Protein Engineering in Biotechnology Industry Analysis, Insights and Forecast, 2019-2031
- 7.1. Market Analysis, Insights and Forecast - by Product Type
- 7.1.1. Insulin
- 7.1.2. Monoclonal Antibodies
- 7.1.3. Coagulation Factors
- 7.1.4. Vaccines
- 7.1.5. Growth Factors
- 7.1.6. Other Product Types
- 7.2. Market Analysis, Insights and Forecast - by Technology
- 7.2.1. Irrational Protein Design
- 7.2.2. Rational Protein Design
- 7.3. Market Analysis, Insights and Forecast - by End User
- 7.3.1. Pharmaceutical and Biotechnology Companies
- 7.3.2. Academic Institutions
- 7.3.3. Contract Research Organizations
- 7.1. Market Analysis, Insights and Forecast - by Product Type
- 8. Asia Pacific Protein Engineering in Biotechnology Industry Analysis, Insights and Forecast, 2019-2031
- 8.1. Market Analysis, Insights and Forecast - by Product Type
- 8.1.1. Insulin
- 8.1.2. Monoclonal Antibodies
- 8.1.3. Coagulation Factors
- 8.1.4. Vaccines
- 8.1.5. Growth Factors
- 8.1.6. Other Product Types
- 8.2. Market Analysis, Insights and Forecast - by Technology
- 8.2.1. Irrational Protein Design
- 8.2.2. Rational Protein Design
- 8.3. Market Analysis, Insights and Forecast - by End User
- 8.3.1. Pharmaceutical and Biotechnology Companies
- 8.3.2. Academic Institutions
- 8.3.3. Contract Research Organizations
- 8.1. Market Analysis, Insights and Forecast - by Product Type
- 9. Middle East and Africa Protein Engineering in Biotechnology Industry Analysis, Insights and Forecast, 2019-2031
- 9.1. Market Analysis, Insights and Forecast - by Product Type
- 9.1.1. Insulin
- 9.1.2. Monoclonal Antibodies
- 9.1.3. Coagulation Factors
- 9.1.4. Vaccines
- 9.1.5. Growth Factors
- 9.1.6. Other Product Types
- 9.2. Market Analysis, Insights and Forecast - by Technology
- 9.2.1. Irrational Protein Design
- 9.2.2. Rational Protein Design
- 9.3. Market Analysis, Insights and Forecast - by End User
- 9.3.1. Pharmaceutical and Biotechnology Companies
- 9.3.2. Academic Institutions
- 9.3.3. Contract Research Organizations
- 9.1. Market Analysis, Insights and Forecast - by Product Type
- 10. South America Protein Engineering in Biotechnology Industry Analysis, Insights and Forecast, 2019-2031
- 10.1. Market Analysis, Insights and Forecast - by Product Type
- 10.1.1. Insulin
- 10.1.2. Monoclonal Antibodies
- 10.1.3. Coagulation Factors
- 10.1.4. Vaccines
- 10.1.5. Growth Factors
- 10.1.6. Other Product Types
- 10.2. Market Analysis, Insights and Forecast - by Technology
- 10.2.1. Irrational Protein Design
- 10.2.2. Rational Protein Design
- 10.3. Market Analysis, Insights and Forecast - by End User
- 10.3.1. Pharmaceutical and Biotechnology Companies
- 10.3.2. Academic Institutions
- 10.3.3. Contract Research Organizations
- 10.1. Market Analysis, Insights and Forecast - by Product Type
- 11. North America Protein Engineering in Biotechnology Industry Analysis, Insights and Forecast, 2019-2031
- 11.1. Market Analysis, Insights and Forecast - By Country/Sub-region
- 11.1.1 United States
- 11.1.2 Canada
- 11.1.3 Mexico
- 12. Europe Protein Engineering in Biotechnology Industry Analysis, Insights and Forecast, 2019-2031
- 12.1. Market Analysis, Insights and Forecast - By Country/Sub-region
- 12.1.1 Germany
- 12.1.2 United Kingdom
- 12.1.3 France
- 12.1.4 Italy
- 12.1.5 Spain
- 12.1.6 Rest of Europe
- 13. Asia Pacific Protein Engineering in Biotechnology Industry Analysis, Insights and Forecast, 2019-2031
- 13.1. Market Analysis, Insights and Forecast - By Country/Sub-region
- 13.1.1 China
- 13.1.2 Japan
- 13.1.3 India
- 13.1.4 Australia
- 13.1.5 South Korea
- 13.1.6 Rest of Asia Pacific
- 14. Middle East and Africa Protein Engineering in Biotechnology Industry Analysis, Insights and Forecast, 2019-2031
- 14.1. Market Analysis, Insights and Forecast - By Country/Sub-region
- 14.1.1 GCC
- 14.1.2 South Africa
- 14.1.3 Rest of Middle East and Africa
- 15. South America Protein Engineering in Biotechnology Industry Analysis, Insights and Forecast, 2019-2031
- 15.1. Market Analysis, Insights and Forecast - By Country/Sub-region
- 15.1.1 Brazil
- 15.1.2 Argentina
- 15.1.3 Rest of South America
- 16. Competitive Analysis
- 16.1. Global Market Share Analysis 2024
- 16.2. Company Profiles
- 16.2.1 Novo Nordisk AS
- 16.2.1.1. Overview
- 16.2.1.2. Products
- 16.2.1.3. SWOT Analysis
- 16.2.1.4. Recent Developments
- 16.2.1.5. Financials (Based on Availability)
- 16.2.2 Bio-Rad Laboratories Inc
- 16.2.2.1. Overview
- 16.2.2.2. Products
- 16.2.2.3. SWOT Analysis
- 16.2.2.4. Recent Developments
- 16.2.2.5. Financials (Based on Availability)
- 16.2.3 Merck KGaA
- 16.2.3.1. Overview
- 16.2.3.2. Products
- 16.2.3.3. SWOT Analysis
- 16.2.3.4. Recent Developments
- 16.2.3.5. Financials (Based on Availability)
- 16.2.4 Amgen Inc
- 16.2.4.1. Overview
- 16.2.4.2. Products
- 16.2.4.3. SWOT Analysis
- 16.2.4.4. Recent Developments
- 16.2.4.5. Financials (Based on Availability)
- 16.2.5 Waters Corporation
- 16.2.5.1. Overview
- 16.2.5.2. Products
- 16.2.5.3. SWOT Analysis
- 16.2.5.4. Recent Developments
- 16.2.5.5. Financials (Based on Availability)
- 16.2.6 Thermo Fisher Scientific Inc
- 16.2.6.1. Overview
- 16.2.6.2. Products
- 16.2.6.3. SWOT Analysis
- 16.2.6.4. Recent Developments
- 16.2.6.5. Financials (Based on Availability)
- 16.2.7 Eli Lilly and Company
- 16.2.7.1. Overview
- 16.2.7.2. Products
- 16.2.7.3. SWOT Analysis
- 16.2.7.4. Recent Developments
- 16.2.7.5. Financials (Based on Availability)
- 16.2.8 GenScript Biotech Corporation
- 16.2.8.1. Overview
- 16.2.8.2. Products
- 16.2.8.3. SWOT Analysis
- 16.2.8.4. Recent Developments
- 16.2.8.5. Financials (Based on Availability)
- 16.2.9 Agilent Technologies Inc
- 16.2.9.1. Overview
- 16.2.9.2. Products
- 16.2.9.3. SWOT Analysis
- 16.2.9.4. Recent Developments
- 16.2.9.5. Financials (Based on Availability)
- 16.2.10 PerkinElmer Inc
- 16.2.10.1. Overview
- 16.2.10.2. Products
- 16.2.10.3. SWOT Analysis
- 16.2.10.4. Recent Developments
- 16.2.10.5. Financials (Based on Availability)
- 16.2.11 Bruker Corporation
- 16.2.11.1. Overview
- 16.2.11.2. Products
- 16.2.11.3. SWOT Analysis
- 16.2.11.4. Recent Developments
- 16.2.11.5. Financials (Based on Availability)
- 16.2.12 GE HealthCare
- 16.2.12.1. Overview
- 16.2.12.2. Products
- 16.2.12.3. SWOT Analysis
- 16.2.12.4. Recent Developments
- 16.2.12.5. Financials (Based on Availability)
- 16.2.1 Novo Nordisk AS
List of Figures
- Figure 1: Global Protein Engineering in Biotechnology Industry Revenue Breakdown (Million, %) by Region 2024 & 2032
- Figure 2: Global Protein Engineering in Biotechnology Industry Volume Breakdown (K Unit, %) by Region 2024 & 2032
- Figure 3: North America Protein Engineering in Biotechnology Industry Revenue (Million), by Country 2024 & 2032
- Figure 4: North America Protein Engineering in Biotechnology Industry Volume (K Unit), by Country 2024 & 2032
- Figure 5: North America Protein Engineering in Biotechnology Industry Revenue Share (%), by Country 2024 & 2032
- Figure 6: North America Protein Engineering in Biotechnology Industry Volume Share (%), by Country 2024 & 2032
- Figure 7: Europe Protein Engineering in Biotechnology Industry Revenue (Million), by Country 2024 & 2032
- Figure 8: Europe Protein Engineering in Biotechnology Industry Volume (K Unit), by Country 2024 & 2032
- Figure 9: Europe Protein Engineering in Biotechnology Industry Revenue Share (%), by Country 2024 & 2032
- Figure 10: Europe Protein Engineering in Biotechnology Industry Volume Share (%), by Country 2024 & 2032
- Figure 11: Asia Pacific Protein Engineering in Biotechnology Industry Revenue (Million), by Country 2024 & 2032
- Figure 12: Asia Pacific Protein Engineering in Biotechnology Industry Volume (K Unit), by Country 2024 & 2032
- Figure 13: Asia Pacific Protein Engineering in Biotechnology Industry Revenue Share (%), by Country 2024 & 2032
- Figure 14: Asia Pacific Protein Engineering in Biotechnology Industry Volume Share (%), by Country 2024 & 2032
- Figure 15: Middle East and Africa Protein Engineering in Biotechnology Industry Revenue (Million), by Country 2024 & 2032
- Figure 16: Middle East and Africa Protein Engineering in Biotechnology Industry Volume (K Unit), by Country 2024 & 2032
- Figure 17: Middle East and Africa Protein Engineering in Biotechnology Industry Revenue Share (%), by Country 2024 & 2032
- Figure 18: Middle East and Africa Protein Engineering in Biotechnology Industry Volume Share (%), by Country 2024 & 2032
- Figure 19: South America Protein Engineering in Biotechnology Industry Revenue (Million), by Country 2024 & 2032
- Figure 20: South America Protein Engineering in Biotechnology Industry Volume (K Unit), by Country 2024 & 2032
- Figure 21: South America Protein Engineering in Biotechnology Industry Revenue Share (%), by Country 2024 & 2032
- Figure 22: South America Protein Engineering in Biotechnology Industry Volume Share (%), by Country 2024 & 2032
- Figure 23: North America Protein Engineering in Biotechnology Industry Revenue (Million), by Product Type 2024 & 2032
- Figure 24: North America Protein Engineering in Biotechnology Industry Volume (K Unit), by Product Type 2024 & 2032
- Figure 25: North America Protein Engineering in Biotechnology Industry Revenue Share (%), by Product Type 2024 & 2032
- Figure 26: North America Protein Engineering in Biotechnology Industry Volume Share (%), by Product Type 2024 & 2032
- Figure 27: North America Protein Engineering in Biotechnology Industry Revenue (Million), by Technology 2024 & 2032
- Figure 28: North America Protein Engineering in Biotechnology Industry Volume (K Unit), by Technology 2024 & 2032
- Figure 29: North America Protein Engineering in Biotechnology Industry Revenue Share (%), by Technology 2024 & 2032
- Figure 30: North America Protein Engineering in Biotechnology Industry Volume Share (%), by Technology 2024 & 2032
- Figure 31: North America Protein Engineering in Biotechnology Industry Revenue (Million), by End User 2024 & 2032
- Figure 32: North America Protein Engineering in Biotechnology Industry Volume (K Unit), by End User 2024 & 2032
- Figure 33: North America Protein Engineering in Biotechnology Industry Revenue Share (%), by End User 2024 & 2032
- Figure 34: North America Protein Engineering in Biotechnology Industry Volume Share (%), by End User 2024 & 2032
- Figure 35: North America Protein Engineering in Biotechnology Industry Revenue (Million), by Country 2024 & 2032
- Figure 36: North America Protein Engineering in Biotechnology Industry Volume (K Unit), by Country 2024 & 2032
- Figure 37: North America Protein Engineering in Biotechnology Industry Revenue Share (%), by Country 2024 & 2032
- Figure 38: North America Protein Engineering in Biotechnology Industry Volume Share (%), by Country 2024 & 2032
- Figure 39: Europe Protein Engineering in Biotechnology Industry Revenue (Million), by Product Type 2024 & 2032
- Figure 40: Europe Protein Engineering in Biotechnology Industry Volume (K Unit), by Product Type 2024 & 2032
- Figure 41: Europe Protein Engineering in Biotechnology Industry Revenue Share (%), by Product Type 2024 & 2032
- Figure 42: Europe Protein Engineering in Biotechnology Industry Volume Share (%), by Product Type 2024 & 2032
- Figure 43: Europe Protein Engineering in Biotechnology Industry Revenue (Million), by Technology 2024 & 2032
- Figure 44: Europe Protein Engineering in Biotechnology Industry Volume (K Unit), by Technology 2024 & 2032
- Figure 45: Europe Protein Engineering in Biotechnology Industry Revenue Share (%), by Technology 2024 & 2032
- Figure 46: Europe Protein Engineering in Biotechnology Industry Volume Share (%), by Technology 2024 & 2032
- Figure 47: Europe Protein Engineering in Biotechnology Industry Revenue (Million), by End User 2024 & 2032
- Figure 48: Europe Protein Engineering in Biotechnology Industry Volume (K Unit), by End User 2024 & 2032
- Figure 49: Europe Protein Engineering in Biotechnology Industry Revenue Share (%), by End User 2024 & 2032
- Figure 50: Europe Protein Engineering in Biotechnology Industry Volume Share (%), by End User 2024 & 2032
- Figure 51: Europe Protein Engineering in Biotechnology Industry Revenue (Million), by Country 2024 & 2032
- Figure 52: Europe Protein Engineering in Biotechnology Industry Volume (K Unit), by Country 2024 & 2032
- Figure 53: Europe Protein Engineering in Biotechnology Industry Revenue Share (%), by Country 2024 & 2032
- Figure 54: Europe Protein Engineering in Biotechnology Industry Volume Share (%), by Country 2024 & 2032
- Figure 55: Asia Pacific Protein Engineering in Biotechnology Industry Revenue (Million), by Product Type 2024 & 2032
- Figure 56: Asia Pacific Protein Engineering in Biotechnology Industry Volume (K Unit), by Product Type 2024 & 2032
- Figure 57: Asia Pacific Protein Engineering in Biotechnology Industry Revenue Share (%), by Product Type 2024 & 2032
- Figure 58: Asia Pacific Protein Engineering in Biotechnology Industry Volume Share (%), by Product Type 2024 & 2032
- Figure 59: Asia Pacific Protein Engineering in Biotechnology Industry Revenue (Million), by Technology 2024 & 2032
- Figure 60: Asia Pacific Protein Engineering in Biotechnology Industry Volume (K Unit), by Technology 2024 & 2032
- Figure 61: Asia Pacific Protein Engineering in Biotechnology Industry Revenue Share (%), by Technology 2024 & 2032
- Figure 62: Asia Pacific Protein Engineering in Biotechnology Industry Volume Share (%), by Technology 2024 & 2032
- Figure 63: Asia Pacific Protein Engineering in Biotechnology Industry Revenue (Million), by End User 2024 & 2032
- Figure 64: Asia Pacific Protein Engineering in Biotechnology Industry Volume (K Unit), by End User 2024 & 2032
- Figure 65: Asia Pacific Protein Engineering in Biotechnology Industry Revenue Share (%), by End User 2024 & 2032
- Figure 66: Asia Pacific Protein Engineering in Biotechnology Industry Volume Share (%), by End User 2024 & 2032
- Figure 67: Asia Pacific Protein Engineering in Biotechnology Industry Revenue (Million), by Country 2024 & 2032
- Figure 68: Asia Pacific Protein Engineering in Biotechnology Industry Volume (K Unit), by Country 2024 & 2032
- Figure 69: Asia Pacific Protein Engineering in Biotechnology Industry Revenue Share (%), by Country 2024 & 2032
- Figure 70: Asia Pacific Protein Engineering in Biotechnology Industry Volume Share (%), by Country 2024 & 2032
- Figure 71: Middle East and Africa Protein Engineering in Biotechnology Industry Revenue (Million), by Product Type 2024 & 2032
- Figure 72: Middle East and Africa Protein Engineering in Biotechnology Industry Volume (K Unit), by Product Type 2024 & 2032
- Figure 73: Middle East and Africa Protein Engineering in Biotechnology Industry Revenue Share (%), by Product Type 2024 & 2032
- Figure 74: Middle East and Africa Protein Engineering in Biotechnology Industry Volume Share (%), by Product Type 2024 & 2032
- Figure 75: Middle East and Africa Protein Engineering in Biotechnology Industry Revenue (Million), by Technology 2024 & 2032
- Figure 76: Middle East and Africa Protein Engineering in Biotechnology Industry Volume (K Unit), by Technology 2024 & 2032
- Figure 77: Middle East and Africa Protein Engineering in Biotechnology Industry Revenue Share (%), by Technology 2024 & 2032
- Figure 78: Middle East and Africa Protein Engineering in Biotechnology Industry Volume Share (%), by Technology 2024 & 2032
- Figure 79: Middle East and Africa Protein Engineering in Biotechnology Industry Revenue (Million), by End User 2024 & 2032
- Figure 80: Middle East and Africa Protein Engineering in Biotechnology Industry Volume (K Unit), by End User 2024 & 2032
- Figure 81: Middle East and Africa Protein Engineering in Biotechnology Industry Revenue Share (%), by End User 2024 & 2032
- Figure 82: Middle East and Africa Protein Engineering in Biotechnology Industry Volume Share (%), by End User 2024 & 2032
- Figure 83: Middle East and Africa Protein Engineering in Biotechnology Industry Revenue (Million), by Country 2024 & 2032
- Figure 84: Middle East and Africa Protein Engineering in Biotechnology Industry Volume (K Unit), by Country 2024 & 2032
- Figure 85: Middle East and Africa Protein Engineering in Biotechnology Industry Revenue Share (%), by Country 2024 & 2032
- Figure 86: Middle East and Africa Protein Engineering in Biotechnology Industry Volume Share (%), by Country 2024 & 2032
- Figure 87: South America Protein Engineering in Biotechnology Industry Revenue (Million), by Product Type 2024 & 2032
- Figure 88: South America Protein Engineering in Biotechnology Industry Volume (K Unit), by Product Type 2024 & 2032
- Figure 89: South America Protein Engineering in Biotechnology Industry Revenue Share (%), by Product Type 2024 & 2032
- Figure 90: South America Protein Engineering in Biotechnology Industry Volume Share (%), by Product Type 2024 & 2032
- Figure 91: South America Protein Engineering in Biotechnology Industry Revenue (Million), by Technology 2024 & 2032
- Figure 92: South America Protein Engineering in Biotechnology Industry Volume (K Unit), by Technology 2024 & 2032
- Figure 93: South America Protein Engineering in Biotechnology Industry Revenue Share (%), by Technology 2024 & 2032
- Figure 94: South America Protein Engineering in Biotechnology Industry Volume Share (%), by Technology 2024 & 2032
- Figure 95: South America Protein Engineering in Biotechnology Industry Revenue (Million), by End User 2024 & 2032
- Figure 96: South America Protein Engineering in Biotechnology Industry Volume (K Unit), by End User 2024 & 2032
- Figure 97: South America Protein Engineering in Biotechnology Industry Revenue Share (%), by End User 2024 & 2032
- Figure 98: South America Protein Engineering in Biotechnology Industry Volume Share (%), by End User 2024 & 2032
- Figure 99: South America Protein Engineering in Biotechnology Industry Revenue (Million), by Country 2024 & 2032
- Figure 100: South America Protein Engineering in Biotechnology Industry Volume (K Unit), by Country 2024 & 2032
- Figure 101: South America Protein Engineering in Biotechnology Industry Revenue Share (%), by Country 2024 & 2032
- Figure 102: South America Protein Engineering in Biotechnology Industry Volume Share (%), by Country 2024 & 2032
List of Tables
- Table 1: Global Protein Engineering in Biotechnology Industry Revenue Million Forecast, by Region 2019 & 2032
- Table 2: Global Protein Engineering in Biotechnology Industry Volume K Unit Forecast, by Region 2019 & 2032
- Table 3: Global Protein Engineering in Biotechnology Industry Revenue Million Forecast, by Product Type 2019 & 2032
- Table 4: Global Protein Engineering in Biotechnology Industry Volume K Unit Forecast, by Product Type 2019 & 2032
- Table 5: Global Protein Engineering in Biotechnology Industry Revenue Million Forecast, by Technology 2019 & 2032
- Table 6: Global Protein Engineering in Biotechnology Industry Volume K Unit Forecast, by Technology 2019 & 2032
- Table 7: Global Protein Engineering in Biotechnology Industry Revenue Million Forecast, by End User 2019 & 2032
- Table 8: Global Protein Engineering in Biotechnology Industry Volume K Unit Forecast, by End User 2019 & 2032
- Table 9: Global Protein Engineering in Biotechnology Industry Revenue Million Forecast, by Region 2019 & 2032
- Table 10: Global Protein Engineering in Biotechnology Industry Volume K Unit Forecast, by Region 2019 & 2032
- Table 11: Global Protein Engineering in Biotechnology Industry Revenue Million Forecast, by Country 2019 & 2032
- Table 12: Global Protein Engineering in Biotechnology Industry Volume K Unit Forecast, by Country 2019 & 2032
- Table 13: United States Protein Engineering in Biotechnology Industry Revenue (Million) Forecast, by Application 2019 & 2032
- Table 14: United States Protein Engineering in Biotechnology Industry Volume (K Unit) Forecast, by Application 2019 & 2032
- Table 15: Canada Protein Engineering in Biotechnology Industry Revenue (Million) Forecast, by Application 2019 & 2032
- Table 16: Canada Protein Engineering in Biotechnology Industry Volume (K Unit) Forecast, by Application 2019 & 2032
- Table 17: Mexico Protein Engineering in Biotechnology Industry Revenue (Million) Forecast, by Application 2019 & 2032
- Table 18: Mexico Protein Engineering in Biotechnology Industry Volume (K Unit) Forecast, by Application 2019 & 2032
- Table 19: Global Protein Engineering in Biotechnology Industry Revenue Million Forecast, by Country 2019 & 2032
- Table 20: Global Protein Engineering in Biotechnology Industry Volume K Unit Forecast, by Country 2019 & 2032
- Table 21: Germany Protein Engineering in Biotechnology Industry Revenue (Million) Forecast, by Application 2019 & 2032
- Table 22: Germany Protein Engineering in Biotechnology Industry Volume (K Unit) Forecast, by Application 2019 & 2032
- Table 23: United Kingdom Protein Engineering in Biotechnology Industry Revenue (Million) Forecast, by Application 2019 & 2032
- Table 24: United Kingdom Protein Engineering in Biotechnology Industry Volume (K Unit) Forecast, by Application 2019 & 2032
- Table 25: France Protein Engineering in Biotechnology Industry Revenue (Million) Forecast, by Application 2019 & 2032
- Table 26: France Protein Engineering in Biotechnology Industry Volume (K Unit) Forecast, by Application 2019 & 2032
- Table 27: Italy Protein Engineering in Biotechnology Industry Revenue (Million) Forecast, by Application 2019 & 2032
- Table 28: Italy Protein Engineering in Biotechnology Industry Volume (K Unit) Forecast, by Application 2019 & 2032
- Table 29: Spain Protein Engineering in Biotechnology Industry Revenue (Million) Forecast, by Application 2019 & 2032
- Table 30: Spain Protein Engineering in Biotechnology Industry Volume (K Unit) Forecast, by Application 2019 & 2032
- Table 31: Rest of Europe Protein Engineering in Biotechnology Industry Revenue (Million) Forecast, by Application 2019 & 2032
- Table 32: Rest of Europe Protein Engineering in Biotechnology Industry Volume (K Unit) Forecast, by Application 2019 & 2032
- Table 33: Global Protein Engineering in Biotechnology Industry Revenue Million Forecast, by Country 2019 & 2032
- Table 34: Global Protein Engineering in Biotechnology Industry Volume K Unit Forecast, by Country 2019 & 2032
- Table 35: China Protein Engineering in Biotechnology Industry Revenue (Million) Forecast, by Application 2019 & 2032
- Table 36: China Protein Engineering in Biotechnology Industry Volume (K Unit) Forecast, by Application 2019 & 2032
- Table 37: Japan Protein Engineering in Biotechnology Industry Revenue (Million) Forecast, by Application 2019 & 2032
- Table 38: Japan Protein Engineering in Biotechnology Industry Volume (K Unit) Forecast, by Application 2019 & 2032
- Table 39: India Protein Engineering in Biotechnology Industry Revenue (Million) Forecast, by Application 2019 & 2032
- Table 40: India Protein Engineering in Biotechnology Industry Volume (K Unit) Forecast, by Application 2019 & 2032
- Table 41: Australia Protein Engineering in Biotechnology Industry Revenue (Million) Forecast, by Application 2019 & 2032
- Table 42: Australia Protein Engineering in Biotechnology Industry Volume (K Unit) Forecast, by Application 2019 & 2032
- Table 43: South Korea Protein Engineering in Biotechnology Industry Revenue (Million) Forecast, by Application 2019 & 2032
- Table 44: South Korea Protein Engineering in Biotechnology Industry Volume (K Unit) Forecast, by Application 2019 & 2032
- Table 45: Rest of Asia Pacific Protein Engineering in Biotechnology Industry Revenue (Million) Forecast, by Application 2019 & 2032
- Table 46: Rest of Asia Pacific Protein Engineering in Biotechnology Industry Volume (K Unit) Forecast, by Application 2019 & 2032
- Table 47: Global Protein Engineering in Biotechnology Industry Revenue Million Forecast, by Country 2019 & 2032
- Table 48: Global Protein Engineering in Biotechnology Industry Volume K Unit Forecast, by Country 2019 & 2032
- Table 49: GCC Protein Engineering in Biotechnology Industry Revenue (Million) Forecast, by Application 2019 & 2032
- Table 50: GCC Protein Engineering in Biotechnology Industry Volume (K Unit) Forecast, by Application 2019 & 2032
- Table 51: South Africa Protein Engineering in Biotechnology Industry Revenue (Million) Forecast, by Application 2019 & 2032
- Table 52: South Africa Protein Engineering in Biotechnology Industry Volume (K Unit) Forecast, by Application 2019 & 2032
- Table 53: Rest of Middle East and Africa Protein Engineering in Biotechnology Industry Revenue (Million) Forecast, by Application 2019 & 2032
- Table 54: Rest of Middle East and Africa Protein Engineering in Biotechnology Industry Volume (K Unit) Forecast, by Application 2019 & 2032
- Table 55: Global Protein Engineering in Biotechnology Industry Revenue Million Forecast, by Country 2019 & 2032
- Table 56: Global Protein Engineering in Biotechnology Industry Volume K Unit Forecast, by Country 2019 & 2032
- Table 57: Brazil Protein Engineering in Biotechnology Industry Revenue (Million) Forecast, by Application 2019 & 2032
- Table 58: Brazil Protein Engineering in Biotechnology Industry Volume (K Unit) Forecast, by Application 2019 & 2032
- Table 59: Argentina Protein Engineering in Biotechnology Industry Revenue (Million) Forecast, by Application 2019 & 2032
- Table 60: Argentina Protein Engineering in Biotechnology Industry Volume (K Unit) Forecast, by Application 2019 & 2032
- Table 61: Rest of South America Protein Engineering in Biotechnology Industry Revenue (Million) Forecast, by Application 2019 & 2032
- Table 62: Rest of South America Protein Engineering in Biotechnology Industry Volume (K Unit) Forecast, by Application 2019 & 2032
- Table 63: Global Protein Engineering in Biotechnology Industry Revenue Million Forecast, by Product Type 2019 & 2032
- Table 64: Global Protein Engineering in Biotechnology Industry Volume K Unit Forecast, by Product Type 2019 & 2032
- Table 65: Global Protein Engineering in Biotechnology Industry Revenue Million Forecast, by Technology 2019 & 2032
- Table 66: Global Protein Engineering in Biotechnology Industry Volume K Unit Forecast, by Technology 2019 & 2032
- Table 67: Global Protein Engineering in Biotechnology Industry Revenue Million Forecast, by End User 2019 & 2032
- Table 68: Global Protein Engineering in Biotechnology Industry Volume K Unit Forecast, by End User 2019 & 2032
- Table 69: Global Protein Engineering in Biotechnology Industry Revenue Million Forecast, by Country 2019 & 2032
- Table 70: Global Protein Engineering in Biotechnology Industry Volume K Unit Forecast, by Country 2019 & 2032
- Table 71: United States Protein Engineering in Biotechnology Industry Revenue (Million) Forecast, by Application 2019 & 2032
- Table 72: United States Protein Engineering in Biotechnology Industry Volume (K Unit) Forecast, by Application 2019 & 2032
- Table 73: Canada Protein Engineering in Biotechnology Industry Revenue (Million) Forecast, by Application 2019 & 2032
- Table 74: Canada Protein Engineering in Biotechnology Industry Volume (K Unit) Forecast, by Application 2019 & 2032
- Table 75: Mexico Protein Engineering in Biotechnology Industry Revenue (Million) Forecast, by Application 2019 & 2032
- Table 76: Mexico Protein Engineering in Biotechnology Industry Volume (K Unit) Forecast, by Application 2019 & 2032
- Table 77: Global Protein Engineering in Biotechnology Industry Revenue Million Forecast, by Product Type 2019 & 2032
- Table 78: Global Protein Engineering in Biotechnology Industry Volume K Unit Forecast, by Product Type 2019 & 2032
- Table 79: Global Protein Engineering in Biotechnology Industry Revenue Million Forecast, by Technology 2019 & 2032
- Table 80: Global Protein Engineering in Biotechnology Industry Volume K Unit Forecast, by Technology 2019 & 2032
- Table 81: Global Protein Engineering in Biotechnology Industry Revenue Million Forecast, by End User 2019 & 2032
- Table 82: Global Protein Engineering in Biotechnology Industry Volume K Unit Forecast, by End User 2019 & 2032
- Table 83: Global Protein Engineering in Biotechnology Industry Revenue Million Forecast, by Country 2019 & 2032
- Table 84: Global Protein Engineering in Biotechnology Industry Volume K Unit Forecast, by Country 2019 & 2032
- Table 85: Germany Protein Engineering in Biotechnology Industry Revenue (Million) Forecast, by Application 2019 & 2032
- Table 86: Germany Protein Engineering in Biotechnology Industry Volume (K Unit) Forecast, by Application 2019 & 2032
- Table 87: United Kingdom Protein Engineering in Biotechnology Industry Revenue (Million) Forecast, by Application 2019 & 2032
- Table 88: United Kingdom Protein Engineering in Biotechnology Industry Volume (K Unit) Forecast, by Application 2019 & 2032
- Table 89: France Protein Engineering in Biotechnology Industry Revenue (Million) Forecast, by Application 2019 & 2032
- Table 90: France Protein Engineering in Biotechnology Industry Volume (K Unit) Forecast, by Application 2019 & 2032
- Table 91: Italy Protein Engineering in Biotechnology Industry Revenue (Million) Forecast, by Application 2019 & 2032
- Table 92: Italy Protein Engineering in Biotechnology Industry Volume (K Unit) Forecast, by Application 2019 & 2032
- Table 93: Spain Protein Engineering in Biotechnology Industry Revenue (Million) Forecast, by Application 2019 & 2032
- Table 94: Spain Protein Engineering in Biotechnology Industry Volume (K Unit) Forecast, by Application 2019 & 2032
- Table 95: Rest of Europe Protein Engineering in Biotechnology Industry Revenue (Million) Forecast, by Application 2019 & 2032
- Table 96: Rest of Europe Protein Engineering in Biotechnology Industry Volume (K Unit) Forecast, by Application 2019 & 2032
- Table 97: Global Protein Engineering in Biotechnology Industry Revenue Million Forecast, by Product Type 2019 & 2032
- Table 98: Global Protein Engineering in Biotechnology Industry Volume K Unit Forecast, by Product Type 2019 & 2032
- Table 99: Global Protein Engineering in Biotechnology Industry Revenue Million Forecast, by Technology 2019 & 2032
- Table 100: Global Protein Engineering in Biotechnology Industry Volume K Unit Forecast, by Technology 2019 & 2032
- Table 101: Global Protein Engineering in Biotechnology Industry Revenue Million Forecast, by End User 2019 & 2032
- Table 102: Global Protein Engineering in Biotechnology Industry Volume K Unit Forecast, by End User 2019 & 2032
- Table 103: Global Protein Engineering in Biotechnology Industry Revenue Million Forecast, by Country 2019 & 2032
- Table 104: Global Protein Engineering in Biotechnology Industry Volume K Unit Forecast, by Country 2019 & 2032
- Table 105: China Protein Engineering in Biotechnology Industry Revenue (Million) Forecast, by Application 2019 & 2032
- Table 106: China Protein Engineering in Biotechnology Industry Volume (K Unit) Forecast, by Application 2019 & 2032
- Table 107: Japan Protein Engineering in Biotechnology Industry Revenue (Million) Forecast, by Application 2019 & 2032
- Table 108: Japan Protein Engineering in Biotechnology Industry Volume (K Unit) Forecast, by Application 2019 & 2032
- Table 109: India Protein Engineering in Biotechnology Industry Revenue (Million) Forecast, by Application 2019 & 2032
- Table 110: India Protein Engineering in Biotechnology Industry Volume (K Unit) Forecast, by Application 2019 & 2032
- Table 111: Australia Protein Engineering in Biotechnology Industry Revenue (Million) Forecast, by Application 2019 & 2032
- Table 112: Australia Protein Engineering in Biotechnology Industry Volume (K Unit) Forecast, by Application 2019 & 2032
- Table 113: South Korea Protein Engineering in Biotechnology Industry Revenue (Million) Forecast, by Application 2019 & 2032
- Table 114: South Korea Protein Engineering in Biotechnology Industry Volume (K Unit) Forecast, by Application 2019 & 2032
- Table 115: Rest of Asia Pacific Protein Engineering in Biotechnology Industry Revenue (Million) Forecast, by Application 2019 & 2032
- Table 116: Rest of Asia Pacific Protein Engineering in Biotechnology Industry Volume (K Unit) Forecast, by Application 2019 & 2032
- Table 117: Global Protein Engineering in Biotechnology Industry Revenue Million Forecast, by Product Type 2019 & 2032
- Table 118: Global Protein Engineering in Biotechnology Industry Volume K Unit Forecast, by Product Type 2019 & 2032
- Table 119: Global Protein Engineering in Biotechnology Industry Revenue Million Forecast, by Technology 2019 & 2032
- Table 120: Global Protein Engineering in Biotechnology Industry Volume K Unit Forecast, by Technology 2019 & 2032
- Table 121: Global Protein Engineering in Biotechnology Industry Revenue Million Forecast, by End User 2019 & 2032
- Table 122: Global Protein Engineering in Biotechnology Industry Volume K Unit Forecast, by End User 2019 & 2032
- Table 123: Global Protein Engineering in Biotechnology Industry Revenue Million Forecast, by Country 2019 & 2032
- Table 124: Global Protein Engineering in Biotechnology Industry Volume K Unit Forecast, by Country 2019 & 2032
- Table 125: GCC Protein Engineering in Biotechnology Industry Revenue (Million) Forecast, by Application 2019 & 2032
- Table 126: GCC Protein Engineering in Biotechnology Industry Volume (K Unit) Forecast, by Application 2019 & 2032
- Table 127: South Africa Protein Engineering in Biotechnology Industry Revenue (Million) Forecast, by Application 2019 & 2032
- Table 128: South Africa Protein Engineering in Biotechnology Industry Volume (K Unit) Forecast, by Application 2019 & 2032
- Table 129: Rest of Middle East and Africa Protein Engineering in Biotechnology Industry Revenue (Million) Forecast, by Application 2019 & 2032
- Table 130: Rest of Middle East and Africa Protein Engineering in Biotechnology Industry Volume (K Unit) Forecast, by Application 2019 & 2032
- Table 131: Global Protein Engineering in Biotechnology Industry Revenue Million Forecast, by Product Type 2019 & 2032
- Table 132: Global Protein Engineering in Biotechnology Industry Volume K Unit Forecast, by Product Type 2019 & 2032
- Table 133: Global Protein Engineering in Biotechnology Industry Revenue Million Forecast, by Technology 2019 & 2032
- Table 134: Global Protein Engineering in Biotechnology Industry Volume K Unit Forecast, by Technology 2019 & 2032
- Table 135: Global Protein Engineering in Biotechnology Industry Revenue Million Forecast, by End User 2019 & 2032
- Table 136: Global Protein Engineering in Biotechnology Industry Volume K Unit Forecast, by End User 2019 & 2032
- Table 137: Global Protein Engineering in Biotechnology Industry Revenue Million Forecast, by Country 2019 & 2032
- Table 138: Global Protein Engineering in Biotechnology Industry Volume K Unit Forecast, by Country 2019 & 2032
- Table 139: Brazil Protein Engineering in Biotechnology Industry Revenue (Million) Forecast, by Application 2019 & 2032
- Table 140: Brazil Protein Engineering in Biotechnology Industry Volume (K Unit) Forecast, by Application 2019 & 2032
- Table 141: Argentina Protein Engineering in Biotechnology Industry Revenue (Million) Forecast, by Application 2019 & 2032
- Table 142: Argentina Protein Engineering in Biotechnology Industry Volume (K Unit) Forecast, by Application 2019 & 2032
- Table 143: Rest of South America Protein Engineering in Biotechnology Industry Revenue (Million) Forecast, by Application 2019 & 2032
- Table 144: Rest of South America Protein Engineering in Biotechnology Industry Volume (K Unit) Forecast, by Application 2019 & 2032
Frequently Asked Questions
1. What is the projected Compound Annual Growth Rate (CAGR) of the Protein Engineering in Biotechnology Industry?
The projected CAGR is approximately 16.25%.
2. Which companies are prominent players in the Protein Engineering in Biotechnology Industry?
Key companies in the market include Novo Nordisk AS, Bio-Rad Laboratories Inc, Merck KGaA, Amgen Inc, Waters Corporation, Thermo Fisher Scientific Inc, Eli Lilly and Company, GenScript Biotech Corporation, Agilent Technologies Inc, PerkinElmer Inc, Bruker Corporation, GE HealthCare.
3. What are the main segments of the Protein Engineering in Biotechnology Industry?
The market segments include Product Type, Technology, End User.
4. Can you provide details about the market size?
The market size is estimated to be USD 3.52 Million as of 2022.
5. What are some drivers contributing to market growth?
Increasing Prevalence of Chronic Diseases and Rise in Demand for Targeted Therapies; Rising Government Funding for Protein Engineering Studies.
6. What are the notable trends driving market growth?
The Monoclonal Antibodies Segment is Anticipated to Witness Notable Growth Over the Forecast Period.
7. Are there any restraints impacting market growth?
High Costs of Protein Engineering Techniques.
8. Can you provide examples of recent developments in the market?
April 2024: Northpond-funded Laboratory for Bioengineering Research and Innovation made an investment with the Wyss Institute for the AmnioX project to facilitate the development of protein-based drugs, thus improving the accessibility of medicines to patients.
9. What pricing options are available for accessing the report?
Pricing options include single-user, multi-user, and enterprise licenses priced at USD 4750, USD 5250, and USD 8750 respectively.
10. Is the market size provided in terms of value or volume?
The market size is provided in terms of value, measured in Million and volume, measured in K Unit.
11. Are there any specific market keywords associated with the report?
Yes, the market keyword associated with the report is "Protein Engineering in Biotechnology Industry," which aids in identifying and referencing the specific market segment covered.
12. How do I determine which pricing option suits my needs best?
The pricing options vary based on user requirements and access needs. Individual users may opt for single-user licenses, while businesses requiring broader access may choose multi-user or enterprise licenses for cost-effective access to the report.
13. Are there any additional resources or data provided in the Protein Engineering in Biotechnology Industry report?
While the report offers comprehensive insights, it's advisable to review the specific contents or supplementary materials provided to ascertain if additional resources or data are available.
14. How can I stay updated on further developments or reports in the Protein Engineering in Biotechnology Industry?
To stay informed about further developments, trends, and reports in the Protein Engineering in Biotechnology Industry, consider subscribing to industry newsletters, following relevant companies and organizations, or regularly checking reputable industry news sources and publications.
Methodology
Step 1 - Identification of Relevant Samples Size from Population Database


Step 2 - Approaches for Defining Global Market Size (Value, Volume* & Price*)

Note*: In applicable scenarios
Step 3 - Data Sources
Primary Research
- Web Analytics
- Survey Reports
- Research Institute
- Latest Research Reports
- Opinion Leaders
Secondary Research
- Annual Reports
- White Paper
- Latest Press Release
- Industry Association
- Paid Database
- Investor Presentations

Step 4 - Data Triangulation
Involves using different sources of information in order to increase the validity of a study
These sources are likely to be stakeholders in a program - participants, other researchers, program staff, other community members, and so on.
Then we put all data in single framework & apply various statistical tools to find out the dynamic on the market.
During the analysis stage, feedback from the stakeholder groups would be compared to determine areas of agreement as well as areas of divergence


