
Key Insights
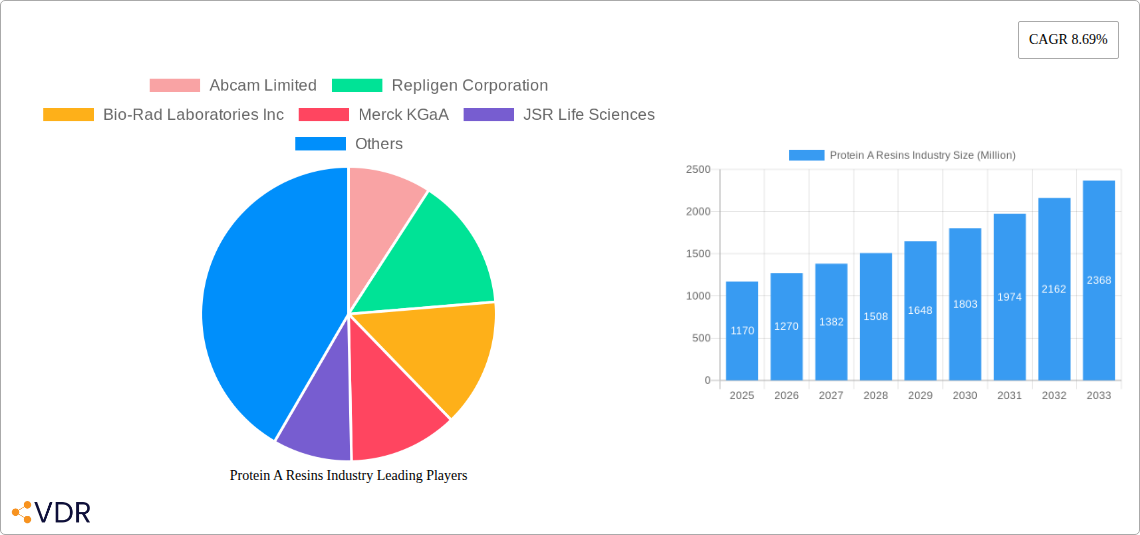
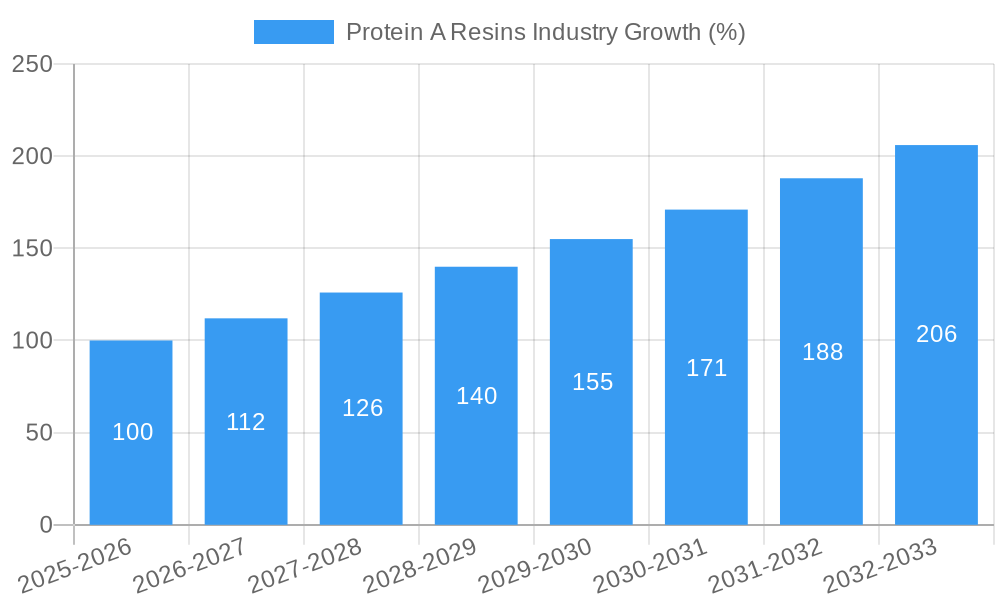
The Protein A Resins market is experiencing robust growth, projected to reach \$1.17 billion in 2025 and maintain a Compound Annual Growth Rate (CAGR) of 8.69% from 2025 to 2033. This expansion is fueled by several key drivers. The burgeoning biopharmaceutical industry, with its increasing reliance on monoclonal antibody (mAb) therapies, significantly boosts demand for high-purity protein A resins used in downstream purification processes. Advancements in resin technology, such as the development of high-capacity, high-selectivity resins, further contribute to market growth. The growing adoption of continuous chromatography processes, which offer improved efficiency and reduced processing times, also positively impacts market dynamics. Increased investments in research and development across pharmaceutical and biotechnology companies are driving innovation in resin design and applications, leading to enhanced purification capabilities and higher yields. Furthermore, the expanding application of protein A resins beyond antibody purification, into areas like immunoprecipitation and other bioprocessing techniques, is expected to broaden the market further.
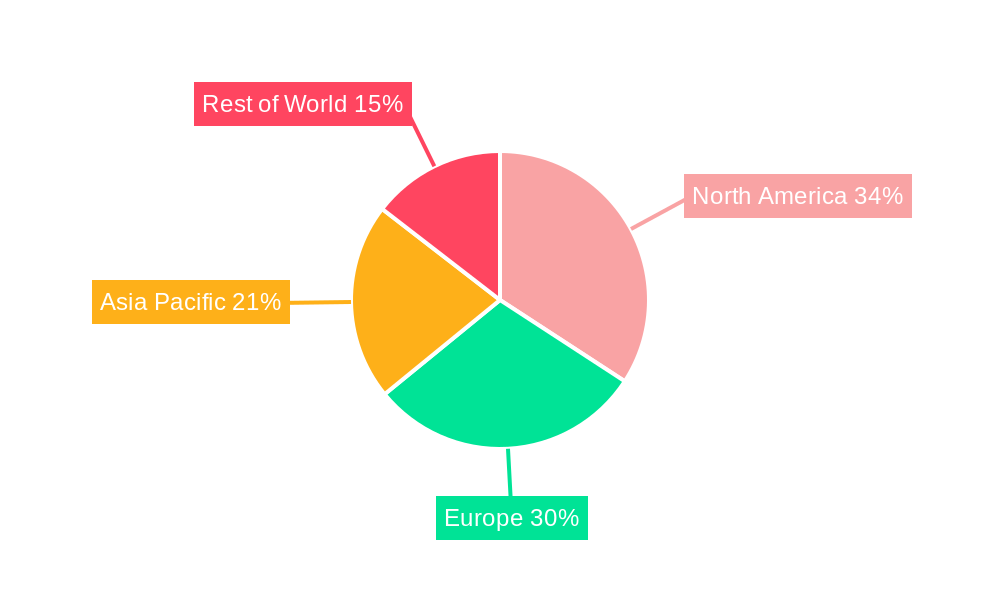
Despite the positive outlook, certain restraints influence market growth. The high cost of protein A resins and the stringent regulatory requirements for biopharmaceutical manufacturing can present challenges to market expansion. Moreover, the emergence of alternative purification technologies might influence market share, although Protein A resins remain the industry standard for mAb purification. However, the anticipated growth in the biopharmaceutical sector and ongoing technological advancements within the industry are poised to offset these limitations and ensure sustained growth for the Protein A resins market throughout the forecast period. The market segmentation by product type (Agarose-based, Glass or Silica-based, Organic Polymer-based) and application (Antibody purification, Immunoprecipitation) reflects the diverse applications and technological advancements within the industry. Geographical analysis shows significant contributions from North America and Europe, reflecting established biopharmaceutical hubs. However, the Asia-Pacific region is poised for rapid expansion due to increasing investments in biotechnological infrastructure and growing local demand for biopharmaceuticals.
Protein A Resins Industry Market Report: 2019-2033
This comprehensive report provides an in-depth analysis of the Protein A Resins industry, encompassing market dynamics, growth trends, competitive landscape, and future outlook. With a study period spanning 2019-2033, a base year of 2025, and a forecast period of 2025-2033, this report is an essential resource for industry professionals, investors, and researchers seeking to understand this vital segment within the larger bioprocessing market. The report's analysis covers key segments including Agarose-based, Glass/Silica-based, and Organic Polymer-based Protein A resins, applications such as Antibody Purification and Immunoprecipitation, and end-users like Pharmaceutical & Biopharmaceutical Companies and Research Laboratories. The global Protein A resins market size is projected to reach xx Million by 2033.
Protein A Resins Industry Market Dynamics & Structure
The Protein A Resins market is characterized by moderate concentration, with key players holding significant market share. Technological innovation, particularly in resin design and performance, is a crucial driver. Stringent regulatory frameworks, especially concerning biopharmaceutical manufacturing, influence market growth. Competitive pressures from substitute technologies and the emergence of novel purification methods impact market dynamics. The end-user demographic is largely concentrated in developed regions with robust pharmaceutical and biotechnology sectors. The industry is witnessing an increase in mergers and acquisitions (M&A) activity, as larger companies consolidate their positions and expand their product portfolios.
- Market Concentration: Moderately concentrated, with top 5 players holding approximately xx% market share in 2024.
- Technological Innovation: Focus on improving resin capacity, purity, and throughput.
- Regulatory Framework: Stringent GMP (Good Manufacturing Practices) compliance requirements.
- Competitive Substitutes: Emerging technologies like alternative affinity chromatography resins.
- M&A Activity: xx major M&A deals observed between 2019 and 2024, resulting in xx Million in total deal value.
- End-User Demographics: Predominantly Pharmaceutical and Biopharmaceutical companies in North America and Europe.
Protein A Resins Industry Growth Trends & Insights
The Protein A Resins market exhibited a CAGR of xx% during the historical period (2019-2024). Driven by the increasing demand for biologics, particularly monoclonal antibodies (mAbs), the market is expected to continue its robust growth trajectory. Adoption rates are high among established biopharmaceutical companies, and expanding into emerging markets is also a significant growth driver. Technological disruptions, such as the development of next-generation resins with enhanced performance, are accelerating market growth. Shifting consumer behavior towards personalized medicine further fuels the demand for advanced purification technologies. Market penetration within emerging economies is still relatively low, presenting considerable expansion opportunities. The overall market is predicted to reach xx Million by 2033.
Dominant Regions, Countries, or Segments in Protein A Resins Industry
North America and Europe currently dominate the Protein A Resins market, fueled by the presence of major pharmaceutical companies and well-established research infrastructure. Within product segments, Agarose-based resins hold the largest market share due to their established performance and cost-effectiveness. Antibody purification remains the most significant application segment, driven by the biopharmaceutical industry's reliance on mAbs.
- Leading Region: North America
- Key Drivers (North America): Strong presence of biopharmaceutical companies, robust R&D spending, and favorable regulatory environment.
- Key Drivers (Europe): High concentration of biotechnology hubs, supportive government policies, and skilled workforce.
- Dominant Product Segment: Agarose-based Protein A resins (xx% market share in 2024).
- Dominant Application Segment: Antibody purification (xx% market share in 2024).
Protein A Resins Industry Product Landscape
The Protein A Resins market offers a diverse range of products tailored to specific application requirements. Recent innovations focus on enhanced binding capacity, improved flow rates, and reduced nonspecific binding. Manufacturers are actively developing resins with improved scalability and durability to meet the growing demands of biopharmaceutical manufacturing. Key features like increased ligand density and optimized pore size are enhancing resin performance.
Key Drivers, Barriers & Challenges in Protein A Resins Industry
Key Drivers:
- The surging demand for biologics, primarily monoclonal antibodies (mAbs).
- Advancements in resin technology leading to improved efficiency and throughput.
- Growing adoption of downstream processing technologies within the biopharmaceutical industry.
Key Challenges:
- Competition from emerging purification technologies.
- Fluctuations in raw material prices impacting manufacturing costs.
- Stringent regulatory requirements for biopharmaceutical manufacturing.
Emerging Opportunities in Protein A Resins Industry
- Expansion into emerging markets with growing biopharmaceutical industries.
- Development of specialized resins for purification of novel biologics.
- Integration of automation and process intensification technologies to enhance efficiency.
Growth Accelerators in the Protein A Resins Industry Industry
Technological advancements, particularly in resin design and manufacturing processes, are key growth catalysts. Strategic partnerships between resin manufacturers and biopharmaceutical companies enable the development of customized solutions and accelerate product adoption. Expansion into new geographic markets and applications will further fuel market growth.
Key Players Shaping the Protein A Resins Industry Market
- Abcam Limited
- Repligen Corporation
- Bio-Rad Laboratories Inc
- Merck KGaA
- JSR Life Sciences
- Kaneka Corporation
- Genscript Corporation
- Tosoh Bioscience LLC
- Danaher Corporation (Cytiva)
- Axplora
- Thermofisher Scientific Inc
- Agarose Beads Technologies
- Ecolab Inc (Purolite Lifesciences)
Notable Milestones in Protein A Resins Industry Sector
- February 2024: Purolite (Ecolab) and Repligen Corporation launched Praesto CH1, a new 70 μm agarose-based affinity resin for purifying specialized mAbs.
- January 2024: Oxitope and Arxx merged to form Calluna Pharma Inc., raising USD 80.4 million for monoclonal antibody therapies.
In-Depth Protein A Resins Industry Market Outlook
The Protein A Resins market is poised for continued growth, driven by technological innovations and increasing demand for biologics. Strategic partnerships and market expansion into emerging economies will play a vital role in shaping the future market landscape. Companies focusing on developing high-performance, cost-effective resins are best positioned to capitalize on the market's growth potential.
Protein A Resins Industry Segmentation
-
1. Product
- 1.1. Agarose -based Protein
- 1.2. Glass or Silica-based Protein
- 1.3. Organic Polymer-based Protein
-
2. Application
- 2.1. Antibody Purification
- 2.2. Immunoprecipitation
-
3. End User
- 3.1. Pharmaceutical and Biopharmaceutical Companies
- 3.2. Research Laboratories
- 3.3. Other End Users
Protein A Resins Industry Segmentation By Geography
-
1. North America
- 1.1. United States
- 1.2. Canada
- 1.3. Mexico
-
2. Europe
- 2.1. Germany
- 2.2. United Kingdom
- 2.3. France
- 2.4. Italy
- 2.5. Spain
- 2.6. Rest of Europe
-
3. Asia Pacific
- 3.1. China
- 3.2. Japan
- 3.3. India
- 3.4. Australia
- 3.5. South Korea
- 3.6. Rest of Asia Pacific
-
4. Middle East and Africa
- 4.1. GCC
- 4.2. South Africa
- 4.3. Rest of Middle East and Africa
-
5. South America
- 5.1. Brazil
- 5.2. Argentina
- 5.3. Rest of South America
Protein A Resins Industry REPORT HIGHLIGHTS
| Aspects | Details |
|---|---|
| Study Period | 2019-2033 |
| Base Year | 2024 |
| Estimated Year | 2025 |
| Forecast Period | 2025-2033 |
| Historical Period | 2019-2024 |
| Growth Rate | CAGR of 8.69% from 2019-2033 |
| Segmentation |
|
Table of Contents
- 1. Introduction
- 1.1. Research Scope
- 1.2. Market Segmentation
- 1.3. Research Methodology
- 1.4. Definitions and Assumptions
- 2. Executive Summary
- 2.1. Introduction
- 3. Market Dynamics
- 3.1. Introduction
- 3.2. Market Drivers
- 3.2.1. Increasing Demand for Antibodies; Increasing Number of Drug Discoveries and R&D Activities
- 3.3. Market Restrains
- 3.3.1. High Cost Associated With Protein A Resin
- 3.4. Market Trends
- 3.4.1. Pharmaceutical and Biopharmaceutical Companies are Expected to Dominate the End User Segment
- 4. Market Factor Analysis
- 4.1. Porters Five Forces
- 4.2. Supply/Value Chain
- 4.3. PESTEL analysis
- 4.4. Market Entropy
- 4.5. Patent/Trademark Analysis
- 5. Global Protein A Resins Industry Analysis, Insights and Forecast, 2019-2031
- 5.1. Market Analysis, Insights and Forecast - by Product
- 5.1.1. Agarose -based Protein
- 5.1.2. Glass or Silica-based Protein
- 5.1.3. Organic Polymer-based Protein
- 5.2. Market Analysis, Insights and Forecast - by Application
- 5.2.1. Antibody Purification
- 5.2.2. Immunoprecipitation
- 5.3. Market Analysis, Insights and Forecast - by End User
- 5.3.1. Pharmaceutical and Biopharmaceutical Companies
- 5.3.2. Research Laboratories
- 5.3.3. Other End Users
- 5.4. Market Analysis, Insights and Forecast - by Region
- 5.4.1. North America
- 5.4.2. Europe
- 5.4.3. Asia Pacific
- 5.4.4. Middle East and Africa
- 5.4.5. South America
- 5.1. Market Analysis, Insights and Forecast - by Product
- 6. North America Protein A Resins Industry Analysis, Insights and Forecast, 2019-2031
- 6.1. Market Analysis, Insights and Forecast - by Product
- 6.1.1. Agarose -based Protein
- 6.1.2. Glass or Silica-based Protein
- 6.1.3. Organic Polymer-based Protein
- 6.2. Market Analysis, Insights and Forecast - by Application
- 6.2.1. Antibody Purification
- 6.2.2. Immunoprecipitation
- 6.3. Market Analysis, Insights and Forecast - by End User
- 6.3.1. Pharmaceutical and Biopharmaceutical Companies
- 6.3.2. Research Laboratories
- 6.3.3. Other End Users
- 6.1. Market Analysis, Insights and Forecast - by Product
- 7. Europe Protein A Resins Industry Analysis, Insights and Forecast, 2019-2031
- 7.1. Market Analysis, Insights and Forecast - by Product
- 7.1.1. Agarose -based Protein
- 7.1.2. Glass or Silica-based Protein
- 7.1.3. Organic Polymer-based Protein
- 7.2. Market Analysis, Insights and Forecast - by Application
- 7.2.1. Antibody Purification
- 7.2.2. Immunoprecipitation
- 7.3. Market Analysis, Insights and Forecast - by End User
- 7.3.1. Pharmaceutical and Biopharmaceutical Companies
- 7.3.2. Research Laboratories
- 7.3.3. Other End Users
- 7.1. Market Analysis, Insights and Forecast - by Product
- 8. Asia Pacific Protein A Resins Industry Analysis, Insights and Forecast, 2019-2031
- 8.1. Market Analysis, Insights and Forecast - by Product
- 8.1.1. Agarose -based Protein
- 8.1.2. Glass or Silica-based Protein
- 8.1.3. Organic Polymer-based Protein
- 8.2. Market Analysis, Insights and Forecast - by Application
- 8.2.1. Antibody Purification
- 8.2.2. Immunoprecipitation
- 8.3. Market Analysis, Insights and Forecast - by End User
- 8.3.1. Pharmaceutical and Biopharmaceutical Companies
- 8.3.2. Research Laboratories
- 8.3.3. Other End Users
- 8.1. Market Analysis, Insights and Forecast - by Product
- 9. Middle East and Africa Protein A Resins Industry Analysis, Insights and Forecast, 2019-2031
- 9.1. Market Analysis, Insights and Forecast - by Product
- 9.1.1. Agarose -based Protein
- 9.1.2. Glass or Silica-based Protein
- 9.1.3. Organic Polymer-based Protein
- 9.2. Market Analysis, Insights and Forecast - by Application
- 9.2.1. Antibody Purification
- 9.2.2. Immunoprecipitation
- 9.3. Market Analysis, Insights and Forecast - by End User
- 9.3.1. Pharmaceutical and Biopharmaceutical Companies
- 9.3.2. Research Laboratories
- 9.3.3. Other End Users
- 9.1. Market Analysis, Insights and Forecast - by Product
- 10. South America Protein A Resins Industry Analysis, Insights and Forecast, 2019-2031
- 10.1. Market Analysis, Insights and Forecast - by Product
- 10.1.1. Agarose -based Protein
- 10.1.2. Glass or Silica-based Protein
- 10.1.3. Organic Polymer-based Protein
- 10.2. Market Analysis, Insights and Forecast - by Application
- 10.2.1. Antibody Purification
- 10.2.2. Immunoprecipitation
- 10.3. Market Analysis, Insights and Forecast - by End User
- 10.3.1. Pharmaceutical and Biopharmaceutical Companies
- 10.3.2. Research Laboratories
- 10.3.3. Other End Users
- 10.1. Market Analysis, Insights and Forecast - by Product
- 11. North America Protein A Resins Industry Analysis, Insights and Forecast, 2019-2031
- 11.1. Market Analysis, Insights and Forecast - By Country/Sub-region
- 11.1.1 United States
- 11.1.2 Canada
- 11.1.3 Mexico
- 12. Europe Protein A Resins Industry Analysis, Insights and Forecast, 2019-2031
- 12.1. Market Analysis, Insights and Forecast - By Country/Sub-region
- 12.1.1 Germany
- 12.1.2 United Kingdom
- 12.1.3 France
- 12.1.4 Italy
- 12.1.5 Spain
- 12.1.6 Rest of Europe
- 13. Asia Pacific Protein A Resins Industry Analysis, Insights and Forecast, 2019-2031
- 13.1. Market Analysis, Insights and Forecast - By Country/Sub-region
- 13.1.1 China
- 13.1.2 Japan
- 13.1.3 India
- 13.1.4 Australia
- 13.1.5 South Korea
- 13.1.6 Rest of Asia Pacific
- 14. Middle East and Africa Protein A Resins Industry Analysis, Insights and Forecast, 2019-2031
- 14.1. Market Analysis, Insights and Forecast - By Country/Sub-region
- 14.1.1 GCC
- 14.1.2 South Africa
- 14.1.3 Rest of Middle East and Africa
- 15. South America Protein A Resins Industry Analysis, Insights and Forecast, 2019-2031
- 15.1. Market Analysis, Insights and Forecast - By Country/Sub-region
- 15.1.1 Brazil
- 15.1.2 Argentina
- 15.1.3 Rest of South America
- 16. Competitive Analysis
- 16.1. Global Market Share Analysis 2024
- 16.2. Company Profiles
- 16.2.1 Abcam Limited
- 16.2.1.1. Overview
- 16.2.1.2. Products
- 16.2.1.3. SWOT Analysis
- 16.2.1.4. Recent Developments
- 16.2.1.5. Financials (Based on Availability)
- 16.2.2 Repligen Corporation
- 16.2.2.1. Overview
- 16.2.2.2. Products
- 16.2.2.3. SWOT Analysis
- 16.2.2.4. Recent Developments
- 16.2.2.5. Financials (Based on Availability)
- 16.2.3 Bio-Rad Laboratories Inc
- 16.2.3.1. Overview
- 16.2.3.2. Products
- 16.2.3.3. SWOT Analysis
- 16.2.3.4. Recent Developments
- 16.2.3.5. Financials (Based on Availability)
- 16.2.4 Merck KGaA
- 16.2.4.1. Overview
- 16.2.4.2. Products
- 16.2.4.3. SWOT Analysis
- 16.2.4.4. Recent Developments
- 16.2.4.5. Financials (Based on Availability)
- 16.2.5 JSR Life Sciences
- 16.2.5.1. Overview
- 16.2.5.2. Products
- 16.2.5.3. SWOT Analysis
- 16.2.5.4. Recent Developments
- 16.2.5.5. Financials (Based on Availability)
- 16.2.6 Kaneka Corporation
- 16.2.6.1. Overview
- 16.2.6.2. Products
- 16.2.6.3. SWOT Analysis
- 16.2.6.4. Recent Developments
- 16.2.6.5. Financials (Based on Availability)
- 16.2.7 Genscript Corporation
- 16.2.7.1. Overview
- 16.2.7.2. Products
- 16.2.7.3. SWOT Analysis
- 16.2.7.4. Recent Developments
- 16.2.7.5. Financials (Based on Availability)
- 16.2.8 Tosoh Bioscience LLC
- 16.2.8.1. Overview
- 16.2.8.2. Products
- 16.2.8.3. SWOT Analysis
- 16.2.8.4. Recent Developments
- 16.2.8.5. Financials (Based on Availability)
- 16.2.9 Danaher Corporation (Cytiva)
- 16.2.9.1. Overview
- 16.2.9.2. Products
- 16.2.9.3. SWOT Analysis
- 16.2.9.4. Recent Developments
- 16.2.9.5. Financials (Based on Availability)
- 16.2.10 Axplora
- 16.2.10.1. Overview
- 16.2.10.2. Products
- 16.2.10.3. SWOT Analysis
- 16.2.10.4. Recent Developments
- 16.2.10.5. Financials (Based on Availability)
- 16.2.11 Thermofisher Scientific Inc
- 16.2.11.1. Overview
- 16.2.11.2. Products
- 16.2.11.3. SWOT Analysis
- 16.2.11.4. Recent Developments
- 16.2.11.5. Financials (Based on Availability)
- 16.2.12 Agarose Beads Technologies
- 16.2.12.1. Overview
- 16.2.12.2. Products
- 16.2.12.3. SWOT Analysis
- 16.2.12.4. Recent Developments
- 16.2.12.5. Financials (Based on Availability)
- 16.2.13 Ecolab Inc (Purolite Lifesciences)
- 16.2.13.1. Overview
- 16.2.13.2. Products
- 16.2.13.3. SWOT Analysis
- 16.2.13.4. Recent Developments
- 16.2.13.5. Financials (Based on Availability)
- 16.2.1 Abcam Limited
List of Figures
- Figure 1: Global Protein A Resins Industry Revenue Breakdown (Million, %) by Region 2024 & 2032
- Figure 2: Global Protein A Resins Industry Volume Breakdown (K Unit, %) by Region 2024 & 2032
- Figure 3: North America Protein A Resins Industry Revenue (Million), by Country 2024 & 2032
- Figure 4: North America Protein A Resins Industry Volume (K Unit), by Country 2024 & 2032
- Figure 5: North America Protein A Resins Industry Revenue Share (%), by Country 2024 & 2032
- Figure 6: North America Protein A Resins Industry Volume Share (%), by Country 2024 & 2032
- Figure 7: Europe Protein A Resins Industry Revenue (Million), by Country 2024 & 2032
- Figure 8: Europe Protein A Resins Industry Volume (K Unit), by Country 2024 & 2032
- Figure 9: Europe Protein A Resins Industry Revenue Share (%), by Country 2024 & 2032
- Figure 10: Europe Protein A Resins Industry Volume Share (%), by Country 2024 & 2032
- Figure 11: Asia Pacific Protein A Resins Industry Revenue (Million), by Country 2024 & 2032
- Figure 12: Asia Pacific Protein A Resins Industry Volume (K Unit), by Country 2024 & 2032
- Figure 13: Asia Pacific Protein A Resins Industry Revenue Share (%), by Country 2024 & 2032
- Figure 14: Asia Pacific Protein A Resins Industry Volume Share (%), by Country 2024 & 2032
- Figure 15: Middle East and Africa Protein A Resins Industry Revenue (Million), by Country 2024 & 2032
- Figure 16: Middle East and Africa Protein A Resins Industry Volume (K Unit), by Country 2024 & 2032
- Figure 17: Middle East and Africa Protein A Resins Industry Revenue Share (%), by Country 2024 & 2032
- Figure 18: Middle East and Africa Protein A Resins Industry Volume Share (%), by Country 2024 & 2032
- Figure 19: South America Protein A Resins Industry Revenue (Million), by Country 2024 & 2032
- Figure 20: South America Protein A Resins Industry Volume (K Unit), by Country 2024 & 2032
- Figure 21: South America Protein A Resins Industry Revenue Share (%), by Country 2024 & 2032
- Figure 22: South America Protein A Resins Industry Volume Share (%), by Country 2024 & 2032
- Figure 23: North America Protein A Resins Industry Revenue (Million), by Product 2024 & 2032
- Figure 24: North America Protein A Resins Industry Volume (K Unit), by Product 2024 & 2032
- Figure 25: North America Protein A Resins Industry Revenue Share (%), by Product 2024 & 2032
- Figure 26: North America Protein A Resins Industry Volume Share (%), by Product 2024 & 2032
- Figure 27: North America Protein A Resins Industry Revenue (Million), by Application 2024 & 2032
- Figure 28: North America Protein A Resins Industry Volume (K Unit), by Application 2024 & 2032
- Figure 29: North America Protein A Resins Industry Revenue Share (%), by Application 2024 & 2032
- Figure 30: North America Protein A Resins Industry Volume Share (%), by Application 2024 & 2032
- Figure 31: North America Protein A Resins Industry Revenue (Million), by End User 2024 & 2032
- Figure 32: North America Protein A Resins Industry Volume (K Unit), by End User 2024 & 2032
- Figure 33: North America Protein A Resins Industry Revenue Share (%), by End User 2024 & 2032
- Figure 34: North America Protein A Resins Industry Volume Share (%), by End User 2024 & 2032
- Figure 35: North America Protein A Resins Industry Revenue (Million), by Country 2024 & 2032
- Figure 36: North America Protein A Resins Industry Volume (K Unit), by Country 2024 & 2032
- Figure 37: North America Protein A Resins Industry Revenue Share (%), by Country 2024 & 2032
- Figure 38: North America Protein A Resins Industry Volume Share (%), by Country 2024 & 2032
- Figure 39: Europe Protein A Resins Industry Revenue (Million), by Product 2024 & 2032
- Figure 40: Europe Protein A Resins Industry Volume (K Unit), by Product 2024 & 2032
- Figure 41: Europe Protein A Resins Industry Revenue Share (%), by Product 2024 & 2032
- Figure 42: Europe Protein A Resins Industry Volume Share (%), by Product 2024 & 2032
- Figure 43: Europe Protein A Resins Industry Revenue (Million), by Application 2024 & 2032
- Figure 44: Europe Protein A Resins Industry Volume (K Unit), by Application 2024 & 2032
- Figure 45: Europe Protein A Resins Industry Revenue Share (%), by Application 2024 & 2032
- Figure 46: Europe Protein A Resins Industry Volume Share (%), by Application 2024 & 2032
- Figure 47: Europe Protein A Resins Industry Revenue (Million), by End User 2024 & 2032
- Figure 48: Europe Protein A Resins Industry Volume (K Unit), by End User 2024 & 2032
- Figure 49: Europe Protein A Resins Industry Revenue Share (%), by End User 2024 & 2032
- Figure 50: Europe Protein A Resins Industry Volume Share (%), by End User 2024 & 2032
- Figure 51: Europe Protein A Resins Industry Revenue (Million), by Country 2024 & 2032
- Figure 52: Europe Protein A Resins Industry Volume (K Unit), by Country 2024 & 2032
- Figure 53: Europe Protein A Resins Industry Revenue Share (%), by Country 2024 & 2032
- Figure 54: Europe Protein A Resins Industry Volume Share (%), by Country 2024 & 2032
- Figure 55: Asia Pacific Protein A Resins Industry Revenue (Million), by Product 2024 & 2032
- Figure 56: Asia Pacific Protein A Resins Industry Volume (K Unit), by Product 2024 & 2032
- Figure 57: Asia Pacific Protein A Resins Industry Revenue Share (%), by Product 2024 & 2032
- Figure 58: Asia Pacific Protein A Resins Industry Volume Share (%), by Product 2024 & 2032
- Figure 59: Asia Pacific Protein A Resins Industry Revenue (Million), by Application 2024 & 2032
- Figure 60: Asia Pacific Protein A Resins Industry Volume (K Unit), by Application 2024 & 2032
- Figure 61: Asia Pacific Protein A Resins Industry Revenue Share (%), by Application 2024 & 2032
- Figure 62: Asia Pacific Protein A Resins Industry Volume Share (%), by Application 2024 & 2032
- Figure 63: Asia Pacific Protein A Resins Industry Revenue (Million), by End User 2024 & 2032
- Figure 64: Asia Pacific Protein A Resins Industry Volume (K Unit), by End User 2024 & 2032
- Figure 65: Asia Pacific Protein A Resins Industry Revenue Share (%), by End User 2024 & 2032
- Figure 66: Asia Pacific Protein A Resins Industry Volume Share (%), by End User 2024 & 2032
- Figure 67: Asia Pacific Protein A Resins Industry Revenue (Million), by Country 2024 & 2032
- Figure 68: Asia Pacific Protein A Resins Industry Volume (K Unit), by Country 2024 & 2032
- Figure 69: Asia Pacific Protein A Resins Industry Revenue Share (%), by Country 2024 & 2032
- Figure 70: Asia Pacific Protein A Resins Industry Volume Share (%), by Country 2024 & 2032
- Figure 71: Middle East and Africa Protein A Resins Industry Revenue (Million), by Product 2024 & 2032
- Figure 72: Middle East and Africa Protein A Resins Industry Volume (K Unit), by Product 2024 & 2032
- Figure 73: Middle East and Africa Protein A Resins Industry Revenue Share (%), by Product 2024 & 2032
- Figure 74: Middle East and Africa Protein A Resins Industry Volume Share (%), by Product 2024 & 2032
- Figure 75: Middle East and Africa Protein A Resins Industry Revenue (Million), by Application 2024 & 2032
- Figure 76: Middle East and Africa Protein A Resins Industry Volume (K Unit), by Application 2024 & 2032
- Figure 77: Middle East and Africa Protein A Resins Industry Revenue Share (%), by Application 2024 & 2032
- Figure 78: Middle East and Africa Protein A Resins Industry Volume Share (%), by Application 2024 & 2032
- Figure 79: Middle East and Africa Protein A Resins Industry Revenue (Million), by End User 2024 & 2032
- Figure 80: Middle East and Africa Protein A Resins Industry Volume (K Unit), by End User 2024 & 2032
- Figure 81: Middle East and Africa Protein A Resins Industry Revenue Share (%), by End User 2024 & 2032
- Figure 82: Middle East and Africa Protein A Resins Industry Volume Share (%), by End User 2024 & 2032
- Figure 83: Middle East and Africa Protein A Resins Industry Revenue (Million), by Country 2024 & 2032
- Figure 84: Middle East and Africa Protein A Resins Industry Volume (K Unit), by Country 2024 & 2032
- Figure 85: Middle East and Africa Protein A Resins Industry Revenue Share (%), by Country 2024 & 2032
- Figure 86: Middle East and Africa Protein A Resins Industry Volume Share (%), by Country 2024 & 2032
- Figure 87: South America Protein A Resins Industry Revenue (Million), by Product 2024 & 2032
- Figure 88: South America Protein A Resins Industry Volume (K Unit), by Product 2024 & 2032
- Figure 89: South America Protein A Resins Industry Revenue Share (%), by Product 2024 & 2032
- Figure 90: South America Protein A Resins Industry Volume Share (%), by Product 2024 & 2032
- Figure 91: South America Protein A Resins Industry Revenue (Million), by Application 2024 & 2032
- Figure 92: South America Protein A Resins Industry Volume (K Unit), by Application 2024 & 2032
- Figure 93: South America Protein A Resins Industry Revenue Share (%), by Application 2024 & 2032
- Figure 94: South America Protein A Resins Industry Volume Share (%), by Application 2024 & 2032
- Figure 95: South America Protein A Resins Industry Revenue (Million), by End User 2024 & 2032
- Figure 96: South America Protein A Resins Industry Volume (K Unit), by End User 2024 & 2032
- Figure 97: South America Protein A Resins Industry Revenue Share (%), by End User 2024 & 2032
- Figure 98: South America Protein A Resins Industry Volume Share (%), by End User 2024 & 2032
- Figure 99: South America Protein A Resins Industry Revenue (Million), by Country 2024 & 2032
- Figure 100: South America Protein A Resins Industry Volume (K Unit), by Country 2024 & 2032
- Figure 101: South America Protein A Resins Industry Revenue Share (%), by Country 2024 & 2032
- Figure 102: South America Protein A Resins Industry Volume Share (%), by Country 2024 & 2032
List of Tables
- Table 1: Global Protein A Resins Industry Revenue Million Forecast, by Region 2019 & 2032
- Table 2: Global Protein A Resins Industry Volume K Unit Forecast, by Region 2019 & 2032
- Table 3: Global Protein A Resins Industry Revenue Million Forecast, by Product 2019 & 2032
- Table 4: Global Protein A Resins Industry Volume K Unit Forecast, by Product 2019 & 2032
- Table 5: Global Protein A Resins Industry Revenue Million Forecast, by Application 2019 & 2032
- Table 6: Global Protein A Resins Industry Volume K Unit Forecast, by Application 2019 & 2032
- Table 7: Global Protein A Resins Industry Revenue Million Forecast, by End User 2019 & 2032
- Table 8: Global Protein A Resins Industry Volume K Unit Forecast, by End User 2019 & 2032
- Table 9: Global Protein A Resins Industry Revenue Million Forecast, by Region 2019 & 2032
- Table 10: Global Protein A Resins Industry Volume K Unit Forecast, by Region 2019 & 2032
- Table 11: Global Protein A Resins Industry Revenue Million Forecast, by Country 2019 & 2032
- Table 12: Global Protein A Resins Industry Volume K Unit Forecast, by Country 2019 & 2032
- Table 13: United States Protein A Resins Industry Revenue (Million) Forecast, by Application 2019 & 2032
- Table 14: United States Protein A Resins Industry Volume (K Unit) Forecast, by Application 2019 & 2032
- Table 15: Canada Protein A Resins Industry Revenue (Million) Forecast, by Application 2019 & 2032
- Table 16: Canada Protein A Resins Industry Volume (K Unit) Forecast, by Application 2019 & 2032
- Table 17: Mexico Protein A Resins Industry Revenue (Million) Forecast, by Application 2019 & 2032
- Table 18: Mexico Protein A Resins Industry Volume (K Unit) Forecast, by Application 2019 & 2032
- Table 19: Global Protein A Resins Industry Revenue Million Forecast, by Country 2019 & 2032
- Table 20: Global Protein A Resins Industry Volume K Unit Forecast, by Country 2019 & 2032
- Table 21: Germany Protein A Resins Industry Revenue (Million) Forecast, by Application 2019 & 2032
- Table 22: Germany Protein A Resins Industry Volume (K Unit) Forecast, by Application 2019 & 2032
- Table 23: United Kingdom Protein A Resins Industry Revenue (Million) Forecast, by Application 2019 & 2032
- Table 24: United Kingdom Protein A Resins Industry Volume (K Unit) Forecast, by Application 2019 & 2032
- Table 25: France Protein A Resins Industry Revenue (Million) Forecast, by Application 2019 & 2032
- Table 26: France Protein A Resins Industry Volume (K Unit) Forecast, by Application 2019 & 2032
- Table 27: Italy Protein A Resins Industry Revenue (Million) Forecast, by Application 2019 & 2032
- Table 28: Italy Protein A Resins Industry Volume (K Unit) Forecast, by Application 2019 & 2032
- Table 29: Spain Protein A Resins Industry Revenue (Million) Forecast, by Application 2019 & 2032
- Table 30: Spain Protein A Resins Industry Volume (K Unit) Forecast, by Application 2019 & 2032
- Table 31: Rest of Europe Protein A Resins Industry Revenue (Million) Forecast, by Application 2019 & 2032
- Table 32: Rest of Europe Protein A Resins Industry Volume (K Unit) Forecast, by Application 2019 & 2032
- Table 33: Global Protein A Resins Industry Revenue Million Forecast, by Country 2019 & 2032
- Table 34: Global Protein A Resins Industry Volume K Unit Forecast, by Country 2019 & 2032
- Table 35: China Protein A Resins Industry Revenue (Million) Forecast, by Application 2019 & 2032
- Table 36: China Protein A Resins Industry Volume (K Unit) Forecast, by Application 2019 & 2032
- Table 37: Japan Protein A Resins Industry Revenue (Million) Forecast, by Application 2019 & 2032
- Table 38: Japan Protein A Resins Industry Volume (K Unit) Forecast, by Application 2019 & 2032
- Table 39: India Protein A Resins Industry Revenue (Million) Forecast, by Application 2019 & 2032
- Table 40: India Protein A Resins Industry Volume (K Unit) Forecast, by Application 2019 & 2032
- Table 41: Australia Protein A Resins Industry Revenue (Million) Forecast, by Application 2019 & 2032
- Table 42: Australia Protein A Resins Industry Volume (K Unit) Forecast, by Application 2019 & 2032
- Table 43: South Korea Protein A Resins Industry Revenue (Million) Forecast, by Application 2019 & 2032
- Table 44: South Korea Protein A Resins Industry Volume (K Unit) Forecast, by Application 2019 & 2032
- Table 45: Rest of Asia Pacific Protein A Resins Industry Revenue (Million) Forecast, by Application 2019 & 2032
- Table 46: Rest of Asia Pacific Protein A Resins Industry Volume (K Unit) Forecast, by Application 2019 & 2032
- Table 47: Global Protein A Resins Industry Revenue Million Forecast, by Country 2019 & 2032
- Table 48: Global Protein A Resins Industry Volume K Unit Forecast, by Country 2019 & 2032
- Table 49: GCC Protein A Resins Industry Revenue (Million) Forecast, by Application 2019 & 2032
- Table 50: GCC Protein A Resins Industry Volume (K Unit) Forecast, by Application 2019 & 2032
- Table 51: South Africa Protein A Resins Industry Revenue (Million) Forecast, by Application 2019 & 2032
- Table 52: South Africa Protein A Resins Industry Volume (K Unit) Forecast, by Application 2019 & 2032
- Table 53: Rest of Middle East and Africa Protein A Resins Industry Revenue (Million) Forecast, by Application 2019 & 2032
- Table 54: Rest of Middle East and Africa Protein A Resins Industry Volume (K Unit) Forecast, by Application 2019 & 2032
- Table 55: Global Protein A Resins Industry Revenue Million Forecast, by Country 2019 & 2032
- Table 56: Global Protein A Resins Industry Volume K Unit Forecast, by Country 2019 & 2032
- Table 57: Brazil Protein A Resins Industry Revenue (Million) Forecast, by Application 2019 & 2032
- Table 58: Brazil Protein A Resins Industry Volume (K Unit) Forecast, by Application 2019 & 2032
- Table 59: Argentina Protein A Resins Industry Revenue (Million) Forecast, by Application 2019 & 2032
- Table 60: Argentina Protein A Resins Industry Volume (K Unit) Forecast, by Application 2019 & 2032
- Table 61: Rest of South America Protein A Resins Industry Revenue (Million) Forecast, by Application 2019 & 2032
- Table 62: Rest of South America Protein A Resins Industry Volume (K Unit) Forecast, by Application 2019 & 2032
- Table 63: Global Protein A Resins Industry Revenue Million Forecast, by Product 2019 & 2032
- Table 64: Global Protein A Resins Industry Volume K Unit Forecast, by Product 2019 & 2032
- Table 65: Global Protein A Resins Industry Revenue Million Forecast, by Application 2019 & 2032
- Table 66: Global Protein A Resins Industry Volume K Unit Forecast, by Application 2019 & 2032
- Table 67: Global Protein A Resins Industry Revenue Million Forecast, by End User 2019 & 2032
- Table 68: Global Protein A Resins Industry Volume K Unit Forecast, by End User 2019 & 2032
- Table 69: Global Protein A Resins Industry Revenue Million Forecast, by Country 2019 & 2032
- Table 70: Global Protein A Resins Industry Volume K Unit Forecast, by Country 2019 & 2032
- Table 71: United States Protein A Resins Industry Revenue (Million) Forecast, by Application 2019 & 2032
- Table 72: United States Protein A Resins Industry Volume (K Unit) Forecast, by Application 2019 & 2032
- Table 73: Canada Protein A Resins Industry Revenue (Million) Forecast, by Application 2019 & 2032
- Table 74: Canada Protein A Resins Industry Volume (K Unit) Forecast, by Application 2019 & 2032
- Table 75: Mexico Protein A Resins Industry Revenue (Million) Forecast, by Application 2019 & 2032
- Table 76: Mexico Protein A Resins Industry Volume (K Unit) Forecast, by Application 2019 & 2032
- Table 77: Global Protein A Resins Industry Revenue Million Forecast, by Product 2019 & 2032
- Table 78: Global Protein A Resins Industry Volume K Unit Forecast, by Product 2019 & 2032
- Table 79: Global Protein A Resins Industry Revenue Million Forecast, by Application 2019 & 2032
- Table 80: Global Protein A Resins Industry Volume K Unit Forecast, by Application 2019 & 2032
- Table 81: Global Protein A Resins Industry Revenue Million Forecast, by End User 2019 & 2032
- Table 82: Global Protein A Resins Industry Volume K Unit Forecast, by End User 2019 & 2032
- Table 83: Global Protein A Resins Industry Revenue Million Forecast, by Country 2019 & 2032
- Table 84: Global Protein A Resins Industry Volume K Unit Forecast, by Country 2019 & 2032
- Table 85: Germany Protein A Resins Industry Revenue (Million) Forecast, by Application 2019 & 2032
- Table 86: Germany Protein A Resins Industry Volume (K Unit) Forecast, by Application 2019 & 2032
- Table 87: United Kingdom Protein A Resins Industry Revenue (Million) Forecast, by Application 2019 & 2032
- Table 88: United Kingdom Protein A Resins Industry Volume (K Unit) Forecast, by Application 2019 & 2032
- Table 89: France Protein A Resins Industry Revenue (Million) Forecast, by Application 2019 & 2032
- Table 90: France Protein A Resins Industry Volume (K Unit) Forecast, by Application 2019 & 2032
- Table 91: Italy Protein A Resins Industry Revenue (Million) Forecast, by Application 2019 & 2032
- Table 92: Italy Protein A Resins Industry Volume (K Unit) Forecast, by Application 2019 & 2032
- Table 93: Spain Protein A Resins Industry Revenue (Million) Forecast, by Application 2019 & 2032
- Table 94: Spain Protein A Resins Industry Volume (K Unit) Forecast, by Application 2019 & 2032
- Table 95: Rest of Europe Protein A Resins Industry Revenue (Million) Forecast, by Application 2019 & 2032
- Table 96: Rest of Europe Protein A Resins Industry Volume (K Unit) Forecast, by Application 2019 & 2032
- Table 97: Global Protein A Resins Industry Revenue Million Forecast, by Product 2019 & 2032
- Table 98: Global Protein A Resins Industry Volume K Unit Forecast, by Product 2019 & 2032
- Table 99: Global Protein A Resins Industry Revenue Million Forecast, by Application 2019 & 2032
- Table 100: Global Protein A Resins Industry Volume K Unit Forecast, by Application 2019 & 2032
- Table 101: Global Protein A Resins Industry Revenue Million Forecast, by End User 2019 & 2032
- Table 102: Global Protein A Resins Industry Volume K Unit Forecast, by End User 2019 & 2032
- Table 103: Global Protein A Resins Industry Revenue Million Forecast, by Country 2019 & 2032
- Table 104: Global Protein A Resins Industry Volume K Unit Forecast, by Country 2019 & 2032
- Table 105: China Protein A Resins Industry Revenue (Million) Forecast, by Application 2019 & 2032
- Table 106: China Protein A Resins Industry Volume (K Unit) Forecast, by Application 2019 & 2032
- Table 107: Japan Protein A Resins Industry Revenue (Million) Forecast, by Application 2019 & 2032
- Table 108: Japan Protein A Resins Industry Volume (K Unit) Forecast, by Application 2019 & 2032
- Table 109: India Protein A Resins Industry Revenue (Million) Forecast, by Application 2019 & 2032
- Table 110: India Protein A Resins Industry Volume (K Unit) Forecast, by Application 2019 & 2032
- Table 111: Australia Protein A Resins Industry Revenue (Million) Forecast, by Application 2019 & 2032
- Table 112: Australia Protein A Resins Industry Volume (K Unit) Forecast, by Application 2019 & 2032
- Table 113: South Korea Protein A Resins Industry Revenue (Million) Forecast, by Application 2019 & 2032
- Table 114: South Korea Protein A Resins Industry Volume (K Unit) Forecast, by Application 2019 & 2032
- Table 115: Rest of Asia Pacific Protein A Resins Industry Revenue (Million) Forecast, by Application 2019 & 2032
- Table 116: Rest of Asia Pacific Protein A Resins Industry Volume (K Unit) Forecast, by Application 2019 & 2032
- Table 117: Global Protein A Resins Industry Revenue Million Forecast, by Product 2019 & 2032
- Table 118: Global Protein A Resins Industry Volume K Unit Forecast, by Product 2019 & 2032
- Table 119: Global Protein A Resins Industry Revenue Million Forecast, by Application 2019 & 2032
- Table 120: Global Protein A Resins Industry Volume K Unit Forecast, by Application 2019 & 2032
- Table 121: Global Protein A Resins Industry Revenue Million Forecast, by End User 2019 & 2032
- Table 122: Global Protein A Resins Industry Volume K Unit Forecast, by End User 2019 & 2032
- Table 123: Global Protein A Resins Industry Revenue Million Forecast, by Country 2019 & 2032
- Table 124: Global Protein A Resins Industry Volume K Unit Forecast, by Country 2019 & 2032
- Table 125: GCC Protein A Resins Industry Revenue (Million) Forecast, by Application 2019 & 2032
- Table 126: GCC Protein A Resins Industry Volume (K Unit) Forecast, by Application 2019 & 2032
- Table 127: South Africa Protein A Resins Industry Revenue (Million) Forecast, by Application 2019 & 2032
- Table 128: South Africa Protein A Resins Industry Volume (K Unit) Forecast, by Application 2019 & 2032
- Table 129: Rest of Middle East and Africa Protein A Resins Industry Revenue (Million) Forecast, by Application 2019 & 2032
- Table 130: Rest of Middle East and Africa Protein A Resins Industry Volume (K Unit) Forecast, by Application 2019 & 2032
- Table 131: Global Protein A Resins Industry Revenue Million Forecast, by Product 2019 & 2032
- Table 132: Global Protein A Resins Industry Volume K Unit Forecast, by Product 2019 & 2032
- Table 133: Global Protein A Resins Industry Revenue Million Forecast, by Application 2019 & 2032
- Table 134: Global Protein A Resins Industry Volume K Unit Forecast, by Application 2019 & 2032
- Table 135: Global Protein A Resins Industry Revenue Million Forecast, by End User 2019 & 2032
- Table 136: Global Protein A Resins Industry Volume K Unit Forecast, by End User 2019 & 2032
- Table 137: Global Protein A Resins Industry Revenue Million Forecast, by Country 2019 & 2032
- Table 138: Global Protein A Resins Industry Volume K Unit Forecast, by Country 2019 & 2032
- Table 139: Brazil Protein A Resins Industry Revenue (Million) Forecast, by Application 2019 & 2032
- Table 140: Brazil Protein A Resins Industry Volume (K Unit) Forecast, by Application 2019 & 2032
- Table 141: Argentina Protein A Resins Industry Revenue (Million) Forecast, by Application 2019 & 2032
- Table 142: Argentina Protein A Resins Industry Volume (K Unit) Forecast, by Application 2019 & 2032
- Table 143: Rest of South America Protein A Resins Industry Revenue (Million) Forecast, by Application 2019 & 2032
- Table 144: Rest of South America Protein A Resins Industry Volume (K Unit) Forecast, by Application 2019 & 2032
Frequently Asked Questions
1. What is the projected Compound Annual Growth Rate (CAGR) of the Protein A Resins Industry?
The projected CAGR is approximately 8.69%.
2. Which companies are prominent players in the Protein A Resins Industry?
Key companies in the market include Abcam Limited, Repligen Corporation, Bio-Rad Laboratories Inc, Merck KGaA, JSR Life Sciences, Kaneka Corporation, Genscript Corporation, Tosoh Bioscience LLC, Danaher Corporation (Cytiva), Axplora, Thermofisher Scientific Inc, Agarose Beads Technologies, Ecolab Inc (Purolite Lifesciences).
3. What are the main segments of the Protein A Resins Industry?
The market segments include Product, Application, End User.
4. Can you provide details about the market size?
The market size is estimated to be USD 1.17 Million as of 2022.
5. What are some drivers contributing to market growth?
Increasing Demand for Antibodies; Increasing Number of Drug Discoveries and R&D Activities.
6. What are the notable trends driving market growth?
Pharmaceutical and Biopharmaceutical Companies are Expected to Dominate the End User Segment.
7. Are there any restraints impacting market growth?
High Cost Associated With Protein A Resin.
8. Can you provide examples of recent developments in the market?
February 2024: Purolite, an Ecolab company, and Repligen Corporation reported the commercial launch of Praesto CH1, a new 70 μm (micron) agarose-based affinity resin designed to purify specialized mAbs such as bispecifics and recombinant antibody fragments.
9. What pricing options are available for accessing the report?
Pricing options include single-user, multi-user, and enterprise licenses priced at USD 4750, USD 5250, and USD 8750 respectively.
10. Is the market size provided in terms of value or volume?
The market size is provided in terms of value, measured in Million and volume, measured in K Unit.
11. Are there any specific market keywords associated with the report?
Yes, the market keyword associated with the report is "Protein A Resins Industry," which aids in identifying and referencing the specific market segment covered.
12. How do I determine which pricing option suits my needs best?
The pricing options vary based on user requirements and access needs. Individual users may opt for single-user licenses, while businesses requiring broader access may choose multi-user or enterprise licenses for cost-effective access to the report.
13. Are there any additional resources or data provided in the Protein A Resins Industry report?
While the report offers comprehensive insights, it's advisable to review the specific contents or supplementary materials provided to ascertain if additional resources or data are available.
14. How can I stay updated on further developments or reports in the Protein A Resins Industry?
To stay informed about further developments, trends, and reports in the Protein A Resins Industry, consider subscribing to industry newsletters, following relevant companies and organizations, or regularly checking reputable industry news sources and publications.
Methodology
Step 1 - Identification of Relevant Samples Size from Population Database


Step 2 - Approaches for Defining Global Market Size (Value, Volume* & Price*)

Note*: In applicable scenarios
Step 3 - Data Sources
Primary Research
- Web Analytics
- Survey Reports
- Research Institute
- Latest Research Reports
- Opinion Leaders
Secondary Research
- Annual Reports
- White Paper
- Latest Press Release
- Industry Association
- Paid Database
- Investor Presentations

Step 4 - Data Triangulation
Involves using different sources of information in order to increase the validity of a study
These sources are likely to be stakeholders in a program - participants, other researchers, program staff, other community members, and so on.
Then we put all data in single framework & apply various statistical tools to find out the dynamic on the market.
During the analysis stage, feedback from the stakeholder groups would be compared to determine areas of agreement as well as areas of divergence


