

Key Insights
The global protective packaging market, valued at 33.92 billion in 2025, is projected for significant expansion with a Compound Annual Growth Rate (CAGR) of 4.6% from 2025 to 2033. E-commerce growth is a primary driver, demanding secure transit packaging. Increasing consumer awareness regarding product safety and sustainability is fostering demand for eco-friendly solutions like biodegradable and recyclable materials. Key sectors such as food & beverage, pharmaceuticals, and consumer electronics contribute to this growth by requiring protective packaging for product integrity and shelf life. While raw material price volatility and environmental regulations present challenges, innovation in lightweight, protective, and sustainable packaging materials offers a positive outlook. Flexible packaging and sustainable paper-based alternatives show strong potential. The Asia-Pacific region is anticipated to lead geographic growth due to rising disposable incomes and industrialization.
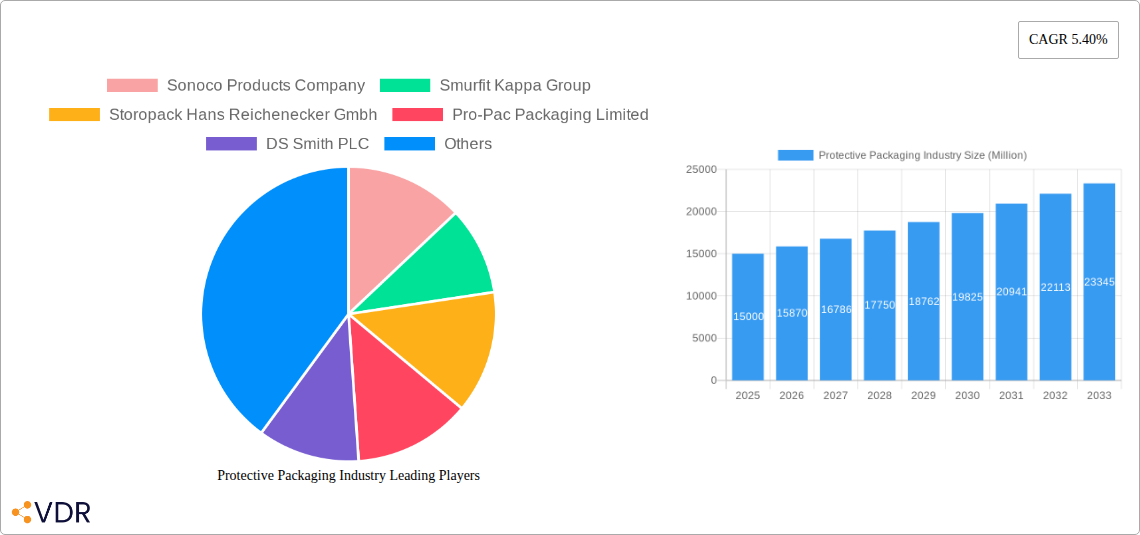
Protective Packaging Industry Market Size (In Billion)
The competitive environment features established multinational corporations and regional players. Leading companies like Sonoco Products Company, Smurfit Kappa Group, and Sealed Air Corporation are investing in R&D, acquisitions, and partnerships to enhance offerings and expand market share. The market is expected to undergo further consolidation, driven by opportunities in specialized protective packaging and evolving consumer preferences for customized solutions, reflecting a trend towards product personalization and supply chain optimization.

Protective Packaging Industry Company Market Share
Protective Packaging Industry Market Report: 2019-2033
This comprehensive report provides an in-depth analysis of the Protective Packaging Industry, covering market dynamics, growth trends, leading players, and future outlook. The study period spans from 2019 to 2033, with 2025 as the base and estimated year. The report segments the market by material type (Plastic, Paper and Paperboard, Other Material Types), product type (Rigid, Flexible), end-user vertical (Food and Beverage, Industrial, Pharmaceuticals, Consumer Electronics, Beauty and Home Care, Other End-user Verticals), and includes a detailed analysis of the "Other Flexible Materials" segment (Foil Pouches/Bags, Stretch and Shrink Films, Foam). The report's findings are crucial for businesses, investors, and researchers seeking to understand this dynamic market. The total market size is predicted to reach xx Million units by 2033.
Protective Packaging Industry Market Dynamics & Structure
The Protective Packaging market is characterized by moderate concentration, with several large players holding significant market share. Sonoco Products Company, Smurfit Kappa Group, and Sealed Air Corporation are among the key players, collectively holding an estimated xx% market share in 2025. However, the market also features numerous smaller players, particularly in specialized niches. Technological innovation, driven by the need for sustainable and efficient packaging solutions, is a key driver. Regulatory frameworks, such as those related to recyclability and environmental impact, significantly influence product development and adoption. Competitive substitutes, such as alternative materials and packaging designs, pose ongoing challenges. End-user demographics, reflecting evolving consumer preferences and industry trends, shape demand patterns. Finally, mergers and acquisitions (M&A) activity is frequent, with an estimated xx M&A deals in the past five years, indicating consolidation and strategic expansion within the sector.
- Market Concentration: Moderately concentrated, with top players holding xx% market share in 2025.
- Technological Innovation: Focus on sustainable materials (bioplastics, recycled content), automation, and smart packaging.
- Regulatory Framework: Increasing emphasis on recyclability, compostability, and reduced environmental impact.
- Competitive Substitutes: Growing competition from alternative packaging materials and designs.
- M&A Activity: Significant M&A activity, driven by consolidation and expansion strategies (approx. xx deals between 2020-2025).
- Innovation Barriers: High R&D costs, regulatory compliance challenges, and consumer acceptance of new materials.
Protective Packaging Industry Growth Trends & Insights
The Protective Packaging market experienced a CAGR of xx% during the historical period (2019-2024), driven by factors such as the growth of e-commerce, increasing demand for food and pharmaceuticals, and the need for robust product protection during transportation. The market is expected to maintain a CAGR of xx% during the forecast period (2025-2033), fueled by ongoing technological advancements, growing consumer awareness of sustainable practices, and rising demand from various end-use sectors. The adoption rate of sustainable packaging solutions is increasing steadily, further propelling market growth. Consumer behavior shifts toward eco-friendly products and personalized experiences are influencing packaging choices, pushing innovation in materials and designs. Technological disruptions, such as the introduction of smart packaging and automation in production, are transforming the industry landscape. Market penetration for specific product types, such as flexible packaging, is expected to increase significantly in the coming years.
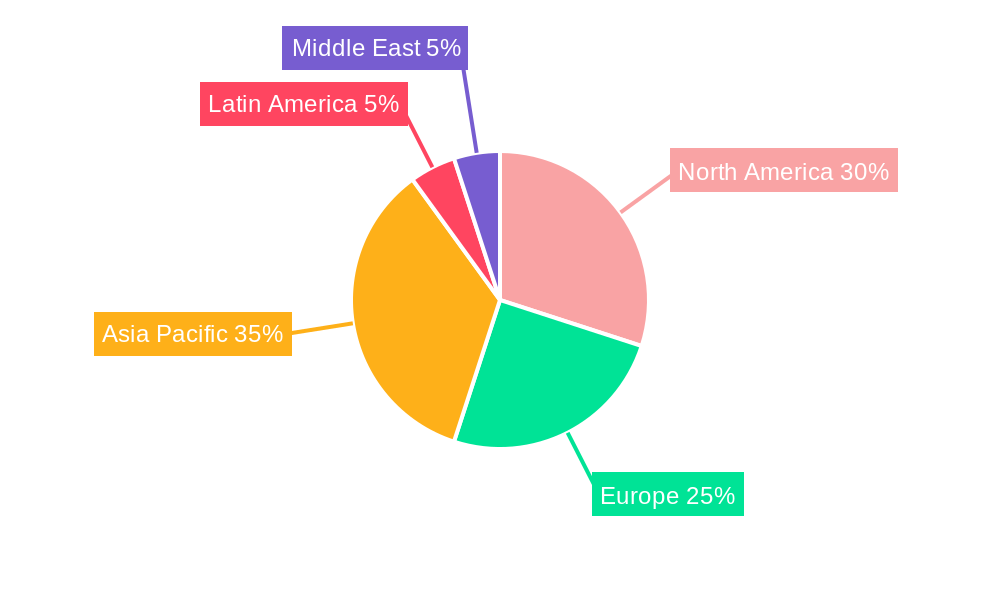
Dominant Regions, Countries, or Segments in Protective Packaging Industry
North America currently holds the largest market share in the protective packaging industry, driven by strong demand from various end-use sectors, particularly food and beverage and e-commerce. Europe follows closely, with a significant contribution from the pharmaceutical and industrial sectors. The Asia-Pacific region exhibits the highest growth potential, driven by rapid industrialization, rising disposable incomes, and expanding e-commerce infrastructure. Within segments, the demand for flexible packaging, particularly stretch and shrink films, is experiencing rapid growth, surpassing rigid packaging growth rates. The food and beverage sector accounts for the largest share of end-user demand, followed by the industrial sector.
- North America: Strong demand from food & beverage and e-commerce; high market maturity.
- Europe: Significant pharmaceutical and industrial sector contributions; focus on sustainability.
- Asia-Pacific: Fastest-growing region; driven by industrialization, rising incomes, and e-commerce expansion.
- Flexible Packaging: Highest growth segment, driven by increased demand for lightweight, cost-effective solutions.
- Food & Beverage: Largest end-use sector, driven by increasing demand for packaged food products.
Protective Packaging Industry Product Landscape
The protective packaging market showcases continuous product innovation, with a focus on improved protection, sustainability, and convenience. Advancements include the use of biodegradable and compostable materials, lighter-weight designs, and integrated tamper-evident features. Products now incorporate smart packaging technologies, allowing for real-time tracking and monitoring of goods during transit. The industry is witnessing increasing customization and personalization of packaging solutions to cater to specific product needs and brand requirements. Unique selling propositions often center on improved barrier properties, reduced environmental impact, and enhanced product visibility.
Key Drivers, Barriers & Challenges in Protective Packaging Industry
Key Drivers: Growing e-commerce, increasing demand for packaged goods across various sectors, advancements in materials science enabling more sustainable solutions, and stricter regulations promoting environmentally friendly packaging.
Key Challenges: Fluctuating raw material prices, intense competition among manufacturers, stringent environmental regulations, and concerns about the environmental impact of plastic packaging (estimated xx Million units of plastic packaging generated annually contribute to environmental challenges).
Emerging Opportunities in Protective Packaging Industry
Emerging opportunities include the rise of sustainable packaging solutions made from recycled or renewable materials, the growth of customized and personalized packaging, the integration of smart packaging technologies for product tracking and authentication, and the expansion into untapped markets in developing economies.
Growth Accelerators in the Protective Packaging Industry
Technological advancements in materials science and manufacturing processes, strategic partnerships between packaging manufacturers and brand owners to develop innovative solutions, and expansion into new geographic markets with high growth potential will significantly drive long-term growth in the protective packaging industry.
Key Players Shaping the Protective Packaging Industry Market
- Sonoco Products Company
- Smurfit Kappa Group
- Storopack Hans Reichenecker GmbH
- Pro-Pac Packaging Limited
- DS Smith PLC
- Huhtamaki Group
- Riverside Paper Co
- Pregis Corporation
- International Paper Company
- Signode Protective Packaging Solutions
- Crown Holdings Inc
- Intertape Polymer Group Inc
- Sealed Air Corporation
Notable Milestones in Protective Packaging Industry Sector
- 2020: Sealed Air launches a new range of sustainable packaging solutions.
- 2021: Smurfit Kappa acquires a smaller packaging company, expanding its market reach.
- 2022: Sonoco Products invests heavily in R&D for biodegradable packaging materials.
- 2023: Several key players announce commitments to using 100% recycled content in their packaging by 2030.
In-Depth Protective Packaging Industry Market Outlook
The protective packaging industry is poised for continued growth, driven by evolving consumer preferences, technological advancements, and the rising demand for sustainable solutions. Strategic partnerships, investments in R&D, and expansion into emerging markets will be crucial for success. The market's future potential is significant, with opportunities for innovative packaging designs and materials that address environmental concerns and enhance product protection.
Protective Packaging Industry Segmentation
-
1. Material Type
- 1.1. Plastic
- 1.2. Paper and Paperboard
- 1.3. Other Material Types
-
2. Product
-
2.1. Rigid
- 2.1.1. Corrugated Paperboard Protectors
- 2.1.2. Molded Pulp
- 2.1.3. Insulated Shipping Containers
- 2.1.4. Other Product Types
-
2.2. Flexible
- 2.2.1. Protective Mailers
- 2.2.2. Bubble Wraps
- 2.2.3. Air Pillows/Air Bags
- 2.2.4. Paper Fill
- 2.2.5. Other Fl
-
2.3. Foam
- 2.3.1. Molded Foam
- 2.3.2. Foam in Place (FIP)
- 2.3.3. Loose Fill
- 2.3.4. Foam Rolls/Sheets
- 2.3.5. Other Types of Foam (Corner Blocks, etc.)
-
2.1. Rigid
-
3. End-user Vertical
- 3.1. Food and Beverage
- 3.2. Industrial
- 3.3. Pharmaceuticals
- 3.4. Consumer Electronics
- 3.5. Beauty and Home Care
- 3.6. Other End-user Verticals
Protective Packaging Industry Segmentation By Geography
- 1. North America
- 2. Europe
- 3. Asia Pacific
- 4. Latin America
- 5. Middle East
Protective Packaging Industry Regional Market Share
Geographic Coverage of Protective Packaging Industry
Protective Packaging Industry REPORT HIGHLIGHTS
| Aspects | Details |
|---|---|
| Study Period | 2020-2034 |
| Base Year | 2025 |
| Estimated Year | 2026 |
| Forecast Period | 2026-2034 |
| Historical Period | 2020-2025 |
| Growth Rate | CAGR of 4.6% from 2020-2034 |
| Segmentation |
|
Table of Contents
- 1. Introduction
- 1.1. Research Scope
- 1.2. Market Segmentation
- 1.3. Research Objective
- 1.4. Definitions and Assumptions
- 2. Executive Summary
- 2.1. Market Snapshot
- 3. Market Dynamics
- 3.1. Market Drivers
- 3.2. Market Restrains
- 3.3. Market Trends
- 3.4. Market Opportunities
- 4. Market Factor Analysis
- 4.1. Porters Five Forces
- 4.1.1. Bargaining Power of Suppliers
- 4.1.2. Bargaining Power of Buyers
- 4.1.3. Threat of New Entrants
- 4.1.4. Threat of Substitutes
- 4.1.5. Competitive Rivalry
- 4.2. PESTEL analysis
- 4.3. BCG Analysis
- 4.3.1. Stars (High Growth, High Market Share)
- 4.3.2. Cash Cows (Low Growth, High Market Share)
- 4.3.3. Question Mark (High Growth, Low Market Share)
- 4.3.4. Dogs (Low Growth, Low Market Share)
- 4.4. Ansoff Matrix Analysis
- 4.5. Supply Chain Analysis
- 4.6. Regulatory Landscape
- 4.7. Current Market Potential and Opportunity Assessment (TAM–SAM–SOM Framework)
- 4.8. VDR Analyst Note
- 4.1. Porters Five Forces
- 5. Market Analysis, Insights and Forecast 2021-2033
- 5.1. Market Analysis, Insights and Forecast - by Material Type
- 5.1.1. Plastic
- 5.1.2. Paper and Paperboard
- 5.1.3. Other Material Types
- 5.2. Market Analysis, Insights and Forecast - by Product
- 5.2.1. Rigid
- 5.2.1.1. Corrugated Paperboard Protectors
- 5.2.1.2. Molded Pulp
- 5.2.1.3. Insulated Shipping Containers
- 5.2.1.4. Other Product Types
- 5.2.2. Flexible
- 5.2.2.1. Protective Mailers
- 5.2.2.2. Bubble Wraps
- 5.2.2.3. Air Pillows/Air Bags
- 5.2.2.4. Paper Fill
- 5.2.2.5. Other Fl
- 5.2.3. Foam
- 5.2.3.1. Molded Foam
- 5.2.3.2. Foam in Place (FIP)
- 5.2.3.3. Loose Fill
- 5.2.3.4. Foam Rolls/Sheets
- 5.2.3.5. Other Types of Foam (Corner Blocks, etc.)
- 5.2.1. Rigid
- 5.3. Market Analysis, Insights and Forecast - by End-user Vertical
- 5.3.1. Food and Beverage
- 5.3.2. Industrial
- 5.3.3. Pharmaceuticals
- 5.3.4. Consumer Electronics
- 5.3.5. Beauty and Home Care
- 5.3.6. Other End-user Verticals
- 5.4. Market Analysis, Insights and Forecast - by Region
- 5.4.1. North America
- 5.4.2. Europe
- 5.4.3. Asia Pacific
- 5.4.4. Latin America
- 5.4.5. Middle East
- 5.1. Market Analysis, Insights and Forecast - by Material Type
- 6. Global Protective Packaging Industry Analysis, Insights and Forecast, 2021-2033
- 6.1. Market Analysis, Insights and Forecast - by Material Type
- 6.1.1. Plastic
- 6.1.2. Paper and Paperboard
- 6.1.3. Other Material Types
- 6.2. Market Analysis, Insights and Forecast - by Product
- 6.2.1. Rigid
- 6.2.1.1. Corrugated Paperboard Protectors
- 6.2.1.2. Molded Pulp
- 6.2.1.3. Insulated Shipping Containers
- 6.2.1.4. Other Product Types
- 6.2.2. Flexible
- 6.2.2.1. Protective Mailers
- 6.2.2.2. Bubble Wraps
- 6.2.2.3. Air Pillows/Air Bags
- 6.2.2.4. Paper Fill
- 6.2.2.5. Other Fl
- 6.2.3. Foam
- 6.2.3.1. Molded Foam
- 6.2.3.2. Foam in Place (FIP)
- 6.2.3.3. Loose Fill
- 6.2.3.4. Foam Rolls/Sheets
- 6.2.3.5. Other Types of Foam (Corner Blocks, etc.)
- 6.2.1. Rigid
- 6.3. Market Analysis, Insights and Forecast - by End-user Vertical
- 6.3.1. Food and Beverage
- 6.3.2. Industrial
- 6.3.3. Pharmaceuticals
- 6.3.4. Consumer Electronics
- 6.3.5. Beauty and Home Care
- 6.3.6. Other End-user Verticals
- 6.1. Market Analysis, Insights and Forecast - by Material Type
- 7. North America Protective Packaging Industry Analysis, Insights and Forecast, 2021-2033
- 7.1. Market Analysis, Insights and Forecast - by Material Type
- 7.1.1. Plastic
- 7.1.2. Paper and Paperboard
- 7.1.3. Other Material Types
- 7.2. Market Analysis, Insights and Forecast - by Product
- 7.2.1. Rigid
- 7.2.1.1. Corrugated Paperboard Protectors
- 7.2.1.2. Molded Pulp
- 7.2.1.3. Insulated Shipping Containers
- 7.2.1.4. Other Product Types
- 7.2.2. Flexible
- 7.2.2.1. Protective Mailers
- 7.2.2.2. Bubble Wraps
- 7.2.2.3. Air Pillows/Air Bags
- 7.2.2.4. Paper Fill
- 7.2.2.5. Other Fl
- 7.2.3. Foam
- 7.2.3.1. Molded Foam
- 7.2.3.2. Foam in Place (FIP)
- 7.2.3.3. Loose Fill
- 7.2.3.4. Foam Rolls/Sheets
- 7.2.3.5. Other Types of Foam (Corner Blocks, etc.)
- 7.2.1. Rigid
- 7.3. Market Analysis, Insights and Forecast - by End-user Vertical
- 7.3.1. Food and Beverage
- 7.3.2. Industrial
- 7.3.3. Pharmaceuticals
- 7.3.4. Consumer Electronics
- 7.3.5. Beauty and Home Care
- 7.3.6. Other End-user Verticals
- 7.1. Market Analysis, Insights and Forecast - by Material Type
- 8. Europe Protective Packaging Industry Analysis, Insights and Forecast, 2021-2033
- 8.1. Market Analysis, Insights and Forecast - by Material Type
- 8.1.1. Plastic
- 8.1.2. Paper and Paperboard
- 8.1.3. Other Material Types
- 8.2. Market Analysis, Insights and Forecast - by Product
- 8.2.1. Rigid
- 8.2.1.1. Corrugated Paperboard Protectors
- 8.2.1.2. Molded Pulp
- 8.2.1.3. Insulated Shipping Containers
- 8.2.1.4. Other Product Types
- 8.2.2. Flexible
- 8.2.2.1. Protective Mailers
- 8.2.2.2. Bubble Wraps
- 8.2.2.3. Air Pillows/Air Bags
- 8.2.2.4. Paper Fill
- 8.2.2.5. Other Fl
- 8.2.3. Foam
- 8.2.3.1. Molded Foam
- 8.2.3.2. Foam in Place (FIP)
- 8.2.3.3. Loose Fill
- 8.2.3.4. Foam Rolls/Sheets
- 8.2.3.5. Other Types of Foam (Corner Blocks, etc.)
- 8.2.1. Rigid
- 8.3. Market Analysis, Insights and Forecast - by End-user Vertical
- 8.3.1. Food and Beverage
- 8.3.2. Industrial
- 8.3.3. Pharmaceuticals
- 8.3.4. Consumer Electronics
- 8.3.5. Beauty and Home Care
- 8.3.6. Other End-user Verticals
- 8.1. Market Analysis, Insights and Forecast - by Material Type
- 9. Asia Pacific Protective Packaging Industry Analysis, Insights and Forecast, 2021-2033
- 9.1. Market Analysis, Insights and Forecast - by Material Type
- 9.1.1. Plastic
- 9.1.2. Paper and Paperboard
- 9.1.3. Other Material Types
- 9.2. Market Analysis, Insights and Forecast - by Product
- 9.2.1. Rigid
- 9.2.1.1. Corrugated Paperboard Protectors
- 9.2.1.2. Molded Pulp
- 9.2.1.3. Insulated Shipping Containers
- 9.2.1.4. Other Product Types
- 9.2.2. Flexible
- 9.2.2.1. Protective Mailers
- 9.2.2.2. Bubble Wraps
- 9.2.2.3. Air Pillows/Air Bags
- 9.2.2.4. Paper Fill
- 9.2.2.5. Other Fl
- 9.2.3. Foam
- 9.2.3.1. Molded Foam
- 9.2.3.2. Foam in Place (FIP)
- 9.2.3.3. Loose Fill
- 9.2.3.4. Foam Rolls/Sheets
- 9.2.3.5. Other Types of Foam (Corner Blocks, etc.)
- 9.2.1. Rigid
- 9.3. Market Analysis, Insights and Forecast - by End-user Vertical
- 9.3.1. Food and Beverage
- 9.3.2. Industrial
- 9.3.3. Pharmaceuticals
- 9.3.4. Consumer Electronics
- 9.3.5. Beauty and Home Care
- 9.3.6. Other End-user Verticals
- 9.1. Market Analysis, Insights and Forecast - by Material Type
- 10. Latin America Protective Packaging Industry Analysis, Insights and Forecast, 2021-2033
- 10.1. Market Analysis, Insights and Forecast - by Material Type
- 10.1.1. Plastic
- 10.1.2. Paper and Paperboard
- 10.1.3. Other Material Types
- 10.2. Market Analysis, Insights and Forecast - by Product
- 10.2.1. Rigid
- 10.2.1.1. Corrugated Paperboard Protectors
- 10.2.1.2. Molded Pulp
- 10.2.1.3. Insulated Shipping Containers
- 10.2.1.4. Other Product Types
- 10.2.2. Flexible
- 10.2.2.1. Protective Mailers
- 10.2.2.2. Bubble Wraps
- 10.2.2.3. Air Pillows/Air Bags
- 10.2.2.4. Paper Fill
- 10.2.2.5. Other Fl
- 10.2.3. Foam
- 10.2.3.1. Molded Foam
- 10.2.3.2. Foam in Place (FIP)
- 10.2.3.3. Loose Fill
- 10.2.3.4. Foam Rolls/Sheets
- 10.2.3.5. Other Types of Foam (Corner Blocks, etc.)
- 10.2.1. Rigid
- 10.3. Market Analysis, Insights and Forecast - by End-user Vertical
- 10.3.1. Food and Beverage
- 10.3.2. Industrial
- 10.3.3. Pharmaceuticals
- 10.3.4. Consumer Electronics
- 10.3.5. Beauty and Home Care
- 10.3.6. Other End-user Verticals
- 10.1. Market Analysis, Insights and Forecast - by Material Type
- 11. Middle East Protective Packaging Industry Analysis, Insights and Forecast, 2021-2033
- 11.1. Market Analysis, Insights and Forecast - by Material Type
- 11.1.1. Plastic
- 11.1.2. Paper and Paperboard
- 11.1.3. Other Material Types
- 11.2. Market Analysis, Insights and Forecast - by Product
- 11.2.1. Rigid
- 11.2.1.1. Corrugated Paperboard Protectors
- 11.2.1.2. Molded Pulp
- 11.2.1.3. Insulated Shipping Containers
- 11.2.1.4. Other Product Types
- 11.2.2. Flexible
- 11.2.2.1. Protective Mailers
- 11.2.2.2. Bubble Wraps
- 11.2.2.3. Air Pillows/Air Bags
- 11.2.2.4. Paper Fill
- 11.2.2.5. Other Fl
- 11.2.3. Foam
- 11.2.3.1. Molded Foam
- 11.2.3.2. Foam in Place (FIP)
- 11.2.3.3. Loose Fill
- 11.2.3.4. Foam Rolls/Sheets
- 11.2.3.5. Other Types of Foam (Corner Blocks, etc.)
- 11.2.1. Rigid
- 11.3. Market Analysis, Insights and Forecast - by End-user Vertical
- 11.3.1. Food and Beverage
- 11.3.2. Industrial
- 11.3.3. Pharmaceuticals
- 11.3.4. Consumer Electronics
- 11.3.5. Beauty and Home Care
- 11.3.6. Other End-user Verticals
- 11.1. Market Analysis, Insights and Forecast - by Material Type
- 12. Competitive Analysis
- 12.1. Company Profiles
- 12.1.1 Sonoco Products Company
- 12.1.1.1. Company Overview
- 12.1.1.2. Products
- 12.1.1.3. Company Financials
- 12.1.1.4. SWOT Analysis
- 12.1.2 Smurfit Kappa Group
- 12.1.2.1. Company Overview
- 12.1.2.2. Products
- 12.1.2.3. Company Financials
- 12.1.2.4. SWOT Analysis
- 12.1.3 Storopack Hans Reichenecker Gmbh
- 12.1.3.1. Company Overview
- 12.1.3.2. Products
- 12.1.3.3. Company Financials
- 12.1.3.4. SWOT Analysis
- 12.1.4 Pro-Pac Packaging Limited
- 12.1.4.1. Company Overview
- 12.1.4.2. Products
- 12.1.4.3. Company Financials
- 12.1.4.4. SWOT Analysis
- 12.1.5 DS Smith PLC
- 12.1.5.1. Company Overview
- 12.1.5.2. Products
- 12.1.5.3. Company Financials
- 12.1.5.4. SWOT Analysis
- 12.1.6 Huhtamaki Group
- 12.1.6.1. Company Overview
- 12.1.6.2. Products
- 12.1.6.3. Company Financials
- 12.1.6.4. SWOT Analysis
- 12.1.7 Riverside Paper Co
- 12.1.7.1. Company Overview
- 12.1.7.2. Products
- 12.1.7.3. Company Financials
- 12.1.7.4. SWOT Analysis
- 12.1.8 Pregis Corporation
- 12.1.8.1. Company Overview
- 12.1.8.2. Products
- 12.1.8.3. Company Financials
- 12.1.8.4. SWOT Analysis
- 12.1.9 International Paper Company
- 12.1.9.1. Company Overview
- 12.1.9.2. Products
- 12.1.9.3. Company Financials
- 12.1.9.4. SWOT Analysis
- 12.1.10 Signode Protective Packaging Solutions
- 12.1.10.1. Company Overview
- 12.1.10.2. Products
- 12.1.10.3. Company Financials
- 12.1.10.4. SWOT Analysis
- 12.1.11 Crown Holdings Inc *List Not Exhaustive
- 12.1.11.1. Company Overview
- 12.1.11.2. Products
- 12.1.11.3. Company Financials
- 12.1.11.4. SWOT Analysis
- 12.1.12 Intertape Polymer Group Inc
- 12.1.12.1. Company Overview
- 12.1.12.2. Products
- 12.1.12.3. Company Financials
- 12.1.12.4. SWOT Analysis
- 12.1.13 Sealed Air Corporation
- 12.1.13.1. Company Overview
- 12.1.13.2. Products
- 12.1.13.3. Company Financials
- 12.1.13.4. SWOT Analysis
- 12.1.1 Sonoco Products Company
- 12.2. Market Entropy
- 12.2.1 Company's Key Areas Served
- 12.2.2 Recent Developments
- 12.3. Company Market Share Analysis 2025
- 12.3.1 Top 5 Companies Market Share Analysis
- 12.3.2 Top 3 Companies Market Share Analysis
- 12.4. List of Potential Customers
- 13. Research Methodology
List of Figures
- Figure 1: Global Protective Packaging Industry Revenue Breakdown (billion, %) by Region 2025 & 2033
- Figure 2: North America Protective Packaging Industry Revenue (billion), by Material Type 2025 & 2033
- Figure 3: North America Protective Packaging Industry Revenue Share (%), by Material Type 2025 & 2033
- Figure 4: North America Protective Packaging Industry Revenue (billion), by Product 2025 & 2033
- Figure 5: North America Protective Packaging Industry Revenue Share (%), by Product 2025 & 2033
- Figure 6: North America Protective Packaging Industry Revenue (billion), by End-user Vertical 2025 & 2033
- Figure 7: North America Protective Packaging Industry Revenue Share (%), by End-user Vertical 2025 & 2033
- Figure 8: North America Protective Packaging Industry Revenue (billion), by Country 2025 & 2033
- Figure 9: North America Protective Packaging Industry Revenue Share (%), by Country 2025 & 2033
- Figure 10: Europe Protective Packaging Industry Revenue (billion), by Material Type 2025 & 2033
- Figure 11: Europe Protective Packaging Industry Revenue Share (%), by Material Type 2025 & 2033
- Figure 12: Europe Protective Packaging Industry Revenue (billion), by Product 2025 & 2033
- Figure 13: Europe Protective Packaging Industry Revenue Share (%), by Product 2025 & 2033
- Figure 14: Europe Protective Packaging Industry Revenue (billion), by End-user Vertical 2025 & 2033
- Figure 15: Europe Protective Packaging Industry Revenue Share (%), by End-user Vertical 2025 & 2033
- Figure 16: Europe Protective Packaging Industry Revenue (billion), by Country 2025 & 2033
- Figure 17: Europe Protective Packaging Industry Revenue Share (%), by Country 2025 & 2033
- Figure 18: Asia Pacific Protective Packaging Industry Revenue (billion), by Material Type 2025 & 2033
- Figure 19: Asia Pacific Protective Packaging Industry Revenue Share (%), by Material Type 2025 & 2033
- Figure 20: Asia Pacific Protective Packaging Industry Revenue (billion), by Product 2025 & 2033
- Figure 21: Asia Pacific Protective Packaging Industry Revenue Share (%), by Product 2025 & 2033
- Figure 22: Asia Pacific Protective Packaging Industry Revenue (billion), by End-user Vertical 2025 & 2033
- Figure 23: Asia Pacific Protective Packaging Industry Revenue Share (%), by End-user Vertical 2025 & 2033
- Figure 24: Asia Pacific Protective Packaging Industry Revenue (billion), by Country 2025 & 2033
- Figure 25: Asia Pacific Protective Packaging Industry Revenue Share (%), by Country 2025 & 2033
- Figure 26: Latin America Protective Packaging Industry Revenue (billion), by Material Type 2025 & 2033
- Figure 27: Latin America Protective Packaging Industry Revenue Share (%), by Material Type 2025 & 2033
- Figure 28: Latin America Protective Packaging Industry Revenue (billion), by Product 2025 & 2033
- Figure 29: Latin America Protective Packaging Industry Revenue Share (%), by Product 2025 & 2033
- Figure 30: Latin America Protective Packaging Industry Revenue (billion), by End-user Vertical 2025 & 2033
- Figure 31: Latin America Protective Packaging Industry Revenue Share (%), by End-user Vertical 2025 & 2033
- Figure 32: Latin America Protective Packaging Industry Revenue (billion), by Country 2025 & 2033
- Figure 33: Latin America Protective Packaging Industry Revenue Share (%), by Country 2025 & 2033
- Figure 34: Middle East Protective Packaging Industry Revenue (billion), by Material Type 2025 & 2033
- Figure 35: Middle East Protective Packaging Industry Revenue Share (%), by Material Type 2025 & 2033
- Figure 36: Middle East Protective Packaging Industry Revenue (billion), by Product 2025 & 2033
- Figure 37: Middle East Protective Packaging Industry Revenue Share (%), by Product 2025 & 2033
- Figure 38: Middle East Protective Packaging Industry Revenue (billion), by End-user Vertical 2025 & 2033
- Figure 39: Middle East Protective Packaging Industry Revenue Share (%), by End-user Vertical 2025 & 2033
- Figure 40: Middle East Protective Packaging Industry Revenue (billion), by Country 2025 & 2033
- Figure 41: Middle East Protective Packaging Industry Revenue Share (%), by Country 2025 & 2033
List of Tables
- Table 1: Global Protective Packaging Industry Revenue billion Forecast, by Material Type 2020 & 2033
- Table 2: Global Protective Packaging Industry Revenue billion Forecast, by Product 2020 & 2033
- Table 3: Global Protective Packaging Industry Revenue billion Forecast, by End-user Vertical 2020 & 2033
- Table 4: Global Protective Packaging Industry Revenue billion Forecast, by Region 2020 & 2033
- Table 5: Global Protective Packaging Industry Revenue billion Forecast, by Material Type 2020 & 2033
- Table 6: Global Protective Packaging Industry Revenue billion Forecast, by Product 2020 & 2033
- Table 7: Global Protective Packaging Industry Revenue billion Forecast, by End-user Vertical 2020 & 2033
- Table 8: Global Protective Packaging Industry Revenue billion Forecast, by Country 2020 & 2033
- Table 9: Global Protective Packaging Industry Revenue billion Forecast, by Material Type 2020 & 2033
- Table 10: Global Protective Packaging Industry Revenue billion Forecast, by Product 2020 & 2033
- Table 11: Global Protective Packaging Industry Revenue billion Forecast, by End-user Vertical 2020 & 2033
- Table 12: Global Protective Packaging Industry Revenue billion Forecast, by Country 2020 & 2033
- Table 13: Global Protective Packaging Industry Revenue billion Forecast, by Material Type 2020 & 2033
- Table 14: Global Protective Packaging Industry Revenue billion Forecast, by Product 2020 & 2033
- Table 15: Global Protective Packaging Industry Revenue billion Forecast, by End-user Vertical 2020 & 2033
- Table 16: Global Protective Packaging Industry Revenue billion Forecast, by Country 2020 & 2033
- Table 17: Global Protective Packaging Industry Revenue billion Forecast, by Material Type 2020 & 2033
- Table 18: Global Protective Packaging Industry Revenue billion Forecast, by Product 2020 & 2033
- Table 19: Global Protective Packaging Industry Revenue billion Forecast, by End-user Vertical 2020 & 2033
- Table 20: Global Protective Packaging Industry Revenue billion Forecast, by Country 2020 & 2033
- Table 21: Global Protective Packaging Industry Revenue billion Forecast, by Material Type 2020 & 2033
- Table 22: Global Protective Packaging Industry Revenue billion Forecast, by Product 2020 & 2033
- Table 23: Global Protective Packaging Industry Revenue billion Forecast, by End-user Vertical 2020 & 2033
- Table 24: Global Protective Packaging Industry Revenue billion Forecast, by Country 2020 & 2033
Frequently Asked Questions
1. What is the projected Compound Annual Growth Rate (CAGR) of the Protective Packaging Industry?
The projected CAGR is approximately 4.6%.
2. Which companies are prominent players in the Protective Packaging Industry?
Key companies in the market include Sonoco Products Company, Smurfit Kappa Group, Storopack Hans Reichenecker Gmbh, Pro-Pac Packaging Limited, DS Smith PLC, Huhtamaki Group, Riverside Paper Co, Pregis Corporation, International Paper Company, Signode Protective Packaging Solutions, Crown Holdings Inc *List Not Exhaustive, Intertape Polymer Group Inc, Sealed Air Corporation.
3. What are the main segments of the Protective Packaging Industry?
The market segments include Material Type, Product, End-user Vertical.
4. Can you provide details about the market size?
The market size is estimated to be USD 33.92 billion as of 2022.
5. What are some drivers contributing to market growth?
; Increasing Trend of E-Commerce.
6. What are the notable trends driving market growth?
Plastic-based Protective Packaging is Expected to Occupy Significant Market Share.
7. Are there any restraints impacting market growth?
; Alternative Forms of Packaging.
8. Can you provide examples of recent developments in the market?
N/A
9. What pricing options are available for accessing the report?
Pricing options include single-user, multi-user, and enterprise licenses priced at USD 4750, USD 5250, and USD 8750 respectively.
10. Is the market size provided in terms of value or volume?
The market size is provided in terms of value, measured in billion.
11. Are there any specific market keywords associated with the report?
Yes, the market keyword associated with the report is "Protective Packaging Industry," which aids in identifying and referencing the specific market segment covered.
12. How do I determine which pricing option suits my needs best?
The pricing options vary based on user requirements and access needs. Individual users may opt for single-user licenses, while businesses requiring broader access may choose multi-user or enterprise licenses for cost-effective access to the report.
13. Are there any additional resources or data provided in the Protective Packaging Industry report?
While the report offers comprehensive insights, it's advisable to review the specific contents or supplementary materials provided to ascertain if additional resources or data are available.
14. How can I stay updated on further developments or reports in the Protective Packaging Industry?
To stay informed about further developments, trends, and reports in the Protective Packaging Industry, consider subscribing to industry newsletters, following relevant companies and organizations, or regularly checking reputable industry news sources and publications.
Methodology
Step 1 - Identification of Relevant Samples Size from Population Database


Step 2 - Approaches for Defining Global Market Size (Value, Volume* & Price*)

Note*: In applicable scenarios
Step 3 - Data Sources
Primary Research
- Web Analytics
- Survey Reports
- Research Institute
- Latest Research Reports
- Opinion Leaders
Secondary Research
- Annual Reports
- White Paper
- Latest Press Release
- Industry Association
- Paid Database
- Investor Presentations

Step 4 - Data Triangulation
Involves using different sources of information in order to increase the validity of a study
These sources are likely to be stakeholders in a program - participants, other researchers, program staff, other community members, and so on.
Then we put all data in single framework & apply various statistical tools to find out the dynamic on the market.
During the analysis stage, feedback from the stakeholder groups would be compared to determine areas of agreement as well as areas of divergence