

Key Insights
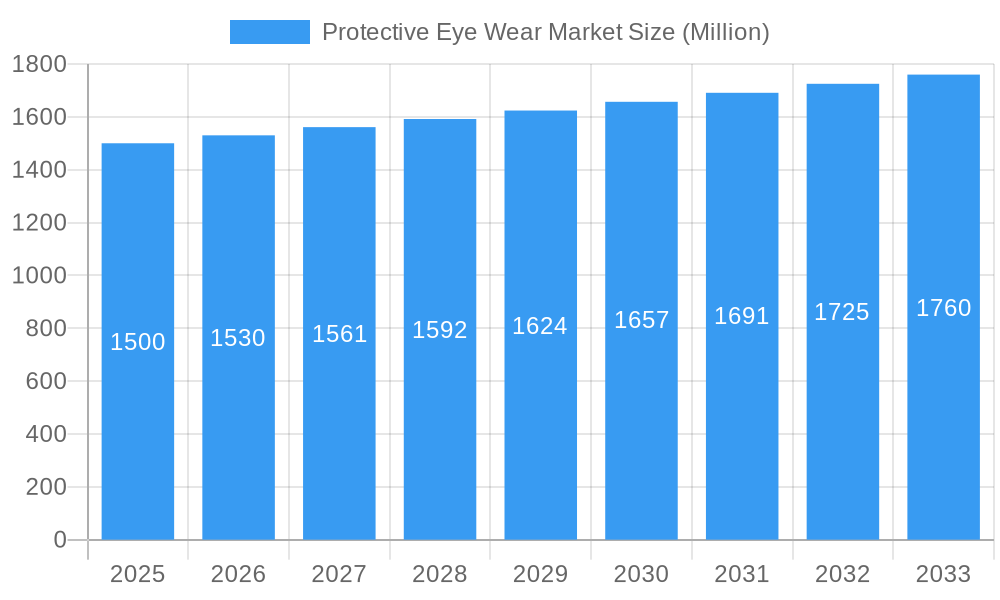
The global protective eyewear market, featuring spectacles, welding protection glasses, overspecs, and goggles, is a mature sector poised for stable expansion. Industry analysis indicates a compound annual growth rate (CAGR) of 4.54%, projecting a market size of $4.38 billion by 2033, with a base year of 2025. Increased emphasis on workplace safety regulations across key industries such as automotive, construction, and manufacturing is a primary growth driver. Technological advancements, including enhanced lens materials for superior impact and UV protection, alongside the integration of smart features, are further fueling market expansion. The rising incidence of eye-related injuries in industrial environments mandates the adoption of robust safety protocols, thereby supporting market growth. However, economic volatility and the cyclical nature of certain industries may present short-term restraints.
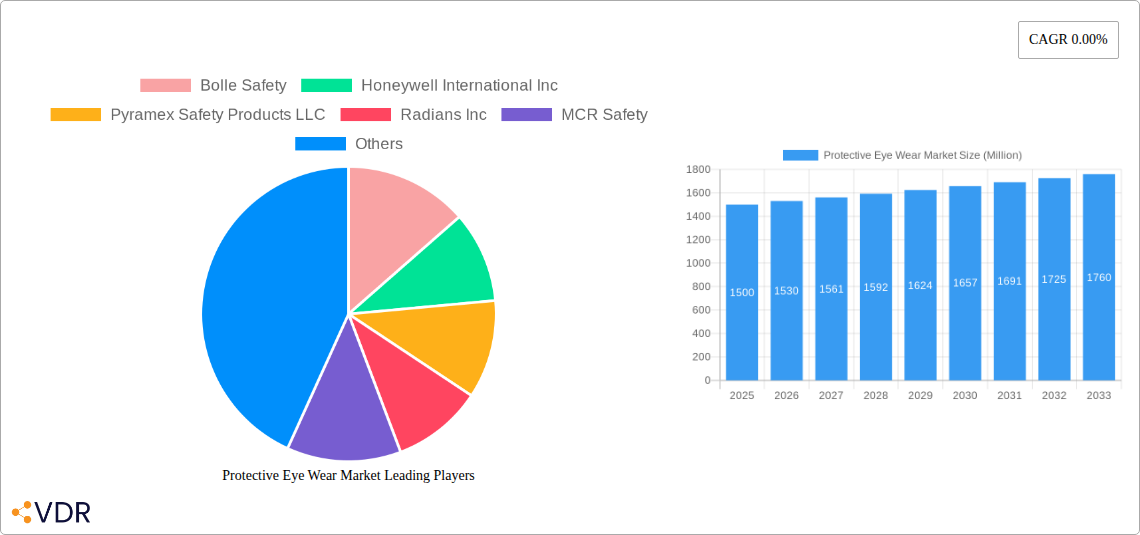
Protective Eye Wear Market Market Size (In Billion)
Geographically, North America and Europe currently dominate the market due to established safety standards and strong industrial sectors. Asia-Pacific offers significant growth potential driven by rapid industrialization and expanding manufacturing hubs. Leading companies like Bollé Safety, Honeywell International Inc., and 3M Company are actively pursuing product innovation, strategic acquisitions, and global market expansion to maintain their competitive edge.
Protective Eye Wear Market Company Market Share
Sustained growth through 2033 is anticipated, propelled by ongoing investments in safety infrastructure and ongoing technological innovations. The competitive landscape is characterized by intense rivalry, with established players contending with specialized manufacturers offering innovative and cost-effective solutions. The growing demand for personalized safety solutions, including custom-fit eyewear and prescription safety glasses, represents a significant niche. Future market expansion will be contingent upon the continued enforcement of stringent safety regulations, the growth of industrial sectors in emerging economies, and the introduction of advanced eyewear with enhanced functionality and comfort. The persistent demand for high-quality, durable, and comfortable protective eyewear will ensure the market's continued, albeit moderate, growth.
Protective Eye Wear Market: A Comprehensive Market Report (2019-2033)
This in-depth report provides a comprehensive analysis of the Protective Eye Wear Market, encompassing market dynamics, growth trends, regional analysis, product landscape, key players, and future outlook. The study period covers 2019-2033, with 2025 as the base and estimated year. The report segments the market by product type (Spectacles, Welding Protection Glasses, Overspecs, Goggles) and end-user industry (Automotive, Construction, Food Industry, Pharmaceutical, Mining, Oil and Gas, Other End-User Industries), offering granular insights for strategic decision-making. The market size is valued in Million units.
Protective Eye Wear Market Dynamics & Structure
The Protective Eye Wear Market is a dynamic landscape shaped by several interconnected factors. Market concentration is moderate, with key players like 3M Company, Honeywell International Inc., and Uvex group holding significant shares, but numerous smaller players also contribute. Technological innovation, particularly in lens materials (e.g., polycarbonate, anti-fog coatings) and frame designs, is a key driver. Stringent safety regulations across various industries mandate the use of protective eyewear, further fueling market growth. The market also faces competition from substitute products, such as face shields, although protective eyewear remains the preferred choice for many applications. Mergers and acquisitions (M&A) activity has been relatively low in recent years (xx deals in the last 5 years), indicating a relatively stable market structure.
- Market Concentration: Moderate, with top players holding xx% market share.
- Technological Innovation: Focus on lighter, more durable materials, enhanced UV protection, and anti-fog technologies.
- Regulatory Framework: Stringent safety standards driving adoption across industries.
- Competitive Substitutes: Face shields present limited competition.
- End-User Demographics: Growth driven by increasing awareness of eye safety across diverse industries.
- M&A Trends: Relatively low activity in recent years, indicating market stability.
Protective Eye Wear Market Growth Trends & Insights
The Protective Eye Wear Market exhibited a CAGR of xx% during the historical period (2019-2024) and is projected to maintain a CAGR of xx% during the forecast period (2025-2033), reaching a market size of xx Million units by 2033. This growth is attributed to several factors. The rising awareness of occupational eye hazards and the increasing adoption of safety protocols across various sectors are key drivers. Technological advancements are leading to the development of more comfortable, durable, and feature-rich eyewear, further boosting market penetration. Consumer preferences are also shifting towards specialized eyewear for specific applications, creating niche markets within the broader industry. Market penetration in developing economies remains relatively low, presenting significant growth opportunities.
Dominant Regions, Countries, or Segments in Protective Eye Wear Market
The North American region currently dominates the Protective Eye Wear Market, driven by stringent safety regulations and a high concentration of industries with significant occupational eye risk (e.g., construction, manufacturing). Within North America, the United States holds the largest market share. However, significant growth potential exists in Asia-Pacific, particularly in rapidly industrializing economies like China and India.
- Leading Region: North America (xx% market share).
- Leading Segment (Product Type): Spectacles (xx% market share), followed by Goggles (xx% market share).
- Leading Segment (End-User): Construction (xx% market share) and Automotive (xx% market share) owing to high occupational eye risks.
- Key Drivers: Stringent safety regulations, increasing industrialization, and rising awareness of eye safety.
Protective Eye Wear Market Product Landscape
The Protective Eye Wear Market offers a diverse range of products, catering to various needs and applications. Innovations focus on enhanced protection against UV rays, impact resistance, and improved comfort features, such as adjustable straps and anti-fog coatings. Advanced lens materials like polycarbonate offer superior impact protection, while specialized coatings enhance scratch resistance and clarity. The unique selling propositions often revolve around weight, comfort, specialized applications (e.g., welding protection), and integration of features like prescription lenses.
Key Drivers, Barriers & Challenges in Protective Eye Wear Market
Key Drivers:
- Increasing awareness of occupational eye hazards.
- Stringent safety regulations across industries.
- Technological advancements in lens materials and designs.
- Growth in construction, manufacturing, and other high-risk industries.
Challenges and Restraints:
- High initial investment costs for advanced eyewear.
- Competition from cheaper, lower-quality alternatives.
- Supply chain disruptions impacting availability and pricing.
- Regulatory hurdles and varying safety standards across regions.
Emerging Opportunities in Protective Eye Wear Market
- Untapped potential in developing economies.
- Growth in specialized eyewear for niche applications (e.g., sports, healthcare).
- Demand for prescription safety eyewear is growing.
- Integration of smart technologies (e.g., connectivity, sensors) in safety glasses presents new opportunities.
Growth Accelerators in the Protective Eye Wear Market Industry
Long-term growth will be driven by technological innovation, strategic partnerships between eyewear manufacturers and industry players, and expansion into new markets. Investments in R&D to develop lighter, more comfortable, and feature-rich eyewear will be crucial. Collaborations with industry leaders will facilitate the adoption of new technologies and expand market reach. Expansion into developing economies with increasing industrial activity represents a key growth avenue.
Key Players Shaping the Protective Eye Wear Market Market
Notable Milestones in Protective Eye Wear Market Sector
- June 2021: MCR Safety launched the Memphis safety glass series with anti-fog lenses and UV protection.
- October 2021: Uvex Group launched the Uvex i-range, offering three varieties with UV 400 protection.
- October 2021: Uvex Group launched Uvex-Purefit, 100% recyclable safety spectacles.
In-Depth Protective Eye Wear Market Market Outlook
The Protective Eye Wear Market is poised for continued growth, driven by ongoing technological advancements, increasing safety awareness, and expansion into new markets. Strategic opportunities exist for companies focusing on innovation, sustainability, and niche applications. The long-term outlook is positive, indicating a strong potential for market expansion and profitability for key players.
Protective Eye Wear Market Segmentation
-
1. Product Type
- 1.1. Spectacles
- 1.2. Welding Protection Glasses
- 1.3. Overspecs
- 1.4. Goggles
-
2. End-User Industry
- 2.1. Automotive
- 2.2. Construction
- 2.3. Food Industry
- 2.4. Pharmaceutical
- 2.5. Mining
- 2.6. Oil and Gas
- 2.7. Other End-User Industries
Protective Eye Wear Market Segmentation By Geography
-
1. North America
- 1.1. United States
- 1.2. Canada
- 1.3. Mexico
- 1.4. Rest of North America
-
2. Europe
- 2.1. Spain
- 2.2. United Kingdom
- 2.3. Germany
- 2.4. France
- 2.5. Italy
- 2.6. Russia
- 2.7. Rest of Europe
-
3. Asia Pacific
- 3.1. China
- 3.2. Japan
- 3.3. India
- 3.4. Australia
- 3.5. Rest of Asia Pacific
-
4. South America
- 4.1. Brazil
- 4.2. Argentina
- 4.3. Rest of South America
-
5. Middle East and Africa
- 5.1. South Africa
- 5.2. United Arab Emirates
- 5.3. Rest of Middle East and Africa
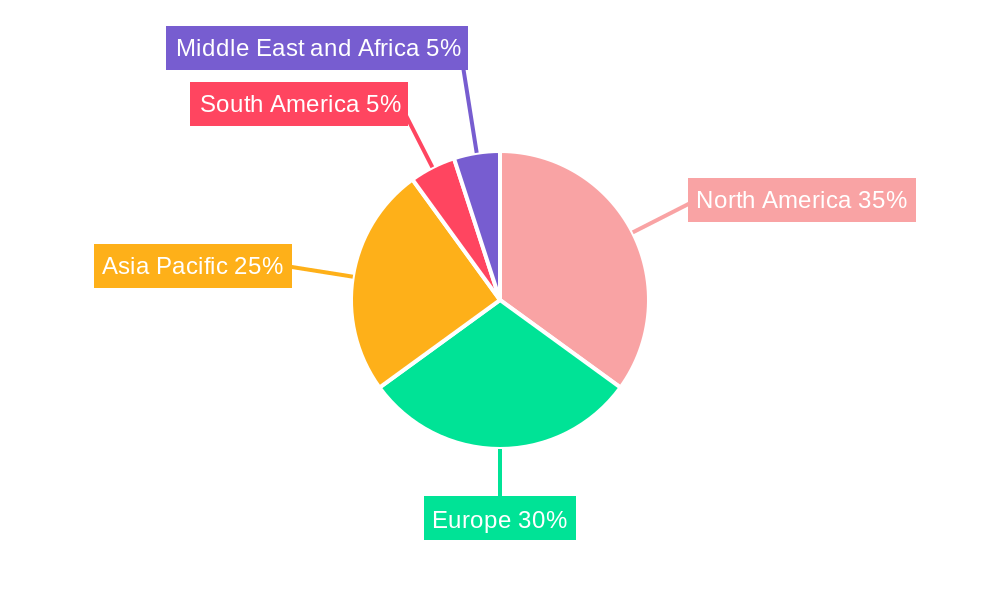
Protective Eye Wear Market Regional Market Share
Geographic Coverage of Protective Eye Wear Market
Protective Eye Wear Market REPORT HIGHLIGHTS
| Aspects | Details |
|---|---|
| Study Period | 2020-2034 |
| Base Year | 2025 |
| Estimated Year | 2026 |
| Forecast Period | 2026-2034 |
| Historical Period | 2020-2025 |
| Growth Rate | CAGR of 4.54% from 2020-2034 |
| Segmentation |
|
Table of Contents
- 1. Introduction
- 1.1. Research Scope
- 1.2. Market Segmentation
- 1.3. Research Objective
- 1.4. Definitions and Assumptions
- 2. Executive Summary
- 2.1. Market Snapshot
- 3. Market Dynamics
- 3.1. Market Drivers
- 3.2. Market Restrains
- 3.3. Market Trends
- 3.4. Market Opportunities
- 4. Market Factor Analysis
- 4.1. Porters Five Forces
- 4.1.1. Bargaining Power of Suppliers
- 4.1.2. Bargaining Power of Buyers
- 4.1.3. Threat of New Entrants
- 4.1.4. Threat of Substitutes
- 4.1.5. Competitive Rivalry
- 4.2. PESTEL analysis
- 4.3. BCG Analysis
- 4.3.1. Stars (High Growth, High Market Share)
- 4.3.2. Cash Cows (Low Growth, High Market Share)
- 4.3.3. Question Mark (High Growth, Low Market Share)
- 4.3.4. Dogs (Low Growth, Low Market Share)
- 4.4. Ansoff Matrix Analysis
- 4.5. Supply Chain Analysis
- 4.6. Regulatory Landscape
- 4.7. Current Market Potential and Opportunity Assessment (TAM–SAM–SOM Framework)
- 4.8. VDR Analyst Note
- 4.1. Porters Five Forces
- 5. Market Analysis, Insights and Forecast 2021-2033
- 5.1. Market Analysis, Insights and Forecast - by Product Type
- 5.1.1. Spectacles
- 5.1.2. Welding Protection Glasses
- 5.1.3. Overspecs
- 5.1.4. Goggles
- 5.2. Market Analysis, Insights and Forecast - by End-User Industry
- 5.2.1. Automotive
- 5.2.2. Construction
- 5.2.3. Food Industry
- 5.2.4. Pharmaceutical
- 5.2.5. Mining
- 5.2.6. Oil and Gas
- 5.2.7. Other End-User Industries
- 5.3. Market Analysis, Insights and Forecast - by Region
- 5.3.1. North America
- 5.3.2. Europe
- 5.3.3. Asia Pacific
- 5.3.4. South America
- 5.3.5. Middle East and Africa
- 5.1. Market Analysis, Insights and Forecast - by Product Type
- 6. Global Protective Eye Wear Market Analysis, Insights and Forecast, 2021-2033
- 6.1. Market Analysis, Insights and Forecast - by Product Type
- 6.1.1. Spectacles
- 6.1.2. Welding Protection Glasses
- 6.1.3. Overspecs
- 6.1.4. Goggles
- 6.2. Market Analysis, Insights and Forecast - by End-User Industry
- 6.2.1. Automotive
- 6.2.2. Construction
- 6.2.3. Food Industry
- 6.2.4. Pharmaceutical
- 6.2.5. Mining
- 6.2.6. Oil and Gas
- 6.2.7. Other End-User Industries
- 6.1. Market Analysis, Insights and Forecast - by Product Type
- 7. North America Protective Eye Wear Market Analysis, Insights and Forecast, 2021-2033
- 7.1. Market Analysis, Insights and Forecast - by Product Type
- 7.1.1. Spectacles
- 7.1.2. Welding Protection Glasses
- 7.1.3. Overspecs
- 7.1.4. Goggles
- 7.2. Market Analysis, Insights and Forecast - by End-User Industry
- 7.2.1. Automotive
- 7.2.2. Construction
- 7.2.3. Food Industry
- 7.2.4. Pharmaceutical
- 7.2.5. Mining
- 7.2.6. Oil and Gas
- 7.2.7. Other End-User Industries
- 7.1. Market Analysis, Insights and Forecast - by Product Type
- 8. Europe Protective Eye Wear Market Analysis, Insights and Forecast, 2021-2033
- 8.1. Market Analysis, Insights and Forecast - by Product Type
- 8.1.1. Spectacles
- 8.1.2. Welding Protection Glasses
- 8.1.3. Overspecs
- 8.1.4. Goggles
- 8.2. Market Analysis, Insights and Forecast - by End-User Industry
- 8.2.1. Automotive
- 8.2.2. Construction
- 8.2.3. Food Industry
- 8.2.4. Pharmaceutical
- 8.2.5. Mining
- 8.2.6. Oil and Gas
- 8.2.7. Other End-User Industries
- 8.1. Market Analysis, Insights and Forecast - by Product Type
- 9. Asia Pacific Protective Eye Wear Market Analysis, Insights and Forecast, 2021-2033
- 9.1. Market Analysis, Insights and Forecast - by Product Type
- 9.1.1. Spectacles
- 9.1.2. Welding Protection Glasses
- 9.1.3. Overspecs
- 9.1.4. Goggles
- 9.2. Market Analysis, Insights and Forecast - by End-User Industry
- 9.2.1. Automotive
- 9.2.2. Construction
- 9.2.3. Food Industry
- 9.2.4. Pharmaceutical
- 9.2.5. Mining
- 9.2.6. Oil and Gas
- 9.2.7. Other End-User Industries
- 9.1. Market Analysis, Insights and Forecast - by Product Type
- 10. South America Protective Eye Wear Market Analysis, Insights and Forecast, 2021-2033
- 10.1. Market Analysis, Insights and Forecast - by Product Type
- 10.1.1. Spectacles
- 10.1.2. Welding Protection Glasses
- 10.1.3. Overspecs
- 10.1.4. Goggles
- 10.2. Market Analysis, Insights and Forecast - by End-User Industry
- 10.2.1. Automotive
- 10.2.2. Construction
- 10.2.3. Food Industry
- 10.2.4. Pharmaceutical
- 10.2.5. Mining
- 10.2.6. Oil and Gas
- 10.2.7. Other End-User Industries
- 10.1. Market Analysis, Insights and Forecast - by Product Type
- 11. Middle East and Africa Protective Eye Wear Market Analysis, Insights and Forecast, 2021-2033
- 11.1. Market Analysis, Insights and Forecast - by Product Type
- 11.1.1. Spectacles
- 11.1.2. Welding Protection Glasses
- 11.1.3. Overspecs
- 11.1.4. Goggles
- 11.2. Market Analysis, Insights and Forecast - by End-User Industry
- 11.2.1. Automotive
- 11.2.2. Construction
- 11.2.3. Food Industry
- 11.2.4. Pharmaceutical
- 11.2.5. Mining
- 11.2.6. Oil and Gas
- 11.2.7. Other End-User Industries
- 11.1. Market Analysis, Insights and Forecast - by Product Type
- 12. Competitive Analysis
- 12.1. Company Profiles
- 12.1.1 Bolle Safety
- 12.1.1.1. Company Overview
- 12.1.1.2. Products
- 12.1.1.3. Company Financials
- 12.1.1.4. SWOT Analysis
- 12.1.2 Honeywell International Inc
- 12.1.2.1. Company Overview
- 12.1.2.2. Products
- 12.1.2.3. Company Financials
- 12.1.2.4. SWOT Analysis
- 12.1.3 Pyramex Safety Products LLC
- 12.1.3.1. Company Overview
- 12.1.3.2. Products
- 12.1.3.3. Company Financials
- 12.1.3.4. SWOT Analysis
- 12.1.4 Radians Inc
- 12.1.4.1. Company Overview
- 12.1.4.2. Products
- 12.1.4.3. Company Financials
- 12.1.4.4. SWOT Analysis
- 12.1.5 MCR Safety
- 12.1.5.1. Company Overview
- 12.1.5.2. Products
- 12.1.5.3. Company Financials
- 12.1.5.4. SWOT Analysis
- 12.1.6 uvex group
- 12.1.6.1. Company Overview
- 12.1.6.2. Products
- 12.1.6.3. Company Financials
- 12.1.6.4. SWOT Analysis
- 12.1.7 3M Company
- 12.1.7.1. Company Overview
- 12.1.7.2. Products
- 12.1.7.3. Company Financials
- 12.1.7.4. SWOT Analysis
- 12.1.8 Phillips Safety Products In
- 12.1.8.1. Company Overview
- 12.1.8.2. Products
- 12.1.8.3. Company Financials
- 12.1.8.4. SWOT Analysis
- 12.1.9 Gateway Safety Inc
- 12.1.9.1. Company Overview
- 12.1.9.2. Products
- 12.1.9.3. Company Financials
- 12.1.9.4. SWOT Analysis
- 12.1.10 SSP Eyewear
- 12.1.10.1. Company Overview
- 12.1.10.2. Products
- 12.1.10.3. Company Financials
- 12.1.10.4. SWOT Analysis
- 12.1.1 Bolle Safety
- 12.2. Market Entropy
- 12.2.1 Company's Key Areas Served
- 12.2.2 Recent Developments
- 12.3. Company Market Share Analysis 2025
- 12.3.1 Top 5 Companies Market Share Analysis
- 12.3.2 Top 3 Companies Market Share Analysis
- 12.4. List of Potential Customers
- 13. Research Methodology
List of Figures
- Figure 1: Global Protective Eye Wear Market Revenue Breakdown (billion, %) by Region 2025 & 2033
- Figure 2: Global Protective Eye Wear Market Volume Breakdown (K Units, %) by Region 2025 & 2033
- Figure 3: North America Protective Eye Wear Market Revenue (billion), by Product Type 2025 & 2033
- Figure 4: North America Protective Eye Wear Market Volume (K Units), by Product Type 2025 & 2033
- Figure 5: North America Protective Eye Wear Market Revenue Share (%), by Product Type 2025 & 2033
- Figure 6: North America Protective Eye Wear Market Volume Share (%), by Product Type 2025 & 2033
- Figure 7: North America Protective Eye Wear Market Revenue (billion), by End-User Industry 2025 & 2033
- Figure 8: North America Protective Eye Wear Market Volume (K Units), by End-User Industry 2025 & 2033
- Figure 9: North America Protective Eye Wear Market Revenue Share (%), by End-User Industry 2025 & 2033
- Figure 10: North America Protective Eye Wear Market Volume Share (%), by End-User Industry 2025 & 2033
- Figure 11: North America Protective Eye Wear Market Revenue (billion), by Country 2025 & 2033
- Figure 12: North America Protective Eye Wear Market Volume (K Units), by Country 2025 & 2033
- Figure 13: North America Protective Eye Wear Market Revenue Share (%), by Country 2025 & 2033
- Figure 14: North America Protective Eye Wear Market Volume Share (%), by Country 2025 & 2033
- Figure 15: Europe Protective Eye Wear Market Revenue (billion), by Product Type 2025 & 2033
- Figure 16: Europe Protective Eye Wear Market Volume (K Units), by Product Type 2025 & 2033
- Figure 17: Europe Protective Eye Wear Market Revenue Share (%), by Product Type 2025 & 2033
- Figure 18: Europe Protective Eye Wear Market Volume Share (%), by Product Type 2025 & 2033
- Figure 19: Europe Protective Eye Wear Market Revenue (billion), by End-User Industry 2025 & 2033
- Figure 20: Europe Protective Eye Wear Market Volume (K Units), by End-User Industry 2025 & 2033
- Figure 21: Europe Protective Eye Wear Market Revenue Share (%), by End-User Industry 2025 & 2033
- Figure 22: Europe Protective Eye Wear Market Volume Share (%), by End-User Industry 2025 & 2033
- Figure 23: Europe Protective Eye Wear Market Revenue (billion), by Country 2025 & 2033
- Figure 24: Europe Protective Eye Wear Market Volume (K Units), by Country 2025 & 2033
- Figure 25: Europe Protective Eye Wear Market Revenue Share (%), by Country 2025 & 2033
- Figure 26: Europe Protective Eye Wear Market Volume Share (%), by Country 2025 & 2033
- Figure 27: Asia Pacific Protective Eye Wear Market Revenue (billion), by Product Type 2025 & 2033
- Figure 28: Asia Pacific Protective Eye Wear Market Volume (K Units), by Product Type 2025 & 2033
- Figure 29: Asia Pacific Protective Eye Wear Market Revenue Share (%), by Product Type 2025 & 2033
- Figure 30: Asia Pacific Protective Eye Wear Market Volume Share (%), by Product Type 2025 & 2033
- Figure 31: Asia Pacific Protective Eye Wear Market Revenue (billion), by End-User Industry 2025 & 2033
- Figure 32: Asia Pacific Protective Eye Wear Market Volume (K Units), by End-User Industry 2025 & 2033
- Figure 33: Asia Pacific Protective Eye Wear Market Revenue Share (%), by End-User Industry 2025 & 2033
- Figure 34: Asia Pacific Protective Eye Wear Market Volume Share (%), by End-User Industry 2025 & 2033
- Figure 35: Asia Pacific Protective Eye Wear Market Revenue (billion), by Country 2025 & 2033
- Figure 36: Asia Pacific Protective Eye Wear Market Volume (K Units), by Country 2025 & 2033
- Figure 37: Asia Pacific Protective Eye Wear Market Revenue Share (%), by Country 2025 & 2033
- Figure 38: Asia Pacific Protective Eye Wear Market Volume Share (%), by Country 2025 & 2033
- Figure 39: South America Protective Eye Wear Market Revenue (billion), by Product Type 2025 & 2033
- Figure 40: South America Protective Eye Wear Market Volume (K Units), by Product Type 2025 & 2033
- Figure 41: South America Protective Eye Wear Market Revenue Share (%), by Product Type 2025 & 2033
- Figure 42: South America Protective Eye Wear Market Volume Share (%), by Product Type 2025 & 2033
- Figure 43: South America Protective Eye Wear Market Revenue (billion), by End-User Industry 2025 & 2033
- Figure 44: South America Protective Eye Wear Market Volume (K Units), by End-User Industry 2025 & 2033
- Figure 45: South America Protective Eye Wear Market Revenue Share (%), by End-User Industry 2025 & 2033
- Figure 46: South America Protective Eye Wear Market Volume Share (%), by End-User Industry 2025 & 2033
- Figure 47: South America Protective Eye Wear Market Revenue (billion), by Country 2025 & 2033
- Figure 48: South America Protective Eye Wear Market Volume (K Units), by Country 2025 & 2033
- Figure 49: South America Protective Eye Wear Market Revenue Share (%), by Country 2025 & 2033
- Figure 50: South America Protective Eye Wear Market Volume Share (%), by Country 2025 & 2033
- Figure 51: Middle East and Africa Protective Eye Wear Market Revenue (billion), by Product Type 2025 & 2033
- Figure 52: Middle East and Africa Protective Eye Wear Market Volume (K Units), by Product Type 2025 & 2033
- Figure 53: Middle East and Africa Protective Eye Wear Market Revenue Share (%), by Product Type 2025 & 2033
- Figure 54: Middle East and Africa Protective Eye Wear Market Volume Share (%), by Product Type 2025 & 2033
- Figure 55: Middle East and Africa Protective Eye Wear Market Revenue (billion), by End-User Industry 2025 & 2033
- Figure 56: Middle East and Africa Protective Eye Wear Market Volume (K Units), by End-User Industry 2025 & 2033
- Figure 57: Middle East and Africa Protective Eye Wear Market Revenue Share (%), by End-User Industry 2025 & 2033
- Figure 58: Middle East and Africa Protective Eye Wear Market Volume Share (%), by End-User Industry 2025 & 2033
- Figure 59: Middle East and Africa Protective Eye Wear Market Revenue (billion), by Country 2025 & 2033
- Figure 60: Middle East and Africa Protective Eye Wear Market Volume (K Units), by Country 2025 & 2033
- Figure 61: Middle East and Africa Protective Eye Wear Market Revenue Share (%), by Country 2025 & 2033
- Figure 62: Middle East and Africa Protective Eye Wear Market Volume Share (%), by Country 2025 & 2033
List of Tables
- Table 1: Global Protective Eye Wear Market Revenue billion Forecast, by Product Type 2020 & 2033
- Table 2: Global Protective Eye Wear Market Volume K Units Forecast, by Product Type 2020 & 2033
- Table 3: Global Protective Eye Wear Market Revenue billion Forecast, by End-User Industry 2020 & 2033
- Table 4: Global Protective Eye Wear Market Volume K Units Forecast, by End-User Industry 2020 & 2033
- Table 5: Global Protective Eye Wear Market Revenue billion Forecast, by Region 2020 & 2033
- Table 6: Global Protective Eye Wear Market Volume K Units Forecast, by Region 2020 & 2033
- Table 7: Global Protective Eye Wear Market Revenue billion Forecast, by Product Type 2020 & 2033
- Table 8: Global Protective Eye Wear Market Volume K Units Forecast, by Product Type 2020 & 2033
- Table 9: Global Protective Eye Wear Market Revenue billion Forecast, by End-User Industry 2020 & 2033
- Table 10: Global Protective Eye Wear Market Volume K Units Forecast, by End-User Industry 2020 & 2033
- Table 11: Global Protective Eye Wear Market Revenue billion Forecast, by Country 2020 & 2033
- Table 12: Global Protective Eye Wear Market Volume K Units Forecast, by Country 2020 & 2033
- Table 13: United States Protective Eye Wear Market Revenue (billion) Forecast, by Application 2020 & 2033
- Table 14: United States Protective Eye Wear Market Volume (K Units) Forecast, by Application 2020 & 2033
- Table 15: Canada Protective Eye Wear Market Revenue (billion) Forecast, by Application 2020 & 2033
- Table 16: Canada Protective Eye Wear Market Volume (K Units) Forecast, by Application 2020 & 2033
- Table 17: Mexico Protective Eye Wear Market Revenue (billion) Forecast, by Application 2020 & 2033
- Table 18: Mexico Protective Eye Wear Market Volume (K Units) Forecast, by Application 2020 & 2033
- Table 19: Rest of North America Protective Eye Wear Market Revenue (billion) Forecast, by Application 2020 & 2033
- Table 20: Rest of North America Protective Eye Wear Market Volume (K Units) Forecast, by Application 2020 & 2033
- Table 21: Global Protective Eye Wear Market Revenue billion Forecast, by Product Type 2020 & 2033
- Table 22: Global Protective Eye Wear Market Volume K Units Forecast, by Product Type 2020 & 2033
- Table 23: Global Protective Eye Wear Market Revenue billion Forecast, by End-User Industry 2020 & 2033
- Table 24: Global Protective Eye Wear Market Volume K Units Forecast, by End-User Industry 2020 & 2033
- Table 25: Global Protective Eye Wear Market Revenue billion Forecast, by Country 2020 & 2033
- Table 26: Global Protective Eye Wear Market Volume K Units Forecast, by Country 2020 & 2033
- Table 27: Spain Protective Eye Wear Market Revenue (billion) Forecast, by Application 2020 & 2033
- Table 28: Spain Protective Eye Wear Market Volume (K Units) Forecast, by Application 2020 & 2033
- Table 29: United Kingdom Protective Eye Wear Market Revenue (billion) Forecast, by Application 2020 & 2033
- Table 30: United Kingdom Protective Eye Wear Market Volume (K Units) Forecast, by Application 2020 & 2033
- Table 31: Germany Protective Eye Wear Market Revenue (billion) Forecast, by Application 2020 & 2033
- Table 32: Germany Protective Eye Wear Market Volume (K Units) Forecast, by Application 2020 & 2033
- Table 33: France Protective Eye Wear Market Revenue (billion) Forecast, by Application 2020 & 2033
- Table 34: France Protective Eye Wear Market Volume (K Units) Forecast, by Application 2020 & 2033
- Table 35: Italy Protective Eye Wear Market Revenue (billion) Forecast, by Application 2020 & 2033
- Table 36: Italy Protective Eye Wear Market Volume (K Units) Forecast, by Application 2020 & 2033
- Table 37: Russia Protective Eye Wear Market Revenue (billion) Forecast, by Application 2020 & 2033
- Table 38: Russia Protective Eye Wear Market Volume (K Units) Forecast, by Application 2020 & 2033
- Table 39: Rest of Europe Protective Eye Wear Market Revenue (billion) Forecast, by Application 2020 & 2033
- Table 40: Rest of Europe Protective Eye Wear Market Volume (K Units) Forecast, by Application 2020 & 2033
- Table 41: Global Protective Eye Wear Market Revenue billion Forecast, by Product Type 2020 & 2033
- Table 42: Global Protective Eye Wear Market Volume K Units Forecast, by Product Type 2020 & 2033
- Table 43: Global Protective Eye Wear Market Revenue billion Forecast, by End-User Industry 2020 & 2033
- Table 44: Global Protective Eye Wear Market Volume K Units Forecast, by End-User Industry 2020 & 2033
- Table 45: Global Protective Eye Wear Market Revenue billion Forecast, by Country 2020 & 2033
- Table 46: Global Protective Eye Wear Market Volume K Units Forecast, by Country 2020 & 2033
- Table 47: China Protective Eye Wear Market Revenue (billion) Forecast, by Application 2020 & 2033
- Table 48: China Protective Eye Wear Market Volume (K Units) Forecast, by Application 2020 & 2033
- Table 49: Japan Protective Eye Wear Market Revenue (billion) Forecast, by Application 2020 & 2033
- Table 50: Japan Protective Eye Wear Market Volume (K Units) Forecast, by Application 2020 & 2033
- Table 51: India Protective Eye Wear Market Revenue (billion) Forecast, by Application 2020 & 2033
- Table 52: India Protective Eye Wear Market Volume (K Units) Forecast, by Application 2020 & 2033
- Table 53: Australia Protective Eye Wear Market Revenue (billion) Forecast, by Application 2020 & 2033
- Table 54: Australia Protective Eye Wear Market Volume (K Units) Forecast, by Application 2020 & 2033
- Table 55: Rest of Asia Pacific Protective Eye Wear Market Revenue (billion) Forecast, by Application 2020 & 2033
- Table 56: Rest of Asia Pacific Protective Eye Wear Market Volume (K Units) Forecast, by Application 2020 & 2033
- Table 57: Global Protective Eye Wear Market Revenue billion Forecast, by Product Type 2020 & 2033
- Table 58: Global Protective Eye Wear Market Volume K Units Forecast, by Product Type 2020 & 2033
- Table 59: Global Protective Eye Wear Market Revenue billion Forecast, by End-User Industry 2020 & 2033
- Table 60: Global Protective Eye Wear Market Volume K Units Forecast, by End-User Industry 2020 & 2033
- Table 61: Global Protective Eye Wear Market Revenue billion Forecast, by Country 2020 & 2033
- Table 62: Global Protective Eye Wear Market Volume K Units Forecast, by Country 2020 & 2033
- Table 63: Brazil Protective Eye Wear Market Revenue (billion) Forecast, by Application 2020 & 2033
- Table 64: Brazil Protective Eye Wear Market Volume (K Units) Forecast, by Application 2020 & 2033
- Table 65: Argentina Protective Eye Wear Market Revenue (billion) Forecast, by Application 2020 & 2033
- Table 66: Argentina Protective Eye Wear Market Volume (K Units) Forecast, by Application 2020 & 2033
- Table 67: Rest of South America Protective Eye Wear Market Revenue (billion) Forecast, by Application 2020 & 2033
- Table 68: Rest of South America Protective Eye Wear Market Volume (K Units) Forecast, by Application 2020 & 2033
- Table 69: Global Protective Eye Wear Market Revenue billion Forecast, by Product Type 2020 & 2033
- Table 70: Global Protective Eye Wear Market Volume K Units Forecast, by Product Type 2020 & 2033
- Table 71: Global Protective Eye Wear Market Revenue billion Forecast, by End-User Industry 2020 & 2033
- Table 72: Global Protective Eye Wear Market Volume K Units Forecast, by End-User Industry 2020 & 2033
- Table 73: Global Protective Eye Wear Market Revenue billion Forecast, by Country 2020 & 2033
- Table 74: Global Protective Eye Wear Market Volume K Units Forecast, by Country 2020 & 2033
- Table 75: South Africa Protective Eye Wear Market Revenue (billion) Forecast, by Application 2020 & 2033
- Table 76: South Africa Protective Eye Wear Market Volume (K Units) Forecast, by Application 2020 & 2033
- Table 77: United Arab Emirates Protective Eye Wear Market Revenue (billion) Forecast, by Application 2020 & 2033
- Table 78: United Arab Emirates Protective Eye Wear Market Volume (K Units) Forecast, by Application 2020 & 2033
- Table 79: Rest of Middle East and Africa Protective Eye Wear Market Revenue (billion) Forecast, by Application 2020 & 2033
- Table 80: Rest of Middle East and Africa Protective Eye Wear Market Volume (K Units) Forecast, by Application 2020 & 2033
Frequently Asked Questions
1. What is the projected Compound Annual Growth Rate (CAGR) of the Protective Eye Wear Market?
The projected CAGR is approximately 4.54%.
2. Which companies are prominent players in the Protective Eye Wear Market?
Key companies in the market include Bolle Safety, Honeywell International Inc, Pyramex Safety Products LLC, Radians Inc, MCR Safety, uvex group, 3M Company, Phillips Safety Products In, Gateway Safety Inc, SSP Eyewear.
3. What are the main segments of the Protective Eye Wear Market?
The market segments include Product Type, End-User Industry.
4. Can you provide details about the market size?
The market size is estimated to be USD 4.38 billion as of 2022.
5. What are some drivers contributing to market growth?
Shift in Shopping Mode Preferences of the people; Increasing Urbanization; Growing Disposable Income.
6. What are the notable trends driving market growth?
Increasing Prevalence of Eye Injuries at Workplace.
7. Are there any restraints impacting market growth?
High-priced products and additional delivery charges; Inconsistency in product quality.
8. Can you provide examples of recent developments in the market?
October 2021: Uvex Group launched the Uvex i-range, an innovative safety eyewear for multiple applications. The products comprise 3 different varieties uvex i-lite, uvex i-guard, and uvex i-guard plus. The products are coated with UV 400 protection.
9. What pricing options are available for accessing the report?
Pricing options include single-user, multi-user, and enterprise licenses priced at USD 4750, USD 5250, and USD 8750 respectively.
10. Is the market size provided in terms of value or volume?
The market size is provided in terms of value, measured in billion and volume, measured in K Units.
11. Are there any specific market keywords associated with the report?
Yes, the market keyword associated with the report is "Protective Eye Wear Market," which aids in identifying and referencing the specific market segment covered.
12. How do I determine which pricing option suits my needs best?
The pricing options vary based on user requirements and access needs. Individual users may opt for single-user licenses, while businesses requiring broader access may choose multi-user or enterprise licenses for cost-effective access to the report.
13. Are there any additional resources or data provided in the Protective Eye Wear Market report?
While the report offers comprehensive insights, it's advisable to review the specific contents or supplementary materials provided to ascertain if additional resources or data are available.
14. How can I stay updated on further developments or reports in the Protective Eye Wear Market?
To stay informed about further developments, trends, and reports in the Protective Eye Wear Market, consider subscribing to industry newsletters, following relevant companies and organizations, or regularly checking reputable industry news sources and publications.
Methodology
Step 1 - Identification of Relevant Samples Size from Population Database


Step 2 - Approaches for Defining Global Market Size (Value, Volume* & Price*)

Note*: In applicable scenarios
Step 3 - Data Sources
Primary Research
- Web Analytics
- Survey Reports
- Research Institute
- Latest Research Reports
- Opinion Leaders
Secondary Research
- Annual Reports
- White Paper
- Latest Press Release
- Industry Association
- Paid Database
- Investor Presentations

Step 4 - Data Triangulation
Involves using different sources of information in order to increase the validity of a study
These sources are likely to be stakeholders in a program - participants, other researchers, program staff, other community members, and so on.
Then we put all data in single framework & apply various statistical tools to find out the dynamic on the market.
During the analysis stage, feedback from the stakeholder groups would be compared to determine areas of agreement as well as areas of divergence