

Key Insights
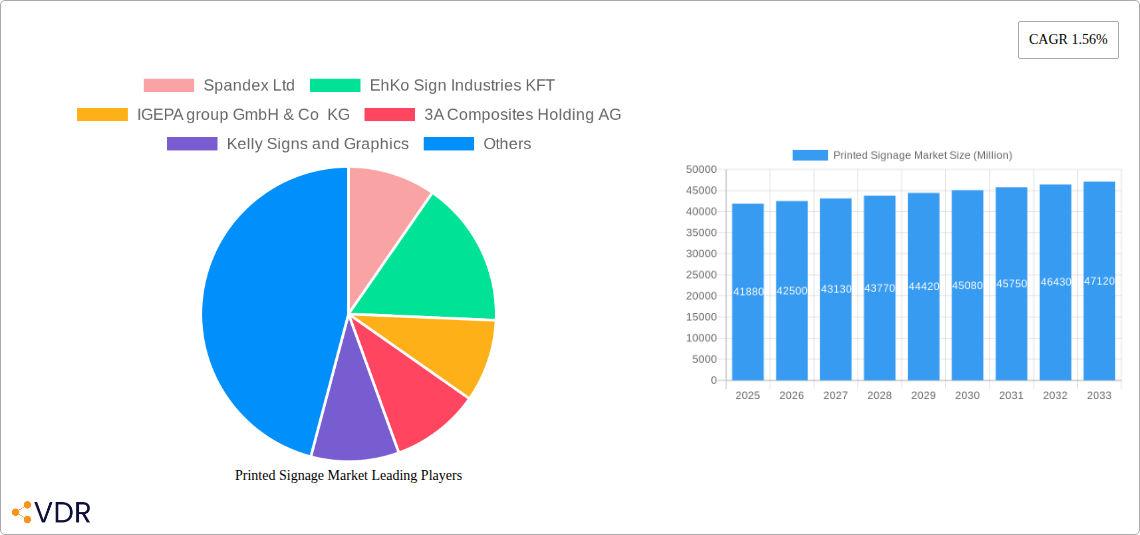
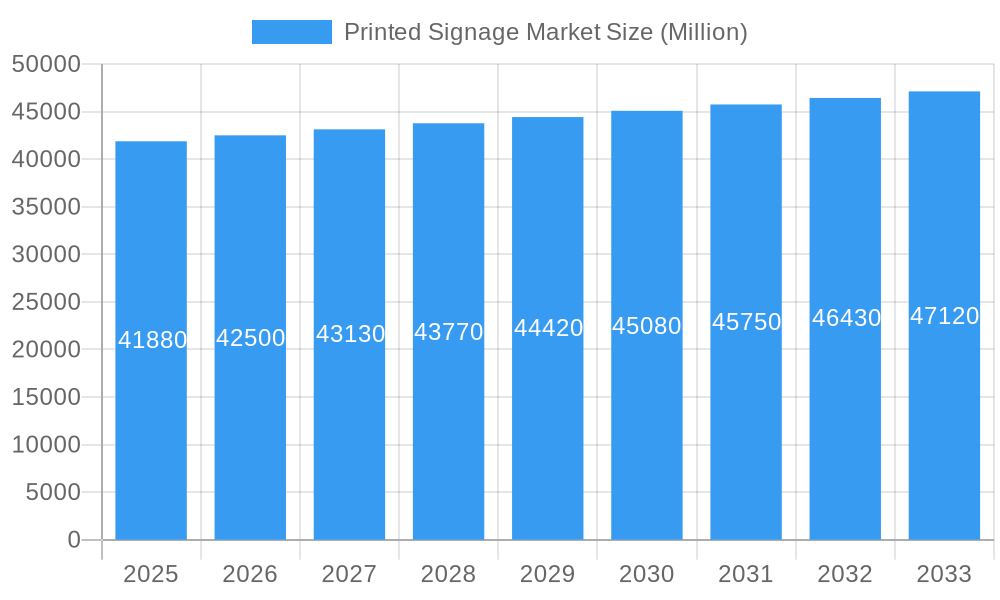
The global printed signage market, valued at $41.88 billion in 2025, is projected to experience steady growth, driven by the increasing adoption of digital printing technologies and the expanding retail and BFSI sectors. The market's Compound Annual Growth Rate (CAGR) of 1.56% reflects a moderate but consistent expansion, influenced by factors such as the rising demand for outdoor advertising, the preference for visually appealing brand communication, and the ongoing need for effective point-of-sale displays. Growth is further fueled by the diversification of signage types, including banner and backdrop displays, corporate graphics, exhibitions, and backlit displays. While traditional print methods like screen and inkjet printing remain dominant, the market is seeing a gradual shift towards more efficient and versatile sheetfed printing technology. Different end-user verticals contribute significantly, with Retail and BFSI leading the way, followed by Transportation and Logistics, and Healthcare. The market segmentation by application (indoor and outdoor) reflects varied needs in advertising and branding strategies. Geographic distribution shows strong presence across North America and Europe, with Asia exhibiting significant growth potential. This growth is expected to be fueled by rapid urbanization and economic development in regions like China and India.
Printed Signage Market Market Size (In Billion)
The market's moderate growth rate reflects a balance between several factors. While the increasing use of digital printing technologies offers opportunities for customization and efficiency, challenges remain in areas like sustainability concerns related to material waste and the ongoing competition from digital display solutions. Regulations concerning outdoor advertising also pose potential restraints in certain regions. However, continued innovation in materials, print technologies, and design will likely contribute to market expansion. The continued investment in creative and eye-catching signage solutions will be crucial for businesses to compete and engage consumers. Key players like Spandex Ltd, Avery Dennison Corporation, and 3A Composites Holding AG are actively involved in shaping the market through innovation and expansion. The forecast period of 2025-2033 anticipates a continuation of these trends, with regional variations based on economic growth and infrastructure development.
Printed Signage Market Company Market Share
Printed Signage Market: A Comprehensive Report (2019-2033)
This comprehensive report provides an in-depth analysis of the Printed Signage Market, encompassing market dynamics, growth trends, regional performance, product landscape, key players, and future outlook. The study period covers 2019-2033, with 2025 as the base and estimated year. The report segments the market by type (Banner & Backdrop, Corporate Graphics, Exhibitions & Trade Shows, Backlit Displays, Pop Displays, Billboards), print technology (Screen, Inkjet, Sheetfed), end-user vertical (BFSI, Retail, Transportation & Logistics, Healthcare), and application (Indoor, Outdoor). Key players analyzed include Spandex Ltd, EhKo Sign Industries KFT, IGEPA group GmbH & Co KG, 3A Composites Holding AG, Kelly Signs and Graphics, L&H Sign Company Inc, Mactac LLLC (Lintec), Lintec Corporation, Identity Group, Avery Dennison Corporation, Orafol Europe GmbH, and Signs Express. The report offers actionable insights for businesses and investors seeking to navigate this dynamic market.
Printed Signage Market Market Dynamics & Structure
The Printed Signage Market exhibits a moderately consolidated structure, with a few large players holding significant market share, alongside numerous smaller regional players. Market concentration is influenced by factors like technological advancements, economies of scale, and brand recognition. Technological innovation, primarily driven by advancements in printing technologies (e.g., inkjet, large-format printing), material science, and digital design tools, is a key driver. Regulatory frameworks, concerning environmental compliance (e.g., ink and material regulations) and advertising standards, impact market operations. Competitive product substitutes, such as digital signage and projection technologies, pose a challenge. End-user demographics, with businesses increasingly adopting printed signage for branding and marketing, influence market demand. Furthermore, M&A activity is prevalent, with recent acquisitions like Kuhn Corp's purchase of Regal Signs & Designs in February 2024, signifying consolidation and expansion.
- Market Concentration: Moderately consolidated, with top 5 players holding approximately xx% market share in 2025.
- Technological Innovation: Significant advancements in inkjet and large-format printing, driving higher quality and efficiency.
- Regulatory Framework: Compliance with environmental regulations and advertising standards influence operational costs.
- M&A Activity: xx deals in the past 5 years, indicating a consolidating market. The average deal value was approximately xx million units.
- Innovation Barriers: High initial investment for advanced printing technologies can limit entry of smaller players.
Printed Signage Market Growth Trends & Insights
The Printed Signage Market is experiencing steady growth, driven by the increasing demand for effective marketing and branding strategies across various sectors. The market size is projected to reach xx million units by 2033, exhibiting a CAGR of xx% during the forecast period (2025-2033). This growth reflects increasing adoption rates of printed signage across diverse end-user verticals, fueled by rising consumer spending and economic growth in key regions. Technological disruptions, particularly in digital printing technologies, have significantly improved print quality, reduced production time, and broadened the range of available materials. However, consumer behavior shifts towards digital media are presenting a notable challenge. Nonetheless, printed signage continues to offer advantages in terms of tangible presence and brand recall, thereby sustaining its market relevance.
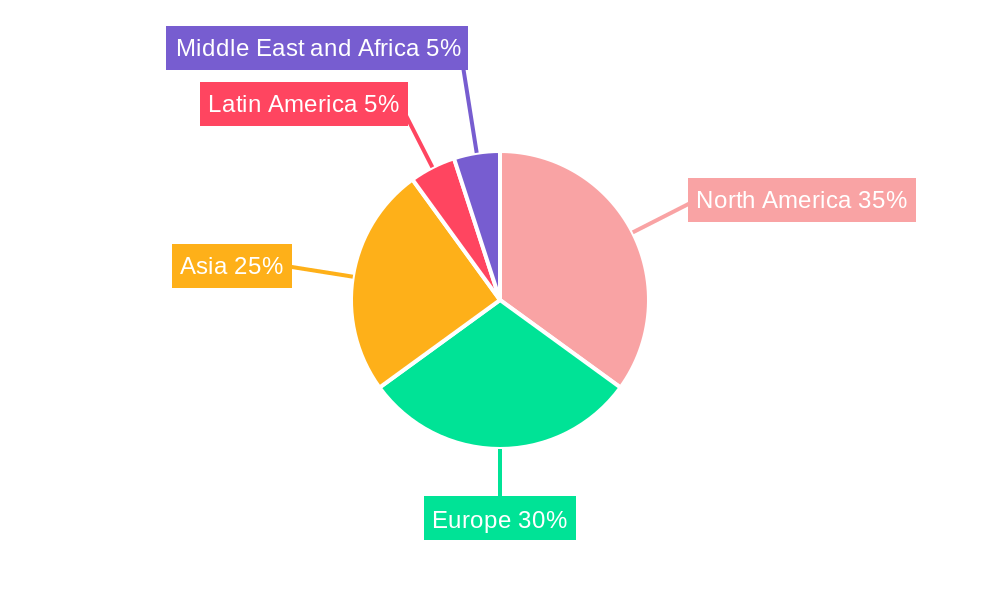
Dominant Regions, Countries, or Segments in Printed Signage Market
North America and Europe currently dominate the Printed Signage Market, driven by robust economies, well-established advertising industries, and high adoption rates of innovative signage technologies. Within these regions, major cities and metropolitan areas with high foot traffic and commercial activity are particularly strong markets. However, Asia-Pacific is exhibiting the fastest growth rate, driven by rapid urbanization, expanding retail sectors, and rising disposable incomes.
By Type: Banner and Backdrop remain the largest segment due to wide application across diverse industries. However, Corporate Graphics and Exhibitions & Trade Shows segments are witnessing robust growth, driven by increasing corporate event marketing expenditure.
By Print Technology: Inkjet printing is the dominant technology owing to versatility, cost-effectiveness, and high print quality.
By End-user Vertical: Retail is a leading vertical due to high demand for visual merchandising, followed by BFSI (Banking, Financial Services, and Insurance) for signage and wayfinding.
- North America: Strong market presence due to established advertising industries and high disposable incomes. xx% market share in 2025.
- Europe: High adoption of innovative signage technologies and large corporate event sector drives market growth. xx% market share in 2025.
- Asia-Pacific: Fastest-growing region with rapidly urbanizing cities and expanding retail sectors. xx% market share in 2025.
- Key Drivers: Economic growth, urbanization, rising consumer spending, and increasing corporate marketing budgets.
Printed Signage Market Product Landscape
The Printed Signage market offers a diverse range of products catering to varied applications and end-user needs. Product innovations focus on enhancing durability, weather resistance, and visual appeal. New materials, such as eco-friendly substrates and recyclable inks, are gaining traction, reflecting the growing focus on sustainability. Advancements in printing technologies enable higher resolution, more vibrant colors, and customized designs. Unique selling propositions include superior print quality, rapid turnaround times, and customized design solutions. The use of light-emitting diodes (LEDs) and backlit displays is also gaining traction within the market.
Key Drivers, Barriers & Challenges in Printed Signage Market
Key Drivers: Increasing demand for effective branding and marketing solutions, technological advancements in printing and material technologies, growth of the retail and hospitality sectors, and rising corporate spending on events and promotions.
Challenges: Competition from digital signage, fluctuating raw material prices, environmental concerns regarding material disposal, stringent regulations regarding outdoor advertising. The impact of these challenges is estimated to reduce market growth by approximately xx% in the coming years.
Emerging Opportunities in Printed Signage Market
Emerging opportunities are present in sustainable and eco-friendly signage solutions, personalized signage, and interactive signage integrating digital technology. Untapped markets in developing economies offer significant growth potential. Evolving consumer preferences towards personalized experiences drive demand for customized signage solutions. The integration of smart technology such as QR codes and NFC tags in signage creates further opportunities.
Growth Accelerators in the Printed Signage Market Industry
Long-term growth in the Printed Signage Market is anticipated through continuous technological innovation, strategic collaborations between print providers and advertising agencies, and expansion into new geographic markets. Investing in research and development to create sustainable and cost-effective signage solutions will be critical. Strategic partnerships allow companies to enhance their offerings and expand market reach. Furthermore, exploring new applications of printed signage, such as in the growing experiential marketing sector, offers significant growth potential.
Key Players Shaping the Printed Signage Market Market
- Spandex Ltd
- EhKo Sign Industries KFT
- IGEPA group GmbH & Co KG
- 3A Composites Holding AG
- Kelly Signs and Graphics
- L&H Sign Company Inc
- Mactac LLLC (Lintec)
- Lintec Corporation
- Identity Group
- Avery Dennison Corporation
- Orafol Europe GmbH
- Signs Express
Notable Milestones in Printed Signage Market Sector
- February 2024: Kuhn Corp Print & Packaging acquires Regal Signs & Designs, expanding its market presence.
- December 2023: Panther Premier Print Solutions acquires Advertising Arts, bolstering its custom signage capabilities.
- July 2023: Brother UK launches a multifunction printer enabling businesses to produce high-quality signage in-house.
In-Depth Printed Signage Market Market Outlook
The Printed Signage Market is poised for continued growth, driven by technological advancements, increasing marketing budgets, and the enduring appeal of physical branding. Strategic opportunities exist in sustainable materials, smart signage integration, and targeted marketing campaigns leveraging data analytics. The market’s future potential is vast, offering significant returns for companies that adapt to evolving consumer preferences and technological trends.
Printed Signage Market Segmentation
-
1. Type
- 1.1. Banner and Backdrop
- 1.2. Corporate Graphics, Exhibitions, and Trade Shows
- 1.3. Backlit Displays
- 1.4. Pop Display
- 1.5. Billboards
-
2. Print Technology
- 2.1. Screen
- 2.2. Inkjet
- 2.3. Sheetfed
-
3. End-user Vertical
- 3.1. BFSI
- 3.2. Retail
- 3.3. Transportation and Logistics
- 3.4. Healthcare
-
4. Application
- 4.1. Indoor
- 4.2. Outdoor
Printed Signage Market Segmentation By Geography
-
1. North America
- 1.1. United States
- 1.2. Canada
-
2. Europe
- 2.1. Germany
- 2.2. United Kingdom
- 2.3. France
- 2.4. Italy
-
3. Asia
- 3.1. China
- 3.2. India
- 3.3. Japan
- 3.4. South Korea
- 3.5. Thailand
- 3.6. Australia and New Zealand
-
4. Latin America
- 4.1. Brazil
- 4.2. Mexico
-
5. Middle East and Africa
- 5.1. United Arab Emirates
- 5.2. Saudi Arabia
- 5.3. South Africa
Printed Signage Market Regional Market Share
Geographic Coverage of Printed Signage Market
Printed Signage Market REPORT HIGHLIGHTS
| Aspects | Details |
|---|---|
| Study Period | 2020-2034 |
| Base Year | 2025 |
| Estimated Year | 2026 |
| Forecast Period | 2026-2034 |
| Historical Period | 2020-2025 |
| Growth Rate | CAGR of 1.56% from 2020-2034 |
| Segmentation |
|
Table of Contents
- 1. Introduction
- 1.1. Research Scope
- 1.2. Market Segmentation
- 1.3. Research Objective
- 1.4. Definitions and Assumptions
- 2. Executive Summary
- 2.1. Market Snapshot
- 3. Market Dynamics
- 3.1. Market Drivers
- 3.2. Market Restrains
- 3.3. Market Trends
- 3.4. Market Opportunities
- 4. Market Factor Analysis
- 4.1. Porters Five Forces
- 4.1.1. Bargaining Power of Suppliers
- 4.1.2. Bargaining Power of Buyers
- 4.1.3. Threat of New Entrants
- 4.1.4. Threat of Substitutes
- 4.1.5. Competitive Rivalry
- 4.2. PESTEL analysis
- 4.3. BCG Analysis
- 4.3.1. Stars (High Growth, High Market Share)
- 4.3.2. Cash Cows (Low Growth, High Market Share)
- 4.3.3. Question Mark (High Growth, Low Market Share)
- 4.3.4. Dogs (Low Growth, Low Market Share)
- 4.4. Ansoff Matrix Analysis
- 4.5. Supply Chain Analysis
- 4.6. Regulatory Landscape
- 4.7. Current Market Potential and Opportunity Assessment (TAM–SAM–SOM Framework)
- 4.8. VDR Analyst Note
- 4.1. Porters Five Forces
- 5. Market Analysis, Insights and Forecast 2021-2033
- 5.1. Market Analysis, Insights and Forecast - by Type
- 5.1.1. Banner and Backdrop
- 5.1.2. Corporate Graphics, Exhibitions, and Trade Shows
- 5.1.3. Backlit Displays
- 5.1.4. Pop Display
- 5.1.5. Billboards
- 5.2. Market Analysis, Insights and Forecast - by Print Technology
- 5.2.1. Screen
- 5.2.2. Inkjet
- 5.2.3. Sheetfed
- 5.3. Market Analysis, Insights and Forecast - by End-user Vertical
- 5.3.1. BFSI
- 5.3.2. Retail
- 5.3.3. Transportation and Logistics
- 5.3.4. Healthcare
- 5.4. Market Analysis, Insights and Forecast - by Application
- 5.4.1. Indoor
- 5.4.2. Outdoor
- 5.5. Market Analysis, Insights and Forecast - by Region
- 5.5.1. North America
- 5.5.2. Europe
- 5.5.3. Asia
- 5.5.4. Latin America
- 5.5.5. Middle East and Africa
- 5.1. Market Analysis, Insights and Forecast - by Type
- 6. Global Printed Signage Market Analysis, Insights and Forecast, 2021-2033
- 6.1. Market Analysis, Insights and Forecast - by Type
- 6.1.1. Banner and Backdrop
- 6.1.2. Corporate Graphics, Exhibitions, and Trade Shows
- 6.1.3. Backlit Displays
- 6.1.4. Pop Display
- 6.1.5. Billboards
- 6.2. Market Analysis, Insights and Forecast - by Print Technology
- 6.2.1. Screen
- 6.2.2. Inkjet
- 6.2.3. Sheetfed
- 6.3. Market Analysis, Insights and Forecast - by End-user Vertical
- 6.3.1. BFSI
- 6.3.2. Retail
- 6.3.3. Transportation and Logistics
- 6.3.4. Healthcare
- 6.4. Market Analysis, Insights and Forecast - by Application
- 6.4.1. Indoor
- 6.4.2. Outdoor
- 6.1. Market Analysis, Insights and Forecast - by Type
- 7. North America Printed Signage Market Analysis, Insights and Forecast, 2021-2033
- 7.1. Market Analysis, Insights and Forecast - by Type
- 7.1.1. Banner and Backdrop
- 7.1.2. Corporate Graphics, Exhibitions, and Trade Shows
- 7.1.3. Backlit Displays
- 7.1.4. Pop Display
- 7.1.5. Billboards
- 7.2. Market Analysis, Insights and Forecast - by Print Technology
- 7.2.1. Screen
- 7.2.2. Inkjet
- 7.2.3. Sheetfed
- 7.3. Market Analysis, Insights and Forecast - by End-user Vertical
- 7.3.1. BFSI
- 7.3.2. Retail
- 7.3.3. Transportation and Logistics
- 7.3.4. Healthcare
- 7.4. Market Analysis, Insights and Forecast - by Application
- 7.4.1. Indoor
- 7.4.2. Outdoor
- 7.1. Market Analysis, Insights and Forecast - by Type
- 8. Europe Printed Signage Market Analysis, Insights and Forecast, 2021-2033
- 8.1. Market Analysis, Insights and Forecast - by Type
- 8.1.1. Banner and Backdrop
- 8.1.2. Corporate Graphics, Exhibitions, and Trade Shows
- 8.1.3. Backlit Displays
- 8.1.4. Pop Display
- 8.1.5. Billboards
- 8.2. Market Analysis, Insights and Forecast - by Print Technology
- 8.2.1. Screen
- 8.2.2. Inkjet
- 8.2.3. Sheetfed
- 8.3. Market Analysis, Insights and Forecast - by End-user Vertical
- 8.3.1. BFSI
- 8.3.2. Retail
- 8.3.3. Transportation and Logistics
- 8.3.4. Healthcare
- 8.4. Market Analysis, Insights and Forecast - by Application
- 8.4.1. Indoor
- 8.4.2. Outdoor
- 8.1. Market Analysis, Insights and Forecast - by Type
- 9. Asia Printed Signage Market Analysis, Insights and Forecast, 2021-2033
- 9.1. Market Analysis, Insights and Forecast - by Type
- 9.1.1. Banner and Backdrop
- 9.1.2. Corporate Graphics, Exhibitions, and Trade Shows
- 9.1.3. Backlit Displays
- 9.1.4. Pop Display
- 9.1.5. Billboards
- 9.2. Market Analysis, Insights and Forecast - by Print Technology
- 9.2.1. Screen
- 9.2.2. Inkjet
- 9.2.3. Sheetfed
- 9.3. Market Analysis, Insights and Forecast - by End-user Vertical
- 9.3.1. BFSI
- 9.3.2. Retail
- 9.3.3. Transportation and Logistics
- 9.3.4. Healthcare
- 9.4. Market Analysis, Insights and Forecast - by Application
- 9.4.1. Indoor
- 9.4.2. Outdoor
- 9.1. Market Analysis, Insights and Forecast - by Type
- 10. Latin America Printed Signage Market Analysis, Insights and Forecast, 2021-2033
- 10.1. Market Analysis, Insights and Forecast - by Type
- 10.1.1. Banner and Backdrop
- 10.1.2. Corporate Graphics, Exhibitions, and Trade Shows
- 10.1.3. Backlit Displays
- 10.1.4. Pop Display
- 10.1.5. Billboards
- 10.2. Market Analysis, Insights and Forecast - by Print Technology
- 10.2.1. Screen
- 10.2.2. Inkjet
- 10.2.3. Sheetfed
- 10.3. Market Analysis, Insights and Forecast - by End-user Vertical
- 10.3.1. BFSI
- 10.3.2. Retail
- 10.3.3. Transportation and Logistics
- 10.3.4. Healthcare
- 10.4. Market Analysis, Insights and Forecast - by Application
- 10.4.1. Indoor
- 10.4.2. Outdoor
- 10.1. Market Analysis, Insights and Forecast - by Type
- 11. Middle East and Africa Printed Signage Market Analysis, Insights and Forecast, 2021-2033
- 11.1. Market Analysis, Insights and Forecast - by Type
- 11.1.1. Banner and Backdrop
- 11.1.2. Corporate Graphics, Exhibitions, and Trade Shows
- 11.1.3. Backlit Displays
- 11.1.4. Pop Display
- 11.1.5. Billboards
- 11.2. Market Analysis, Insights and Forecast - by Print Technology
- 11.2.1. Screen
- 11.2.2. Inkjet
- 11.2.3. Sheetfed
- 11.3. Market Analysis, Insights and Forecast - by End-user Vertical
- 11.3.1. BFSI
- 11.3.2. Retail
- 11.3.3. Transportation and Logistics
- 11.3.4. Healthcare
- 11.4. Market Analysis, Insights and Forecast - by Application
- 11.4.1. Indoor
- 11.4.2. Outdoor
- 11.1. Market Analysis, Insights and Forecast - by Type
- 12. Competitive Analysis
- 12.1. Company Profiles
- 12.1.1 Spandex Ltd
- 12.1.1.1. Company Overview
- 12.1.1.2. Products
- 12.1.1.3. Company Financials
- 12.1.1.4. SWOT Analysis
- 12.1.2 EhKo Sign Industries KFT
- 12.1.2.1. Company Overview
- 12.1.2.2. Products
- 12.1.2.3. Company Financials
- 12.1.2.4. SWOT Analysis
- 12.1.3 IGEPA group GmbH & Co KG
- 12.1.3.1. Company Overview
- 12.1.3.2. Products
- 12.1.3.3. Company Financials
- 12.1.3.4. SWOT Analysis
- 12.1.4 3A Composites Holding AG
- 12.1.4.1. Company Overview
- 12.1.4.2. Products
- 12.1.4.3. Company Financials
- 12.1.4.4. SWOT Analysis
- 12.1.5 Kelly Signs and Graphics
- 12.1.5.1. Company Overview
- 12.1.5.2. Products
- 12.1.5.3. Company Financials
- 12.1.5.4. SWOT Analysis
- 12.1.6 L&H Sign Company Inc
- 12.1.6.1. Company Overview
- 12.1.6.2. Products
- 12.1.6.3. Company Financials
- 12.1.6.4. SWOT Analysis
- 12.1.7 Mactac LLLC (Lintec)
- 12.1.7.1. Company Overview
- 12.1.7.2. Products
- 12.1.7.3. Company Financials
- 12.1.7.4. SWOT Analysis
- 12.1.8 Lintec Corporation
- 12.1.8.1. Company Overview
- 12.1.8.2. Products
- 12.1.8.3. Company Financials
- 12.1.8.4. SWOT Analysis
- 12.1.9 Identity Group
- 12.1.9.1. Company Overview
- 12.1.9.2. Products
- 12.1.9.3. Company Financials
- 12.1.9.4. SWOT Analysis
- 12.1.10 Avery Dennison Corporation
- 12.1.10.1. Company Overview
- 12.1.10.2. Products
- 12.1.10.3. Company Financials
- 12.1.10.4. SWOT Analysis
- 12.1.11 Orafol Europe GmbH
- 12.1.11.1. Company Overview
- 12.1.11.2. Products
- 12.1.11.3. Company Financials
- 12.1.11.4. SWOT Analysis
- 12.1.12 Signs Express
- 12.1.12.1. Company Overview
- 12.1.12.2. Products
- 12.1.12.3. Company Financials
- 12.1.12.4. SWOT Analysis
- 12.1.1 Spandex Ltd
- 12.2. Market Entropy
- 12.2.1 Company's Key Areas Served
- 12.2.2 Recent Developments
- 12.3. Company Market Share Analysis 2025
- 12.3.1 Top 5 Companies Market Share Analysis
- 12.3.2 Top 3 Companies Market Share Analysis
- 12.4. List of Potential Customers
- 13. Research Methodology
List of Figures
- Figure 1: Global Printed Signage Market Revenue Breakdown (Million, %) by Region 2025 & 2033
- Figure 2: North America Printed Signage Market Revenue (Million), by Type 2025 & 2033
- Figure 3: North America Printed Signage Market Revenue Share (%), by Type 2025 & 2033
- Figure 4: North America Printed Signage Market Revenue (Million), by Print Technology 2025 & 2033
- Figure 5: North America Printed Signage Market Revenue Share (%), by Print Technology 2025 & 2033
- Figure 6: North America Printed Signage Market Revenue (Million), by End-user Vertical 2025 & 2033
- Figure 7: North America Printed Signage Market Revenue Share (%), by End-user Vertical 2025 & 2033
- Figure 8: North America Printed Signage Market Revenue (Million), by Application 2025 & 2033
- Figure 9: North America Printed Signage Market Revenue Share (%), by Application 2025 & 2033
- Figure 10: North America Printed Signage Market Revenue (Million), by Country 2025 & 2033
- Figure 11: North America Printed Signage Market Revenue Share (%), by Country 2025 & 2033
- Figure 12: Europe Printed Signage Market Revenue (Million), by Type 2025 & 2033
- Figure 13: Europe Printed Signage Market Revenue Share (%), by Type 2025 & 2033
- Figure 14: Europe Printed Signage Market Revenue (Million), by Print Technology 2025 & 2033
- Figure 15: Europe Printed Signage Market Revenue Share (%), by Print Technology 2025 & 2033
- Figure 16: Europe Printed Signage Market Revenue (Million), by End-user Vertical 2025 & 2033
- Figure 17: Europe Printed Signage Market Revenue Share (%), by End-user Vertical 2025 & 2033
- Figure 18: Europe Printed Signage Market Revenue (Million), by Application 2025 & 2033
- Figure 19: Europe Printed Signage Market Revenue Share (%), by Application 2025 & 2033
- Figure 20: Europe Printed Signage Market Revenue (Million), by Country 2025 & 2033
- Figure 21: Europe Printed Signage Market Revenue Share (%), by Country 2025 & 2033
- Figure 22: Asia Printed Signage Market Revenue (Million), by Type 2025 & 2033
- Figure 23: Asia Printed Signage Market Revenue Share (%), by Type 2025 & 2033
- Figure 24: Asia Printed Signage Market Revenue (Million), by Print Technology 2025 & 2033
- Figure 25: Asia Printed Signage Market Revenue Share (%), by Print Technology 2025 & 2033
- Figure 26: Asia Printed Signage Market Revenue (Million), by End-user Vertical 2025 & 2033
- Figure 27: Asia Printed Signage Market Revenue Share (%), by End-user Vertical 2025 & 2033
- Figure 28: Asia Printed Signage Market Revenue (Million), by Application 2025 & 2033
- Figure 29: Asia Printed Signage Market Revenue Share (%), by Application 2025 & 2033
- Figure 30: Asia Printed Signage Market Revenue (Million), by Country 2025 & 2033
- Figure 31: Asia Printed Signage Market Revenue Share (%), by Country 2025 & 2033
- Figure 32: Latin America Printed Signage Market Revenue (Million), by Type 2025 & 2033
- Figure 33: Latin America Printed Signage Market Revenue Share (%), by Type 2025 & 2033
- Figure 34: Latin America Printed Signage Market Revenue (Million), by Print Technology 2025 & 2033
- Figure 35: Latin America Printed Signage Market Revenue Share (%), by Print Technology 2025 & 2033
- Figure 36: Latin America Printed Signage Market Revenue (Million), by End-user Vertical 2025 & 2033
- Figure 37: Latin America Printed Signage Market Revenue Share (%), by End-user Vertical 2025 & 2033
- Figure 38: Latin America Printed Signage Market Revenue (Million), by Application 2025 & 2033
- Figure 39: Latin America Printed Signage Market Revenue Share (%), by Application 2025 & 2033
- Figure 40: Latin America Printed Signage Market Revenue (Million), by Country 2025 & 2033
- Figure 41: Latin America Printed Signage Market Revenue Share (%), by Country 2025 & 2033
- Figure 42: Middle East and Africa Printed Signage Market Revenue (Million), by Type 2025 & 2033
- Figure 43: Middle East and Africa Printed Signage Market Revenue Share (%), by Type 2025 & 2033
- Figure 44: Middle East and Africa Printed Signage Market Revenue (Million), by Print Technology 2025 & 2033
- Figure 45: Middle East and Africa Printed Signage Market Revenue Share (%), by Print Technology 2025 & 2033
- Figure 46: Middle East and Africa Printed Signage Market Revenue (Million), by End-user Vertical 2025 & 2033
- Figure 47: Middle East and Africa Printed Signage Market Revenue Share (%), by End-user Vertical 2025 & 2033
- Figure 48: Middle East and Africa Printed Signage Market Revenue (Million), by Application 2025 & 2033
- Figure 49: Middle East and Africa Printed Signage Market Revenue Share (%), by Application 2025 & 2033
- Figure 50: Middle East and Africa Printed Signage Market Revenue (Million), by Country 2025 & 2033
- Figure 51: Middle East and Africa Printed Signage Market Revenue Share (%), by Country 2025 & 2033
List of Tables
- Table 1: Global Printed Signage Market Revenue Million Forecast, by Type 2020 & 2033
- Table 2: Global Printed Signage Market Revenue Million Forecast, by Print Technology 2020 & 2033
- Table 3: Global Printed Signage Market Revenue Million Forecast, by End-user Vertical 2020 & 2033
- Table 4: Global Printed Signage Market Revenue Million Forecast, by Application 2020 & 2033
- Table 5: Global Printed Signage Market Revenue Million Forecast, by Region 2020 & 2033
- Table 6: Global Printed Signage Market Revenue Million Forecast, by Type 2020 & 2033
- Table 7: Global Printed Signage Market Revenue Million Forecast, by Print Technology 2020 & 2033
- Table 8: Global Printed Signage Market Revenue Million Forecast, by End-user Vertical 2020 & 2033
- Table 9: Global Printed Signage Market Revenue Million Forecast, by Application 2020 & 2033
- Table 10: Global Printed Signage Market Revenue Million Forecast, by Country 2020 & 2033
- Table 11: United States Printed Signage Market Revenue (Million) Forecast, by Application 2020 & 2033
- Table 12: Canada Printed Signage Market Revenue (Million) Forecast, by Application 2020 & 2033
- Table 13: Global Printed Signage Market Revenue Million Forecast, by Type 2020 & 2033
- Table 14: Global Printed Signage Market Revenue Million Forecast, by Print Technology 2020 & 2033
- Table 15: Global Printed Signage Market Revenue Million Forecast, by End-user Vertical 2020 & 2033
- Table 16: Global Printed Signage Market Revenue Million Forecast, by Application 2020 & 2033
- Table 17: Global Printed Signage Market Revenue Million Forecast, by Country 2020 & 2033
- Table 18: Germany Printed Signage Market Revenue (Million) Forecast, by Application 2020 & 2033
- Table 19: United Kingdom Printed Signage Market Revenue (Million) Forecast, by Application 2020 & 2033
- Table 20: France Printed Signage Market Revenue (Million) Forecast, by Application 2020 & 2033
- Table 21: Italy Printed Signage Market Revenue (Million) Forecast, by Application 2020 & 2033
- Table 22: Global Printed Signage Market Revenue Million Forecast, by Type 2020 & 2033
- Table 23: Global Printed Signage Market Revenue Million Forecast, by Print Technology 2020 & 2033
- Table 24: Global Printed Signage Market Revenue Million Forecast, by End-user Vertical 2020 & 2033
- Table 25: Global Printed Signage Market Revenue Million Forecast, by Application 2020 & 2033
- Table 26: Global Printed Signage Market Revenue Million Forecast, by Country 2020 & 2033
- Table 27: China Printed Signage Market Revenue (Million) Forecast, by Application 2020 & 2033
- Table 28: India Printed Signage Market Revenue (Million) Forecast, by Application 2020 & 2033
- Table 29: Japan Printed Signage Market Revenue (Million) Forecast, by Application 2020 & 2033
- Table 30: South Korea Printed Signage Market Revenue (Million) Forecast, by Application 2020 & 2033
- Table 31: Thailand Printed Signage Market Revenue (Million) Forecast, by Application 2020 & 2033
- Table 32: Australia and New Zealand Printed Signage Market Revenue (Million) Forecast, by Application 2020 & 2033
- Table 33: Global Printed Signage Market Revenue Million Forecast, by Type 2020 & 2033
- Table 34: Global Printed Signage Market Revenue Million Forecast, by Print Technology 2020 & 2033
- Table 35: Global Printed Signage Market Revenue Million Forecast, by End-user Vertical 2020 & 2033
- Table 36: Global Printed Signage Market Revenue Million Forecast, by Application 2020 & 2033
- Table 37: Global Printed Signage Market Revenue Million Forecast, by Country 2020 & 2033
- Table 38: Brazil Printed Signage Market Revenue (Million) Forecast, by Application 2020 & 2033
- Table 39: Mexico Printed Signage Market Revenue (Million) Forecast, by Application 2020 & 2033
- Table 40: Global Printed Signage Market Revenue Million Forecast, by Type 2020 & 2033
- Table 41: Global Printed Signage Market Revenue Million Forecast, by Print Technology 2020 & 2033
- Table 42: Global Printed Signage Market Revenue Million Forecast, by End-user Vertical 2020 & 2033
- Table 43: Global Printed Signage Market Revenue Million Forecast, by Application 2020 & 2033
- Table 44: Global Printed Signage Market Revenue Million Forecast, by Country 2020 & 2033
- Table 45: United Arab Emirates Printed Signage Market Revenue (Million) Forecast, by Application 2020 & 2033
- Table 46: Saudi Arabia Printed Signage Market Revenue (Million) Forecast, by Application 2020 & 2033
- Table 47: South Africa Printed Signage Market Revenue (Million) Forecast, by Application 2020 & 2033
Frequently Asked Questions
1. What is the projected Compound Annual Growth Rate (CAGR) of the Printed Signage Market?
The projected CAGR is approximately 1.56%.
2. Which companies are prominent players in the Printed Signage Market?
Key companies in the market include Spandex Ltd, EhKo Sign Industries KFT, IGEPA group GmbH & Co KG, 3A Composites Holding AG, Kelly Signs and Graphics, L&H Sign Company Inc, Mactac LLLC (Lintec), Lintec Corporation, Identity Group, Avery Dennison Corporation, Orafol Europe GmbH, Signs Express.
3. What are the main segments of the Printed Signage Market?
The market segments include Type, Print Technology, End-user Vertical, Application.
4. Can you provide details about the market size?
The market size is estimated to be USD 41.88 Million as of 2022.
5. What are some drivers contributing to market growth?
Cost Effectiveness of Printed Signage; Inclination of the Retail Industry Toward the Application of Printed Signage.
6. What are the notable trends driving market growth?
The Retail Sector Expected to Grow at a Significant Rate.
7. Are there any restraints impacting market growth?
High Competition from the Digital Signage Segment.
8. Can you provide examples of recent developments in the market?
February 2024: Kuhn Corp Print & Packaging strategically moved to fortify its position in the sign and display sector by successfully acquiring Regal Signs & Designs from its original owners. This acquisition is in line with Kuhn's commitment to expanding its signage operations and meeting growing customer demand, and it signifies a period of strategic growth for the company.
9. What pricing options are available for accessing the report?
Pricing options include single-user, multi-user, and enterprise licenses priced at USD 4750, USD 5250, and USD 8750 respectively.
10. Is the market size provided in terms of value or volume?
The market size is provided in terms of value, measured in Million.
11. Are there any specific market keywords associated with the report?
Yes, the market keyword associated with the report is "Printed Signage Market," which aids in identifying and referencing the specific market segment covered.
12. How do I determine which pricing option suits my needs best?
The pricing options vary based on user requirements and access needs. Individual users may opt for single-user licenses, while businesses requiring broader access may choose multi-user or enterprise licenses for cost-effective access to the report.
13. Are there any additional resources or data provided in the Printed Signage Market report?
While the report offers comprehensive insights, it's advisable to review the specific contents or supplementary materials provided to ascertain if additional resources or data are available.
14. How can I stay updated on further developments or reports in the Printed Signage Market?
To stay informed about further developments, trends, and reports in the Printed Signage Market, consider subscribing to industry newsletters, following relevant companies and organizations, or regularly checking reputable industry news sources and publications.
Methodology
Step 1 - Identification of Relevant Samples Size from Population Database


Step 2 - Approaches for Defining Global Market Size (Value, Volume* & Price*)

Note*: In applicable scenarios
Step 3 - Data Sources
Primary Research
- Web Analytics
- Survey Reports
- Research Institute
- Latest Research Reports
- Opinion Leaders
Secondary Research
- Annual Reports
- White Paper
- Latest Press Release
- Industry Association
- Paid Database
- Investor Presentations

Step 4 - Data Triangulation
Involves using different sources of information in order to increase the validity of a study
These sources are likely to be stakeholders in a program - participants, other researchers, program staff, other community members, and so on.
Then we put all data in single framework & apply various statistical tools to find out the dynamic on the market.
During the analysis stage, feedback from the stakeholder groups would be compared to determine areas of agreement as well as areas of divergence