

Key Insights
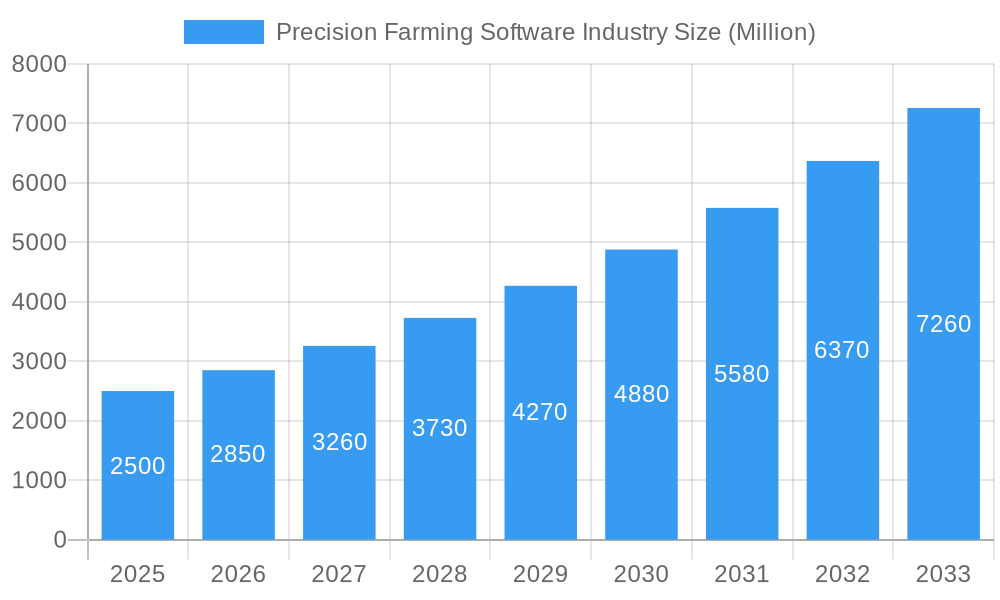
The precision farming software market is poised for substantial expansion, driven by the increasing imperative for efficient and sustainable agricultural operations. With a projected compound annual growth rate (CAGR) of 13.9%, the market size is estimated to reach $2.7 billion by 2025. This growth trajectory is underpinned by several key catalysts. The integration of advanced technologies, including GPS, sensors, and IoT devices, empowers farmers with real-time data crucial for informed decision-making regarding soil health, crop vitality, and environmental conditions. Concurrently, the escalating demand for enhanced crop yields and reduced operational expenses incentivizes the adoption of precision farming methodologies. Furthermore, supportive government policies promoting sustainable agriculture and ongoing technological innovation are significant growth accelerators. Market segmentation analysis indicates robust performance across diverse applications such as crop management, financial oversight, and farm inventory control, with cloud-based solutions increasingly favored over on-premise installations due to their accessibility and scalability. Leading industry players are driving innovation and market penetration, fostering a competitive environment that propels market development. Geographic expansion is also a notable trend, with North America and Europe currently dominating market share, while the Asia Pacific region is anticipated to experience considerable growth driven by evolving agricultural practices and rising technological adoption in emerging economies. Notwithstanding these positive trends, the market faces challenges including significant initial investment requirements and the necessity for reliable rural internet infrastructure.
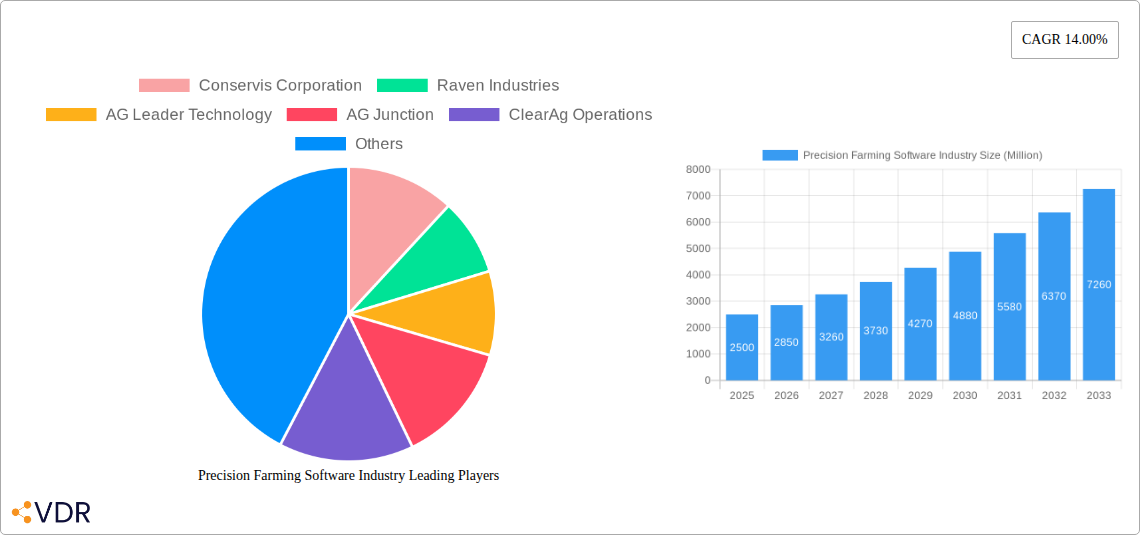
Precision Farming Software Industry Market Size (In Billion)
The future outlook for the precision farming software market is highly promising, propelled by continuous technological advancements, particularly in artificial intelligence and machine learning, which are set to deliver further operational efficiencies for agricultural producers. The synergistic integration of precision farming software with emerging agricultural technologies, such as autonomous vehicles and robotics, is expected to fundamentally transform farming methodologies. The ongoing development of intuitive user interfaces and cost-effective software solutions will likely broaden market accessibility, especially for smallholder farmers. Moreover, the heightened emphasis on data security and privacy within the agricultural sector will shape market evolution and stimulate demand for secure and resilient software platforms. Consequently, the precision farming software market represents a compelling investment and stakeholder opportunity, offering considerable potential for innovation and growth in the foreseeable future.
Precision Farming Software Industry Company Market Share
Precision Farming Software Industry Market Report: 2019-2033
This comprehensive report provides an in-depth analysis of the Precision Farming Software market, encompassing market dynamics, growth trends, regional analysis, competitive landscape, and future outlook. The study period covers 2019-2033, with 2025 as the base and estimated year, and a forecast period of 2025-2033. The report segments the market by application (Crop Management, Financial Management, Farm Inventory Management, Personnel Management, Weather Tracking and Forecasting, Other Applications) and type (Local/Web-based, Cloud-based), offering granular insights into this rapidly evolving sector. The market is valued at xx Million in 2025 and is projected to reach xx Million by 2033.
Precision Farming Software Industry Market Dynamics & Structure
The Precision Farming Software market exhibits a moderately concentrated structure, with key players like Deere & Company, Trimble Inc., and Raven Industries holding significant market share. Technological innovation, particularly in AI and IoT integration, is a major driver, alongside increasing government support for digital agriculture and stricter regulatory frameworks promoting sustainable farming practices. The market faces competition from traditional farm management methods, but the superior efficiency and data-driven insights offered by precision farming software are increasingly compelling farmers to adopt these solutions. Mergers and acquisitions (M&A) activity is moderately high, with larger players acquiring smaller companies to expand their product portfolios and geographic reach. The estimated M&A deal volume for the period 2019-2024 was approximately xx deals.
- Market Concentration: Moderately concentrated, with top 5 players holding approximately xx% market share in 2025.
- Technological Drivers: AI, IoT, Big Data analytics, cloud computing.
- Regulatory Landscape: Increasing regulations favoring sustainable practices boost adoption.
- Competitive Substitutes: Traditional farm management methods.
- End-User Demographics: Primarily large-scale commercial farms, with increasing adoption by smaller farms.
- M&A Trends: Moderate activity, focused on expansion of product offerings and geographic reach.
Precision Farming Software Industry Growth Trends & Insights
The Precision Farming Software market experienced robust growth during the historical period (2019-2024), driven by increasing farm sizes, rising demand for higher yields, and the growing adoption of precision technologies. The market size expanded from xx Million in 2019 to xx Million in 2024, registering a CAGR of xx%. This growth is expected to continue throughout the forecast period (2025-2033), with the market projected to reach xx Million by 2033, exhibiting a CAGR of xx%. Technological disruptions, such as the increasing availability of affordable sensors and advanced analytics capabilities, are accelerating market penetration. Furthermore, changing consumer behavior, with a growing preference for sustainably produced food, fuels demand for efficient and data-driven farming practices. Adoption rates are highest in developed regions, but developing economies are witnessing rapid growth due to government initiatives and increasing farmer awareness.
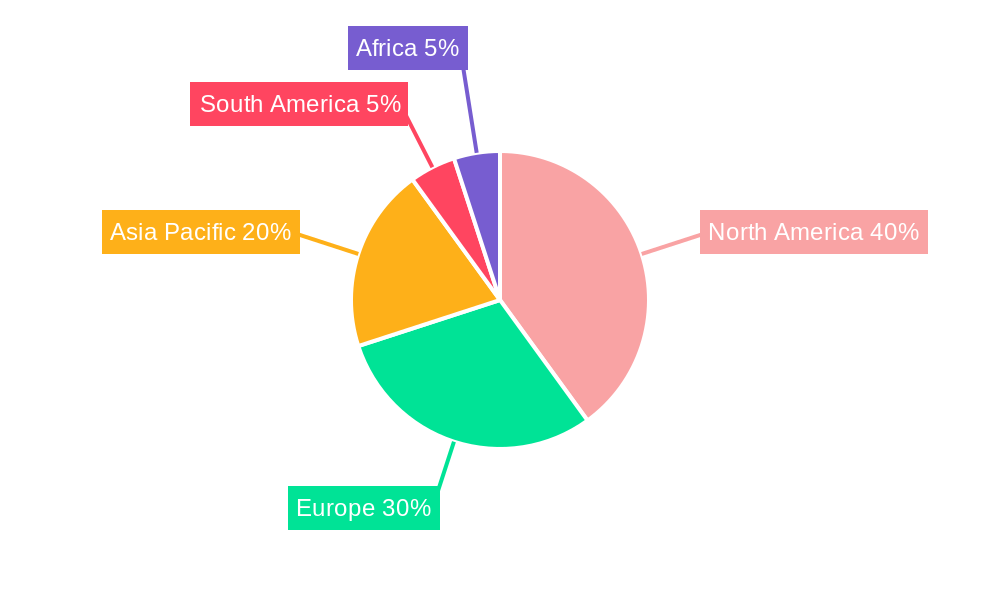
Dominant Regions, Countries, or Segments in Precision Farming Software Industry
North America currently dominates the Precision Farming Software market, driven by high technology adoption rates, well-established agricultural infrastructure, and the presence of major players. Europe follows as a significant market, propelled by government policies supporting sustainable agriculture and precision farming initiatives. Within application segments, Crop Management accounts for the largest market share, followed by Farm Inventory Management. Cloud-based solutions are witnessing faster growth than local/web-based solutions due to scalability and accessibility.
- Key Drivers in North America: High technology adoption, strong agricultural infrastructure, significant player presence.
- Key Drivers in Europe: Government support for sustainable agriculture, precision farming initiatives.
- Dominant Application Segment: Crop Management (xx% market share in 2025).
- Dominant Type Segment: Cloud-based solutions (xx% market share in 2025).
- Growth Potential: Significant growth expected in developing regions like Asia-Pacific and Latin America.
Precision Farming Software Industry Product Landscape
Precision farming software solutions are increasingly sophisticated, incorporating advanced analytics, AI-powered decision support, and seamless integration with various farm equipment and sensors. These solutions offer features like real-time data visualization, predictive modeling, automated irrigation control, and optimized fertilizer application. Unique selling propositions (USPs) include improved yield, reduced input costs, enhanced sustainability, and data-driven insights to optimize farm operations. The market is characterized by continuous technological advancements, with frequent updates and the introduction of new modules and features.
Key Drivers, Barriers & Challenges in Precision Farming Software Industry
Key Drivers:
- Increased demand for higher yields and efficiency.
- Growing adoption of precision technologies.
- Government support for digital agriculture.
- Technological advancements in AI, IoT, and big data analytics.
Key Challenges:
- High initial investment costs for farmers.
- Lack of digital literacy among some farmers.
- Data security and privacy concerns.
- Interoperability issues between different software platforms. This leads to an estimated xx% reduction in efficiency for farmers utilizing multiple, incompatible systems.
Emerging Opportunities in Precision Farming Software Industry
- Expansion into developing markets with high agricultural potential.
- Integration of blockchain technology for supply chain traceability.
- Development of AI-powered predictive models for disease and pest management.
- Personalized solutions tailored to specific crop types and farming practices.
Growth Accelerators in the Precision Farming Software Industry
Strategic partnerships between software providers and agricultural equipment manufacturers are accelerating market growth by creating integrated solutions. Technological breakthroughs in areas such as AI-powered image recognition and sensor technology are driving innovation and market expansion. The expansion into emerging markets with large-scale farming operations also presents significant opportunities for growth.
Key Players Shaping the Precision Farming Software Market
- Conservis Corporation
- Raven Industries
- AG Leader Technology
- AG Junction
- ClearAg Operations
- Deere & Company
- Fairport Farm Software
- AG DNA
- Topcon Positioning Systems
- Trimble Inc
- Bayer CropScience AG
- Agribotix
- Case IH Agriculture
- Mapshots Inc
- IBM
- AGCO Corporation
Notable Milestones in Precision Farming Software Industry Sector
- 2020: Deere & Company launched its new precision farming platform, integrating various data sources.
- 2021: Trimble Inc. acquired a leading provider of farm management software, expanding its product portfolio.
- 2022: Several key players introduced AI-powered features to their software, enhancing decision-making capabilities.
- 2023: Significant investments in research and development for next-generation precision farming software.
In-Depth Precision Farming Software Industry Market Outlook
The Precision Farming Software market is poised for continued strong growth, driven by technological innovation, increasing adoption rates, and the growing need for efficient and sustainable agricultural practices. Strategic partnerships, expansion into new markets, and the development of advanced analytics capabilities will be key drivers of future market potential. The market presents significant opportunities for companies to innovate and capture market share in this rapidly evolving sector.
Precision Farming Software Industry Segmentation
-
1. Application
- 1.1. Crop Management
- 1.2. Financial Management
- 1.3. Farm Inventory Management
- 1.4. Personnel Management
- 1.5. Weather Tracking and Forecasting
- 1.6. Other Applications
-
2. Type
- 2.1. Local or Web-based
- 2.2. Cloud-based
-
3. Application
- 3.1. Crop Management
- 3.2. Financial Management
- 3.3. Farm Inventory Management
- 3.4. Personnel Management
- 3.5. Weather Tracking and Forecasting
- 3.6. Other Applications
-
4. Type
- 4.1. Local or Web-based
- 4.2. Cloud-based
Precision Farming Software Industry Segmentation By Geography
-
1. North America
- 1.1. United States
- 1.2. Canada
- 1.3. Mexico
- 1.4. Rest of North America
-
2. Europe
- 2.1. Germany
- 2.2. United Kingdom
- 2.3. France
- 2.4. Italy
- 2.5. Spain
- 2.6. Rest of Europe
-
3. Asia Pacific
- 3.1. China
- 3.2. Japan
- 3.3. India
- 3.4. Australia
- 3.5. Rest of Asia Pacific
-
4. South America
- 4.1. Brazil
- 4.2. Argentina
- 4.3. Rest of South America
-
5. Africa
- 5.1. South Africa
- 5.2. Rest of Africa
Precision Farming Software Industry Regional Market Share
Geographic Coverage of Precision Farming Software Industry
Precision Farming Software Industry REPORT HIGHLIGHTS
| Aspects | Details |
|---|---|
| Study Period | 2020-2034 |
| Base Year | 2025 |
| Estimated Year | 2026 |
| Forecast Period | 2026-2034 |
| Historical Period | 2020-2025 |
| Growth Rate | CAGR of 13.9% from 2020-2034 |
| Segmentation |
|
Table of Contents
- 1. Introduction
- 1.1. Research Scope
- 1.2. Market Segmentation
- 1.3. Research Objective
- 1.4. Definitions and Assumptions
- 2. Executive Summary
- 2.1. Market Snapshot
- 3. Market Dynamics
- 3.1. Market Drivers
- 3.2. Market Restrains
- 3.3. Market Trends
- 3.4. Market Opportunities
- 4. Market Factor Analysis
- 4.1. Porters Five Forces
- 4.1.1. Bargaining Power of Suppliers
- 4.1.2. Bargaining Power of Buyers
- 4.1.3. Threat of New Entrants
- 4.1.4. Threat of Substitutes
- 4.1.5. Competitive Rivalry
- 4.2. PESTEL analysis
- 4.3. BCG Analysis
- 4.3.1. Stars (High Growth, High Market Share)
- 4.3.2. Cash Cows (Low Growth, High Market Share)
- 4.3.3. Question Mark (High Growth, Low Market Share)
- 4.3.4. Dogs (Low Growth, Low Market Share)
- 4.4. Ansoff Matrix Analysis
- 4.5. Supply Chain Analysis
- 4.6. Regulatory Landscape
- 4.7. Current Market Potential and Opportunity Assessment (TAM–SAM–SOM Framework)
- 4.8. VDR Analyst Note
- 4.1. Porters Five Forces
- 5. Market Analysis, Insights and Forecast 2021-2033
- 5.1. Market Analysis, Insights and Forecast - by Application
- 5.1.1. Crop Management
- 5.1.2. Financial Management
- 5.1.3. Farm Inventory Management
- 5.1.4. Personnel Management
- 5.1.5. Weather Tracking and Forecasting
- 5.1.6. Other Applications
- 5.2. Market Analysis, Insights and Forecast - by Type
- 5.2.1. Local or Web-based
- 5.2.2. Cloud-based
- 5.3. Market Analysis, Insights and Forecast - by Application
- 5.3.1. Crop Management
- 5.3.2. Financial Management
- 5.3.3. Farm Inventory Management
- 5.3.4. Personnel Management
- 5.3.5. Weather Tracking and Forecasting
- 5.3.6. Other Applications
- 5.4. Market Analysis, Insights and Forecast - by Type
- 5.4.1. Local or Web-based
- 5.4.2. Cloud-based
- 5.5. Market Analysis, Insights and Forecast - by Region
- 5.5.1. North America
- 5.5.2. Europe
- 5.5.3. Asia Pacific
- 5.5.4. South America
- 5.5.5. Africa
- 5.1. Market Analysis, Insights and Forecast - by Application
- 6. Global Precision Farming Software Industry Analysis, Insights and Forecast, 2021-2033
- 6.1. Market Analysis, Insights and Forecast - by Application
- 6.1.1. Crop Management
- 6.1.2. Financial Management
- 6.1.3. Farm Inventory Management
- 6.1.4. Personnel Management
- 6.1.5. Weather Tracking and Forecasting
- 6.1.6. Other Applications
- 6.2. Market Analysis, Insights and Forecast - by Type
- 6.2.1. Local or Web-based
- 6.2.2. Cloud-based
- 6.3. Market Analysis, Insights and Forecast - by Application
- 6.3.1. Crop Management
- 6.3.2. Financial Management
- 6.3.3. Farm Inventory Management
- 6.3.4. Personnel Management
- 6.3.5. Weather Tracking and Forecasting
- 6.3.6. Other Applications
- 6.4. Market Analysis, Insights and Forecast - by Type
- 6.4.1. Local or Web-based
- 6.4.2. Cloud-based
- 6.1. Market Analysis, Insights and Forecast - by Application
- 7. North America Precision Farming Software Industry Analysis, Insights and Forecast, 2021-2033
- 7.1. Market Analysis, Insights and Forecast - by Application
- 7.1.1. Crop Management
- 7.1.2. Financial Management
- 7.1.3. Farm Inventory Management
- 7.1.4. Personnel Management
- 7.1.5. Weather Tracking and Forecasting
- 7.1.6. Other Applications
- 7.2. Market Analysis, Insights and Forecast - by Type
- 7.2.1. Local or Web-based
- 7.2.2. Cloud-based
- 7.3. Market Analysis, Insights and Forecast - by Application
- 7.3.1. Crop Management
- 7.3.2. Financial Management
- 7.3.3. Farm Inventory Management
- 7.3.4. Personnel Management
- 7.3.5. Weather Tracking and Forecasting
- 7.3.6. Other Applications
- 7.4. Market Analysis, Insights and Forecast - by Type
- 7.4.1. Local or Web-based
- 7.4.2. Cloud-based
- 7.1. Market Analysis, Insights and Forecast - by Application
- 8. Europe Precision Farming Software Industry Analysis, Insights and Forecast, 2021-2033
- 8.1. Market Analysis, Insights and Forecast - by Application
- 8.1.1. Crop Management
- 8.1.2. Financial Management
- 8.1.3. Farm Inventory Management
- 8.1.4. Personnel Management
- 8.1.5. Weather Tracking and Forecasting
- 8.1.6. Other Applications
- 8.2. Market Analysis, Insights and Forecast - by Type
- 8.2.1. Local or Web-based
- 8.2.2. Cloud-based
- 8.3. Market Analysis, Insights and Forecast - by Application
- 8.3.1. Crop Management
- 8.3.2. Financial Management
- 8.3.3. Farm Inventory Management
- 8.3.4. Personnel Management
- 8.3.5. Weather Tracking and Forecasting
- 8.3.6. Other Applications
- 8.4. Market Analysis, Insights and Forecast - by Type
- 8.4.1. Local or Web-based
- 8.4.2. Cloud-based
- 8.1. Market Analysis, Insights and Forecast - by Application
- 9. Asia Pacific Precision Farming Software Industry Analysis, Insights and Forecast, 2021-2033
- 9.1. Market Analysis, Insights and Forecast - by Application
- 9.1.1. Crop Management
- 9.1.2. Financial Management
- 9.1.3. Farm Inventory Management
- 9.1.4. Personnel Management
- 9.1.5. Weather Tracking and Forecasting
- 9.1.6. Other Applications
- 9.2. Market Analysis, Insights and Forecast - by Type
- 9.2.1. Local or Web-based
- 9.2.2. Cloud-based
- 9.3. Market Analysis, Insights and Forecast - by Application
- 9.3.1. Crop Management
- 9.3.2. Financial Management
- 9.3.3. Farm Inventory Management
- 9.3.4. Personnel Management
- 9.3.5. Weather Tracking and Forecasting
- 9.3.6. Other Applications
- 9.4. Market Analysis, Insights and Forecast - by Type
- 9.4.1. Local or Web-based
- 9.4.2. Cloud-based
- 9.1. Market Analysis, Insights and Forecast - by Application
- 10. South America Precision Farming Software Industry Analysis, Insights and Forecast, 2021-2033
- 10.1. Market Analysis, Insights and Forecast - by Application
- 10.1.1. Crop Management
- 10.1.2. Financial Management
- 10.1.3. Farm Inventory Management
- 10.1.4. Personnel Management
- 10.1.5. Weather Tracking and Forecasting
- 10.1.6. Other Applications
- 10.2. Market Analysis, Insights and Forecast - by Type
- 10.2.1. Local or Web-based
- 10.2.2. Cloud-based
- 10.3. Market Analysis, Insights and Forecast - by Application
- 10.3.1. Crop Management
- 10.3.2. Financial Management
- 10.3.3. Farm Inventory Management
- 10.3.4. Personnel Management
- 10.3.5. Weather Tracking and Forecasting
- 10.3.6. Other Applications
- 10.4. Market Analysis, Insights and Forecast - by Type
- 10.4.1. Local or Web-based
- 10.4.2. Cloud-based
- 10.1. Market Analysis, Insights and Forecast - by Application
- 11. Africa Precision Farming Software Industry Analysis, Insights and Forecast, 2021-2033
- 11.1. Market Analysis, Insights and Forecast - by Application
- 11.1.1. Crop Management
- 11.1.2. Financial Management
- 11.1.3. Farm Inventory Management
- 11.1.4. Personnel Management
- 11.1.5. Weather Tracking and Forecasting
- 11.1.6. Other Applications
- 11.2. Market Analysis, Insights and Forecast - by Type
- 11.2.1. Local or Web-based
- 11.2.2. Cloud-based
- 11.3. Market Analysis, Insights and Forecast - by Application
- 11.3.1. Crop Management
- 11.3.2. Financial Management
- 11.3.3. Farm Inventory Management
- 11.3.4. Personnel Management
- 11.3.5. Weather Tracking and Forecasting
- 11.3.6. Other Applications
- 11.4. Market Analysis, Insights and Forecast - by Type
- 11.4.1. Local or Web-based
- 11.4.2. Cloud-based
- 11.1. Market Analysis, Insights and Forecast - by Application
- 12. Competitive Analysis
- 12.1. Company Profiles
- 12.1.1 Conservis Corporation
- 12.1.1.1. Company Overview
- 12.1.1.2. Products
- 12.1.1.3. Company Financials
- 12.1.1.4. SWOT Analysis
- 12.1.2 Raven Industries
- 12.1.2.1. Company Overview
- 12.1.2.2. Products
- 12.1.2.3. Company Financials
- 12.1.2.4. SWOT Analysis
- 12.1.3 AG Leader Technology
- 12.1.3.1. Company Overview
- 12.1.3.2. Products
- 12.1.3.3. Company Financials
- 12.1.3.4. SWOT Analysis
- 12.1.4 AG Junction
- 12.1.4.1. Company Overview
- 12.1.4.2. Products
- 12.1.4.3. Company Financials
- 12.1.4.4. SWOT Analysis
- 12.1.5 ClearAg Operations
- 12.1.5.1. Company Overview
- 12.1.5.2. Products
- 12.1.5.3. Company Financials
- 12.1.5.4. SWOT Analysis
- 12.1.6 Deere & Company
- 12.1.6.1. Company Overview
- 12.1.6.2. Products
- 12.1.6.3. Company Financials
- 12.1.6.4. SWOT Analysis
- 12.1.7 Fairport Farm Software
- 12.1.7.1. Company Overview
- 12.1.7.2. Products
- 12.1.7.3. Company Financials
- 12.1.7.4. SWOT Analysis
- 12.1.8 AG DNA
- 12.1.8.1. Company Overview
- 12.1.8.2. Products
- 12.1.8.3. Company Financials
- 12.1.8.4. SWOT Analysis
- 12.1.9 Topcon Positioning Systems
- 12.1.9.1. Company Overview
- 12.1.9.2. Products
- 12.1.9.3. Company Financials
- 12.1.9.4. SWOT Analysis
- 12.1.10 Trimble Inc
- 12.1.10.1. Company Overview
- 12.1.10.2. Products
- 12.1.10.3. Company Financials
- 12.1.10.4. SWOT Analysis
- 12.1.11 Bayer CropScience AG
- 12.1.11.1. Company Overview
- 12.1.11.2. Products
- 12.1.11.3. Company Financials
- 12.1.11.4. SWOT Analysis
- 12.1.12 Agribotix
- 12.1.12.1. Company Overview
- 12.1.12.2. Products
- 12.1.12.3. Company Financials
- 12.1.12.4. SWOT Analysis
- 12.1.13 Case IH Agriculture
- 12.1.13.1. Company Overview
- 12.1.13.2. Products
- 12.1.13.3. Company Financials
- 12.1.13.4. SWOT Analysis
- 12.1.14 Mapshots Inc
- 12.1.14.1. Company Overview
- 12.1.14.2. Products
- 12.1.14.3. Company Financials
- 12.1.14.4. SWOT Analysis
- 12.1.15 IBM
- 12.1.15.1. Company Overview
- 12.1.15.2. Products
- 12.1.15.3. Company Financials
- 12.1.15.4. SWOT Analysis
- 12.1.16 AGCO Corporation
- 12.1.16.1. Company Overview
- 12.1.16.2. Products
- 12.1.16.3. Company Financials
- 12.1.16.4. SWOT Analysis
- 12.1.1 Conservis Corporation
- 12.2. Market Entropy
- 12.2.1 Company's Key Areas Served
- 12.2.2 Recent Developments
- 12.3. Company Market Share Analysis 2025
- 12.3.1 Top 5 Companies Market Share Analysis
- 12.3.2 Top 3 Companies Market Share Analysis
- 12.4. List of Potential Customers
- 13. Research Methodology
List of Figures
- Figure 1: Global Precision Farming Software Industry Revenue Breakdown (billion, %) by Region 2025 & 2033
- Figure 2: North America Precision Farming Software Industry Revenue (billion), by Application 2025 & 2033
- Figure 3: North America Precision Farming Software Industry Revenue Share (%), by Application 2025 & 2033
- Figure 4: North America Precision Farming Software Industry Revenue (billion), by Type 2025 & 2033
- Figure 5: North America Precision Farming Software Industry Revenue Share (%), by Type 2025 & 2033
- Figure 6: North America Precision Farming Software Industry Revenue (billion), by Application 2025 & 2033
- Figure 7: North America Precision Farming Software Industry Revenue Share (%), by Application 2025 & 2033
- Figure 8: North America Precision Farming Software Industry Revenue (billion), by Type 2025 & 2033
- Figure 9: North America Precision Farming Software Industry Revenue Share (%), by Type 2025 & 2033
- Figure 10: North America Precision Farming Software Industry Revenue (billion), by Country 2025 & 2033
- Figure 11: North America Precision Farming Software Industry Revenue Share (%), by Country 2025 & 2033
- Figure 12: Europe Precision Farming Software Industry Revenue (billion), by Application 2025 & 2033
- Figure 13: Europe Precision Farming Software Industry Revenue Share (%), by Application 2025 & 2033
- Figure 14: Europe Precision Farming Software Industry Revenue (billion), by Type 2025 & 2033
- Figure 15: Europe Precision Farming Software Industry Revenue Share (%), by Type 2025 & 2033
- Figure 16: Europe Precision Farming Software Industry Revenue (billion), by Application 2025 & 2033
- Figure 17: Europe Precision Farming Software Industry Revenue Share (%), by Application 2025 & 2033
- Figure 18: Europe Precision Farming Software Industry Revenue (billion), by Type 2025 & 2033
- Figure 19: Europe Precision Farming Software Industry Revenue Share (%), by Type 2025 & 2033
- Figure 20: Europe Precision Farming Software Industry Revenue (billion), by Country 2025 & 2033
- Figure 21: Europe Precision Farming Software Industry Revenue Share (%), by Country 2025 & 2033
- Figure 22: Asia Pacific Precision Farming Software Industry Revenue (billion), by Application 2025 & 2033
- Figure 23: Asia Pacific Precision Farming Software Industry Revenue Share (%), by Application 2025 & 2033
- Figure 24: Asia Pacific Precision Farming Software Industry Revenue (billion), by Type 2025 & 2033
- Figure 25: Asia Pacific Precision Farming Software Industry Revenue Share (%), by Type 2025 & 2033
- Figure 26: Asia Pacific Precision Farming Software Industry Revenue (billion), by Application 2025 & 2033
- Figure 27: Asia Pacific Precision Farming Software Industry Revenue Share (%), by Application 2025 & 2033
- Figure 28: Asia Pacific Precision Farming Software Industry Revenue (billion), by Type 2025 & 2033
- Figure 29: Asia Pacific Precision Farming Software Industry Revenue Share (%), by Type 2025 & 2033
- Figure 30: Asia Pacific Precision Farming Software Industry Revenue (billion), by Country 2025 & 2033
- Figure 31: Asia Pacific Precision Farming Software Industry Revenue Share (%), by Country 2025 & 2033
- Figure 32: South America Precision Farming Software Industry Revenue (billion), by Application 2025 & 2033
- Figure 33: South America Precision Farming Software Industry Revenue Share (%), by Application 2025 & 2033
- Figure 34: South America Precision Farming Software Industry Revenue (billion), by Type 2025 & 2033
- Figure 35: South America Precision Farming Software Industry Revenue Share (%), by Type 2025 & 2033
- Figure 36: South America Precision Farming Software Industry Revenue (billion), by Application 2025 & 2033
- Figure 37: South America Precision Farming Software Industry Revenue Share (%), by Application 2025 & 2033
- Figure 38: South America Precision Farming Software Industry Revenue (billion), by Type 2025 & 2033
- Figure 39: South America Precision Farming Software Industry Revenue Share (%), by Type 2025 & 2033
- Figure 40: South America Precision Farming Software Industry Revenue (billion), by Country 2025 & 2033
- Figure 41: South America Precision Farming Software Industry Revenue Share (%), by Country 2025 & 2033
- Figure 42: Africa Precision Farming Software Industry Revenue (billion), by Application 2025 & 2033
- Figure 43: Africa Precision Farming Software Industry Revenue Share (%), by Application 2025 & 2033
- Figure 44: Africa Precision Farming Software Industry Revenue (billion), by Type 2025 & 2033
- Figure 45: Africa Precision Farming Software Industry Revenue Share (%), by Type 2025 & 2033
- Figure 46: Africa Precision Farming Software Industry Revenue (billion), by Application 2025 & 2033
- Figure 47: Africa Precision Farming Software Industry Revenue Share (%), by Application 2025 & 2033
- Figure 48: Africa Precision Farming Software Industry Revenue (billion), by Type 2025 & 2033
- Figure 49: Africa Precision Farming Software Industry Revenue Share (%), by Type 2025 & 2033
- Figure 50: Africa Precision Farming Software Industry Revenue (billion), by Country 2025 & 2033
- Figure 51: Africa Precision Farming Software Industry Revenue Share (%), by Country 2025 & 2033
List of Tables
- Table 1: Global Precision Farming Software Industry Revenue billion Forecast, by Application 2020 & 2033
- Table 2: Global Precision Farming Software Industry Revenue billion Forecast, by Type 2020 & 2033
- Table 3: Global Precision Farming Software Industry Revenue billion Forecast, by Application 2020 & 2033
- Table 4: Global Precision Farming Software Industry Revenue billion Forecast, by Type 2020 & 2033
- Table 5: Global Precision Farming Software Industry Revenue billion Forecast, by Region 2020 & 2033
- Table 6: Global Precision Farming Software Industry Revenue billion Forecast, by Application 2020 & 2033
- Table 7: Global Precision Farming Software Industry Revenue billion Forecast, by Type 2020 & 2033
- Table 8: Global Precision Farming Software Industry Revenue billion Forecast, by Application 2020 & 2033
- Table 9: Global Precision Farming Software Industry Revenue billion Forecast, by Type 2020 & 2033
- Table 10: Global Precision Farming Software Industry Revenue billion Forecast, by Country 2020 & 2033
- Table 11: United States Precision Farming Software Industry Revenue (billion) Forecast, by Application 2020 & 2033
- Table 12: Canada Precision Farming Software Industry Revenue (billion) Forecast, by Application 2020 & 2033
- Table 13: Mexico Precision Farming Software Industry Revenue (billion) Forecast, by Application 2020 & 2033
- Table 14: Rest of North America Precision Farming Software Industry Revenue (billion) Forecast, by Application 2020 & 2033
- Table 15: Global Precision Farming Software Industry Revenue billion Forecast, by Application 2020 & 2033
- Table 16: Global Precision Farming Software Industry Revenue billion Forecast, by Type 2020 & 2033
- Table 17: Global Precision Farming Software Industry Revenue billion Forecast, by Application 2020 & 2033
- Table 18: Global Precision Farming Software Industry Revenue billion Forecast, by Type 2020 & 2033
- Table 19: Global Precision Farming Software Industry Revenue billion Forecast, by Country 2020 & 2033
- Table 20: Germany Precision Farming Software Industry Revenue (billion) Forecast, by Application 2020 & 2033
- Table 21: United Kingdom Precision Farming Software Industry Revenue (billion) Forecast, by Application 2020 & 2033
- Table 22: France Precision Farming Software Industry Revenue (billion) Forecast, by Application 2020 & 2033
- Table 23: Italy Precision Farming Software Industry Revenue (billion) Forecast, by Application 2020 & 2033
- Table 24: Spain Precision Farming Software Industry Revenue (billion) Forecast, by Application 2020 & 2033
- Table 25: Rest of Europe Precision Farming Software Industry Revenue (billion) Forecast, by Application 2020 & 2033
- Table 26: Global Precision Farming Software Industry Revenue billion Forecast, by Application 2020 & 2033
- Table 27: Global Precision Farming Software Industry Revenue billion Forecast, by Type 2020 & 2033
- Table 28: Global Precision Farming Software Industry Revenue billion Forecast, by Application 2020 & 2033
- Table 29: Global Precision Farming Software Industry Revenue billion Forecast, by Type 2020 & 2033
- Table 30: Global Precision Farming Software Industry Revenue billion Forecast, by Country 2020 & 2033
- Table 31: China Precision Farming Software Industry Revenue (billion) Forecast, by Application 2020 & 2033
- Table 32: Japan Precision Farming Software Industry Revenue (billion) Forecast, by Application 2020 & 2033
- Table 33: India Precision Farming Software Industry Revenue (billion) Forecast, by Application 2020 & 2033
- Table 34: Australia Precision Farming Software Industry Revenue (billion) Forecast, by Application 2020 & 2033
- Table 35: Rest of Asia Pacific Precision Farming Software Industry Revenue (billion) Forecast, by Application 2020 & 2033
- Table 36: Global Precision Farming Software Industry Revenue billion Forecast, by Application 2020 & 2033
- Table 37: Global Precision Farming Software Industry Revenue billion Forecast, by Type 2020 & 2033
- Table 38: Global Precision Farming Software Industry Revenue billion Forecast, by Application 2020 & 2033
- Table 39: Global Precision Farming Software Industry Revenue billion Forecast, by Type 2020 & 2033
- Table 40: Global Precision Farming Software Industry Revenue billion Forecast, by Country 2020 & 2033
- Table 41: Brazil Precision Farming Software Industry Revenue (billion) Forecast, by Application 2020 & 2033
- Table 42: Argentina Precision Farming Software Industry Revenue (billion) Forecast, by Application 2020 & 2033
- Table 43: Rest of South America Precision Farming Software Industry Revenue (billion) Forecast, by Application 2020 & 2033
- Table 44: Global Precision Farming Software Industry Revenue billion Forecast, by Application 2020 & 2033
- Table 45: Global Precision Farming Software Industry Revenue billion Forecast, by Type 2020 & 2033
- Table 46: Global Precision Farming Software Industry Revenue billion Forecast, by Application 2020 & 2033
- Table 47: Global Precision Farming Software Industry Revenue billion Forecast, by Type 2020 & 2033
- Table 48: Global Precision Farming Software Industry Revenue billion Forecast, by Country 2020 & 2033
- Table 49: South Africa Precision Farming Software Industry Revenue (billion) Forecast, by Application 2020 & 2033
- Table 50: Rest of Africa Precision Farming Software Industry Revenue (billion) Forecast, by Application 2020 & 2033
Frequently Asked Questions
1. What is the projected Compound Annual Growth Rate (CAGR) of the Precision Farming Software Industry?
The projected CAGR is approximately 13.9%.
2. Which companies are prominent players in the Precision Farming Software Industry?
Key companies in the market include Conservis Corporation, Raven Industries, AG Leader Technology, AG Junction, ClearAg Operations, Deere & Company, Fairport Farm Software, AG DNA, Topcon Positioning Systems, Trimble Inc, Bayer CropScience AG, Agribotix, Case IH Agriculture, Mapshots Inc, IBM, AGCO Corporation.
3. What are the main segments of the Precision Farming Software Industry?
The market segments include Application, Type, Application, Type.
4. Can you provide details about the market size?
The market size is estimated to be USD 2.7 billion as of 2022.
5. What are some drivers contributing to market growth?
Increasing Demand for Tomato; Adoption of Greenhouse Technology in Tomato Cultivation; Government support.
6. What are the notable trends driving market growth?
Farm Labor Shortage and Rise in Average Farm Size.
7. Are there any restraints impacting market growth?
Increasing Loses due to Physiological Disorder. Pest and Disease; Unfavourable Climatic Condition.
8. Can you provide examples of recent developments in the market?
N/A
9. What pricing options are available for accessing the report?
Pricing options include single-user, multi-user, and enterprise licenses priced at USD 4750, USD 5250, and USD 8750 respectively.
10. Is the market size provided in terms of value or volume?
The market size is provided in terms of value, measured in billion.
11. Are there any specific market keywords associated with the report?
Yes, the market keyword associated with the report is "Precision Farming Software Industry," which aids in identifying and referencing the specific market segment covered.
12. How do I determine which pricing option suits my needs best?
The pricing options vary based on user requirements and access needs. Individual users may opt for single-user licenses, while businesses requiring broader access may choose multi-user or enterprise licenses for cost-effective access to the report.
13. Are there any additional resources or data provided in the Precision Farming Software Industry report?
While the report offers comprehensive insights, it's advisable to review the specific contents or supplementary materials provided to ascertain if additional resources or data are available.
14. How can I stay updated on further developments or reports in the Precision Farming Software Industry?
To stay informed about further developments, trends, and reports in the Precision Farming Software Industry, consider subscribing to industry newsletters, following relevant companies and organizations, or regularly checking reputable industry news sources and publications.
Methodology
Step 1 - Identification of Relevant Samples Size from Population Database


Step 2 - Approaches for Defining Global Market Size (Value, Volume* & Price*)

Note*: In applicable scenarios
Step 3 - Data Sources
Primary Research
- Web Analytics
- Survey Reports
- Research Institute
- Latest Research Reports
- Opinion Leaders
Secondary Research
- Annual Reports
- White Paper
- Latest Press Release
- Industry Association
- Paid Database
- Investor Presentations

Step 4 - Data Triangulation
Involves using different sources of information in order to increase the validity of a study
These sources are likely to be stakeholders in a program - participants, other researchers, program staff, other community members, and so on.
Then we put all data in single framework & apply various statistical tools to find out the dynamic on the market.
During the analysis stage, feedback from the stakeholder groups would be compared to determine areas of agreement as well as areas of divergence