
Key Insights
The global market for Power Battery Pack Charging and Discharging Test Systems is poised for robust growth, projected to reach an estimated $1,100 million by 2025, exhibiting a Compound Annual Growth Rate (CAGR) of 6.3% through 2033. This expansion is primarily driven by the accelerating adoption of electric vehicles (EVs), including new energy vehicles and two/three-wheeled electric variants, which necessitate rigorous testing of their battery packs. The increasing demand for reliable and efficient battery performance, coupled with stringent safety regulations, fuels the need for sophisticated charging and discharging test systems. The market is segmented into EV Test and HEV Test applications, with both segments experiencing significant investment. Emerging economies, particularly in Asia Pacific, are showing substantial growth potential due to their burgeoning EV manufacturing sectors and supportive government policies.
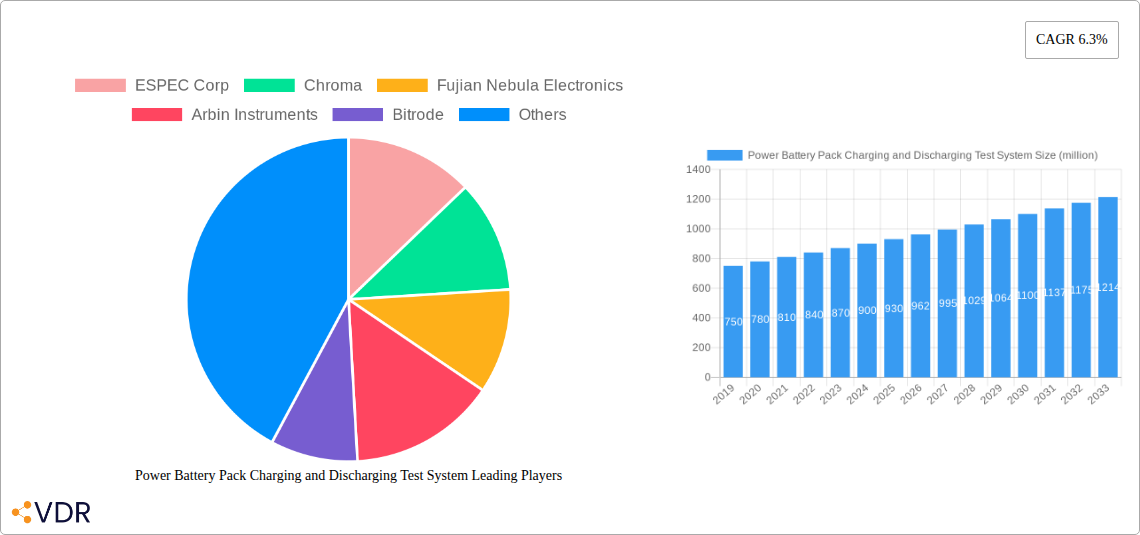
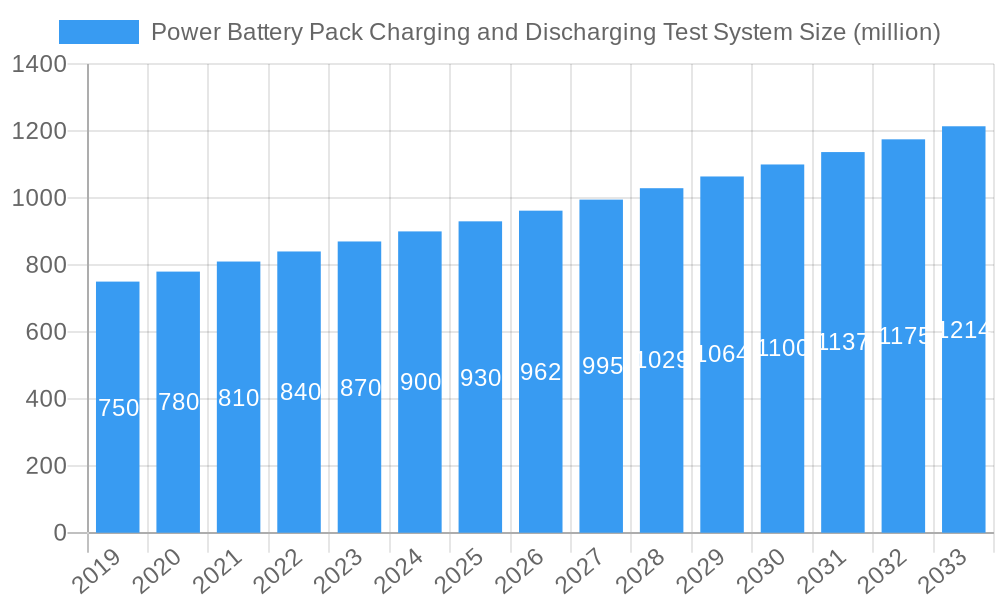
Power Battery Pack Charging and Discharging Test System Market Size (In Million)

The market's trajectory is further shaped by key trends such as the development of advanced testing solutions that can simulate real-world driving conditions and battery degradation. Innovations in high-power density battery technology and the increasing complexity of battery management systems (BMS) also demand more advanced and precise testing equipment. While the market is strong, potential restraints might include the high initial cost of some advanced test systems and the need for skilled personnel to operate and maintain them. However, the continuous drive for improved battery safety, longer lifespan, and faster charging capabilities within the automotive and other electric mobility sectors will continue to propel the demand for these critical testing solutions. Key players like ESPEC Corp, Chroma, and Keysight are actively innovating to meet these evolving market needs.
Power Battery Pack Charging and Discharging Test System Company Market Share
This comprehensive market research report provides an in-depth analysis of the global Power Battery Pack Charging and Discharging Test System market, crucial for the development and validation of advanced energy storage solutions. With the exponential growth of electric vehicles (EVs), hybrid electric vehicles (HEVs), and renewable energy integration, the demand for sophisticated testing systems is surging. This report offers actionable insights for stakeholders, including manufacturers, battery developers, automotive OEMs, and research institutions, to navigate this dynamic and rapidly expanding sector.
Power Battery Pack Charging and Discharging Test System Market Dynamics & Structure
The Power Battery Pack Charging and Discharging Test System market is characterized by a moderately concentrated landscape, driven by technological innovation in battery management systems (BMS) and evolving regulatory frameworks. Key innovation drivers include the increasing energy density and complexity of power battery packs, the need for faster charging capabilities, and enhanced safety protocols. Competitive product substitutes, such as manual testing methods, are rapidly diminishing in relevance as the industry demands higher precision, repeatability, and data acquisition capabilities. End-user demographics are increasingly shifting towards automotive manufacturers and Tier-1 suppliers, with a growing presence of energy storage solution providers for grid-scale applications. Mergers and acquisitions (M&A) activity is expected to see moderate growth as larger players seek to acquire specialized technologies or expand their market reach.
- Market Concentration: Moderately concentrated with a few key global players and numerous regional specialists.
- Technological Innovation Drivers: Increased battery capacity, faster charging demands, advanced BMS features, safety standards, and grid integration requirements.
- Regulatory Frameworks: Evolving safety standards (e.g., UN ECE R100), emissions regulations, and energy efficiency mandates are crucial market shapers.
- Competitive Product Substitutes: Limited due to the complexity and precision required for power battery pack testing.
- End-User Demographics: Predominantly automotive OEMs, battery manufacturers, and energy storage providers.
- M&A Trends: Potential for consolidation among smaller players and strategic acquisitions by larger entities seeking specific technological expertise.
Power Battery Pack Charging and Discharging Test System Growth Trends & Insights
The global Power Battery Pack Charging and Discharging Test System market is poised for substantial expansion, driven by a confluence of factors including robust adoption rates of electric and hybrid vehicles and significant technological advancements. The market is projected to experience a Compound Annual Growth Rate (CAGR) of approximately 12.5% from the base year of 2025 through 2033, reaching an estimated market size of over $3,500 million units by the forecast period's end. This growth trajectory is underpinned by increasing government incentives for EV adoption, tightening emissions standards worldwide, and the continuous push for higher energy density and faster charging capabilities in battery technology. Consumer behavior is also shifting, with a growing preference for sustainable transportation solutions, directly fueling the demand for reliable and efficient power battery pack testing systems. Technological disruptions, such as the development of solid-state batteries and advanced thermal management systems, will necessitate the evolution of testing methodologies and equipment, creating a continuous cycle of innovation and market expansion. The penetration of these sophisticated testing systems into emerging markets, particularly in Asia-Pacific and Eastern Europe, is expected to accelerate, contributing significantly to the overall market growth. Furthermore, the integration of AI and machine learning into testing systems for predictive maintenance and optimized testing protocols will further enhance their value proposition and adoption rates.
Dominant Regions, Countries, or Segments in Power Battery Pack Charging and Discharging Test System
The New Energy Vehicles (NEVs) application segment is the undeniable dominant force driving growth in the Power Battery Pack Charging and Discharging Test System market. This dominance is primarily attributed to the global surge in electric vehicle adoption, propelled by supportive government policies, expanding charging infrastructure, and increasing consumer awareness regarding environmental sustainability. Within the NEVs segment, EV Test systems represent the largest sub-segment, reflecting the sheer volume of battery packs requiring rigorous testing for performance, safety, and longevity. The Asia-Pacific region, particularly China, emerges as the leading geographical market. This leadership is a direct consequence of China's aggressive push towards becoming a global hub for EV manufacturing and battery production, supported by substantial government subsidies and investment. Countries like the United States and Germany also exhibit significant market share due to their strong automotive industries and commitments to electrification.
- Dominant Application Segment: New Energy Vehicles (NEVs), encompassing battery electric vehicles (BEVs) and plug-in hybrid electric vehicles (PHEVs).
- Dominant Type: EV Test systems, catering to the comprehensive validation needs of fully electric powertrains.
- Leading Region: Asia-Pacific, spearheaded by China, due to its extensive EV manufacturing ecosystem and robust policy support.
- Key Drivers in Dominant Segments:
- Government Incentives & Regulations: Subsidies for EV purchases, stricter emission norms, and mandates for battery safety and performance.
- Automotive Industry Investment: Significant R&D and production capacity expansion by global and local automotive manufacturers in the EV space.
- Battery Technology Advancements: Continuous innovation in battery chemistry and design leading to higher energy densities and faster charging, requiring sophisticated testing.
- Consumer Demand: Growing preference for sustainable transportation solutions and increasing awareness of the benefits of EVs.
- Infrastructure Development: Expansion of EV charging networks, further encouraging consumer adoption.
Power Battery Pack Charging and Discharging Test System Product Landscape
The product landscape for Power Battery Pack Charging and Discharging Test Systems is characterized by increasing sophistication and specialization. Manufacturers are focused on developing systems with higher power ratings, wider voltage ranges, and enhanced accuracy to meet the evolving demands of advanced battery chemistries and pack designs. Key innovations include modular system architectures for flexibility, advanced data acquisition and analysis capabilities leveraging AI, and integrated safety features for robust testing environments. These systems are designed for a broad spectrum of applications, from R&D labs to mass production lines, ensuring seamless integration into existing workflows. Performance metrics such as charging/discharging efficiency, cycle life testing precision, and dynamic response accuracy are critical selling points.
Key Drivers, Barriers & Challenges in Power Battery Pack Charging and Discharging Test System
Key Drivers:
- Global Electrification Push: The accelerating transition to electric vehicles across all segments, from passenger cars to heavy-duty trucks, is the primary growth engine.
- Advancements in Battery Technology: Continuous innovation in battery chemistries, energy density, and charging speeds necessitates sophisticated testing.
- Stringent Safety and Performance Standards: Regulatory bodies are imposing stricter requirements, driving the need for precise and reliable testing systems.
- Growth in Renewable Energy Storage: The increasing integration of renewable energy sources like solar and wind requires reliable battery storage, driving demand for testing.
Barriers & Challenges:
- High Initial Investment: The cost of advanced testing systems can be a significant barrier for smaller companies and startups.
- Technological Obsolescence: Rapid advancements in battery technology can lead to the quick obsolescence of existing testing equipment.
- Supply Chain Disruptions: Global supply chain issues can impact the availability of critical components for test system manufacturing.
- Skilled Workforce Shortage: A lack of highly skilled engineers and technicians to operate and maintain complex testing equipment poses a challenge.
- Standardization Issues: Inconsistent testing standards across different regions and applications can create complexities.
Emerging Opportunities in Power Battery Pack Charging and Discharging Test System
Emerging opportunities lie in the development of highly modular and scalable testing solutions that can adapt to the rapid evolution of battery technologies. The increasing demand for testing systems capable of handling higher voltage and power outputs for commercial EVs and grid-scale storage presents a significant growth avenue. Furthermore, the integration of advanced analytics and AI-driven diagnostics within test systems to predict battery degradation and optimize testing cycles offers a strong value proposition. Untapped markets in developing economies that are beginning to embrace electric mobility also represent significant expansion potential.
Growth Accelerators in the Power Battery Pack Charging and Discharging Test System Industry
Several catalysts are accelerating the growth of the Power Battery Pack Charging and Discharging Test System industry. Technological breakthroughs in high-power electronic components, advanced software for real-time data analysis, and the development of more compact and energy-efficient test systems are critical accelerators. Strategic partnerships between test system manufacturers and battery developers or automotive OEMs foster co-creation and faster market adoption. Market expansion strategies, including the establishment of service centers and training programs in emerging EV markets, are also crucial for sustained growth.
Key Players Shaping the Power Battery Pack Charging and Discharging Test System Market
- ESPEC Corp
- Chroma
- Fujian Nebula Electronics
- Arbin Instruments
- Bitrode
- Keysight
- Digatron
- Chen Tech Electric
- Kikusui Electronics
- Sinexcel
- Matsusada Precision
- NH Research
- PRODIGIT Electronics
- WinAck Battery Technology
- Myway Plus
Notable Milestones in Power Battery Pack Charging and Discharging Test System Sector
- 2019: Introduction of high-voltage testing systems to accommodate growing EV battery pack requirements.
- 2020: Increased focus on regenerative braking simulation capabilities in test systems.
- 2021: Emergence of AI-powered analytics for predictive battery health monitoring in testing.
- 2022: Development of faster and more flexible modular test system architectures.
- 2023: Significant advancements in thermal management testing for high-density battery packs.
- 2024: Enhanced cybersecurity features integrated into test system software to protect sensitive data.
In-Depth Power Battery Pack Charging and Discharging Test System Market Outlook
The future outlook for the Power Battery Pack Charging and Discharging Test System market is exceptionally positive, driven by ongoing technological innovation and the unwavering global commitment to electrification. Strategic investments in advanced R&D, the expansion of product portfolios to encompass a wider range of battery chemistries and applications, and a proactive approach to developing solutions for next-generation energy storage will be paramount. Companies that can offer integrated testing solutions, coupled with robust data analytics and unparalleled customer support, will be best positioned to capitalize on the substantial growth opportunities in this critical sector. The market's trajectory suggests a continued upward trend, fueled by the indispensable role these systems play in ensuring the safety, reliability, and performance of the world's growing fleet of electric vehicles and renewable energy storage systems.
Power Battery Pack Charging and Discharging Test System Segmentation
-
1. Application
- 1.1. New Energy Vehicles
- 1.2. Two-wheeled/Three-wheeled Vehicles
-
2. Types
- 2.1. EV Test
- 2.2. HEV Test
Power Battery Pack Charging and Discharging Test System Segmentation By Geography
-
1. North America
- 1.1. United States
- 1.2. Canada
- 1.3. Mexico
-
2. South America
- 2.1. Brazil
- 2.2. Argentina
- 2.3. Rest of South America
-
3. Europe
- 3.1. United Kingdom
- 3.2. Germany
- 3.3. France
- 3.4. Italy
- 3.5. Spain
- 3.6. Russia
- 3.7. Benelux
- 3.8. Nordics
- 3.9. Rest of Europe
-
4. Middle East & Africa
- 4.1. Turkey
- 4.2. Israel
- 4.3. GCC
- 4.4. North Africa
- 4.5. South Africa
- 4.6. Rest of Middle East & Africa
-
5. Asia Pacific
- 5.1. China
- 5.2. India
- 5.3. Japan
- 5.4. South Korea
- 5.5. ASEAN
- 5.6. Oceania
- 5.7. Rest of Asia Pacific
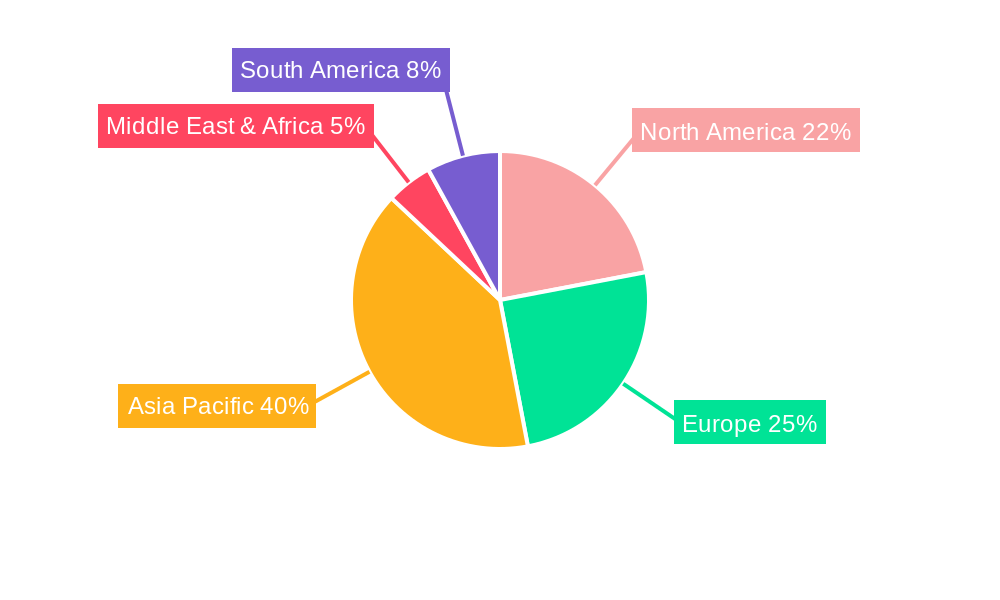
Power Battery Pack Charging and Discharging Test System Regional Market Share
Geographic Coverage of Power Battery Pack Charging and Discharging Test System
Power Battery Pack Charging and Discharging Test System REPORT HIGHLIGHTS
| Aspects | Details |
|---|---|
| Study Period | 2020-2034 |
| Base Year | 2025 |
| Estimated Year | 2026 |
| Forecast Period | 2026-2034 |
| Historical Period | 2020-2025 |
| Growth Rate | CAGR of 6.3% from 2020-2034 |
| Segmentation |
|
Table of Contents
- 1. Introduction
- 1.1. Research Scope
- 1.2. Market Segmentation
- 1.3. Research Methodology
- 1.4. Definitions and Assumptions
- 2. Executive Summary
- 2.1. Introduction
- 3. Market Dynamics
- 3.1. Introduction
- 3.2. Market Drivers
- 3.3. Market Restrains
- 3.4. Market Trends
- 4. Market Factor Analysis
- 4.1. Porters Five Forces
- 4.2. Supply/Value Chain
- 4.3. PESTEL analysis
- 4.4. Market Entropy
- 4.5. Patent/Trademark Analysis
- 5. Global Power Battery Pack Charging and Discharging Test System Analysis, Insights and Forecast, 2020-2032
- 5.1. Market Analysis, Insights and Forecast - by Application
- 5.1.1. New Energy Vehicles
- 5.1.2. Two-wheeled/Three-wheeled Vehicles
- 5.2. Market Analysis, Insights and Forecast - by Types
- 5.2.1. EV Test
- 5.2.2. HEV Test
- 5.3. Market Analysis, Insights and Forecast - by Region
- 5.3.1. North America
- 5.3.2. South America
- 5.3.3. Europe
- 5.3.4. Middle East & Africa
- 5.3.5. Asia Pacific
- 5.1. Market Analysis, Insights and Forecast - by Application
- 6. North America Power Battery Pack Charging and Discharging Test System Analysis, Insights and Forecast, 2020-2032
- 6.1. Market Analysis, Insights and Forecast - by Application
- 6.1.1. New Energy Vehicles
- 6.1.2. Two-wheeled/Three-wheeled Vehicles
- 6.2. Market Analysis, Insights and Forecast - by Types
- 6.2.1. EV Test
- 6.2.2. HEV Test
- 6.1. Market Analysis, Insights and Forecast - by Application
- 7. South America Power Battery Pack Charging and Discharging Test System Analysis, Insights and Forecast, 2020-2032
- 7.1. Market Analysis, Insights and Forecast - by Application
- 7.1.1. New Energy Vehicles
- 7.1.2. Two-wheeled/Three-wheeled Vehicles
- 7.2. Market Analysis, Insights and Forecast - by Types
- 7.2.1. EV Test
- 7.2.2. HEV Test
- 7.1. Market Analysis, Insights and Forecast - by Application
- 8. Europe Power Battery Pack Charging and Discharging Test System Analysis, Insights and Forecast, 2020-2032
- 8.1. Market Analysis, Insights and Forecast - by Application
- 8.1.1. New Energy Vehicles
- 8.1.2. Two-wheeled/Three-wheeled Vehicles
- 8.2. Market Analysis, Insights and Forecast - by Types
- 8.2.1. EV Test
- 8.2.2. HEV Test
- 8.1. Market Analysis, Insights and Forecast - by Application
- 9. Middle East & Africa Power Battery Pack Charging and Discharging Test System Analysis, Insights and Forecast, 2020-2032
- 9.1. Market Analysis, Insights and Forecast - by Application
- 9.1.1. New Energy Vehicles
- 9.1.2. Two-wheeled/Three-wheeled Vehicles
- 9.2. Market Analysis, Insights and Forecast - by Types
- 9.2.1. EV Test
- 9.2.2. HEV Test
- 9.1. Market Analysis, Insights and Forecast - by Application
- 10. Asia Pacific Power Battery Pack Charging and Discharging Test System Analysis, Insights and Forecast, 2020-2032
- 10.1. Market Analysis, Insights and Forecast - by Application
- 10.1.1. New Energy Vehicles
- 10.1.2. Two-wheeled/Three-wheeled Vehicles
- 10.2. Market Analysis, Insights and Forecast - by Types
- 10.2.1. EV Test
- 10.2.2. HEV Test
- 10.1. Market Analysis, Insights and Forecast - by Application
- 11. Competitive Analysis
- 11.1. Global Market Share Analysis 2025
- 11.2. Company Profiles
- 11.2.1 ESPEC Corp
- 11.2.1.1. Overview
- 11.2.1.2. Products
- 11.2.1.3. SWOT Analysis
- 11.2.1.4. Recent Developments
- 11.2.1.5. Financials (Based on Availability)
- 11.2.2 Chroma
- 11.2.2.1. Overview
- 11.2.2.2. Products
- 11.2.2.3. SWOT Analysis
- 11.2.2.4. Recent Developments
- 11.2.2.5. Financials (Based on Availability)
- 11.2.3 Fujian Nebula Electronics
- 11.2.3.1. Overview
- 11.2.3.2. Products
- 11.2.3.3. SWOT Analysis
- 11.2.3.4. Recent Developments
- 11.2.3.5. Financials (Based on Availability)
- 11.2.4 Arbin Instruments
- 11.2.4.1. Overview
- 11.2.4.2. Products
- 11.2.4.3. SWOT Analysis
- 11.2.4.4. Recent Developments
- 11.2.4.5. Financials (Based on Availability)
- 11.2.5 Bitrode
- 11.2.5.1. Overview
- 11.2.5.2. Products
- 11.2.5.3. SWOT Analysis
- 11.2.5.4. Recent Developments
- 11.2.5.5. Financials (Based on Availability)
- 11.2.6 Keysight
- 11.2.6.1. Overview
- 11.2.6.2. Products
- 11.2.6.3. SWOT Analysis
- 11.2.6.4. Recent Developments
- 11.2.6.5. Financials (Based on Availability)
- 11.2.7 Digatron
- 11.2.7.1. Overview
- 11.2.7.2. Products
- 11.2.7.3. SWOT Analysis
- 11.2.7.4. Recent Developments
- 11.2.7.5. Financials (Based on Availability)
- 11.2.8 Chen Tech Electric
- 11.2.8.1. Overview
- 11.2.8.2. Products
- 11.2.8.3. SWOT Analysis
- 11.2.8.4. Recent Developments
- 11.2.8.5. Financials (Based on Availability)
- 11.2.9 Kikusui Electronics
- 11.2.9.1. Overview
- 11.2.9.2. Products
- 11.2.9.3. SWOT Analysis
- 11.2.9.4. Recent Developments
- 11.2.9.5. Financials (Based on Availability)
- 11.2.10 Sinexcel
- 11.2.10.1. Overview
- 11.2.10.2. Products
- 11.2.10.3. SWOT Analysis
- 11.2.10.4. Recent Developments
- 11.2.10.5. Financials (Based on Availability)
- 11.2.11 Matsusada Precision
- 11.2.11.1. Overview
- 11.2.11.2. Products
- 11.2.11.3. SWOT Analysis
- 11.2.11.4. Recent Developments
- 11.2.11.5. Financials (Based on Availability)
- 11.2.12 NH Research
- 11.2.12.1. Overview
- 11.2.12.2. Products
- 11.2.12.3. SWOT Analysis
- 11.2.12.4. Recent Developments
- 11.2.12.5. Financials (Based on Availability)
- 11.2.13 PRODIGIT Electronics
- 11.2.13.1. Overview
- 11.2.13.2. Products
- 11.2.13.3. SWOT Analysis
- 11.2.13.4. Recent Developments
- 11.2.13.5. Financials (Based on Availability)
- 11.2.14 WinAck Battery Technology
- 11.2.14.1. Overview
- 11.2.14.2. Products
- 11.2.14.3. SWOT Analysis
- 11.2.14.4. Recent Developments
- 11.2.14.5. Financials (Based on Availability)
- 11.2.15 Myway Plus
- 11.2.15.1. Overview
- 11.2.15.2. Products
- 11.2.15.3. SWOT Analysis
- 11.2.15.4. Recent Developments
- 11.2.15.5. Financials (Based on Availability)
- 11.2.1 ESPEC Corp
List of Figures
- Figure 1: Global Power Battery Pack Charging and Discharging Test System Revenue Breakdown (million, %) by Region 2025 & 2033
- Figure 2: North America Power Battery Pack Charging and Discharging Test System Revenue (million), by Application 2025 & 2033
- Figure 3: North America Power Battery Pack Charging and Discharging Test System Revenue Share (%), by Application 2025 & 2033
- Figure 4: North America Power Battery Pack Charging and Discharging Test System Revenue (million), by Types 2025 & 2033
- Figure 5: North America Power Battery Pack Charging and Discharging Test System Revenue Share (%), by Types 2025 & 2033
- Figure 6: North America Power Battery Pack Charging and Discharging Test System Revenue (million), by Country 2025 & 2033
- Figure 7: North America Power Battery Pack Charging and Discharging Test System Revenue Share (%), by Country 2025 & 2033
- Figure 8: South America Power Battery Pack Charging and Discharging Test System Revenue (million), by Application 2025 & 2033
- Figure 9: South America Power Battery Pack Charging and Discharging Test System Revenue Share (%), by Application 2025 & 2033
- Figure 10: South America Power Battery Pack Charging and Discharging Test System Revenue (million), by Types 2025 & 2033
- Figure 11: South America Power Battery Pack Charging and Discharging Test System Revenue Share (%), by Types 2025 & 2033
- Figure 12: South America Power Battery Pack Charging and Discharging Test System Revenue (million), by Country 2025 & 2033
- Figure 13: South America Power Battery Pack Charging and Discharging Test System Revenue Share (%), by Country 2025 & 2033
- Figure 14: Europe Power Battery Pack Charging and Discharging Test System Revenue (million), by Application 2025 & 2033
- Figure 15: Europe Power Battery Pack Charging and Discharging Test System Revenue Share (%), by Application 2025 & 2033
- Figure 16: Europe Power Battery Pack Charging and Discharging Test System Revenue (million), by Types 2025 & 2033
- Figure 17: Europe Power Battery Pack Charging and Discharging Test System Revenue Share (%), by Types 2025 & 2033
- Figure 18: Europe Power Battery Pack Charging and Discharging Test System Revenue (million), by Country 2025 & 2033
- Figure 19: Europe Power Battery Pack Charging and Discharging Test System Revenue Share (%), by Country 2025 & 2033
- Figure 20: Middle East & Africa Power Battery Pack Charging and Discharging Test System Revenue (million), by Application 2025 & 2033
- Figure 21: Middle East & Africa Power Battery Pack Charging and Discharging Test System Revenue Share (%), by Application 2025 & 2033
- Figure 22: Middle East & Africa Power Battery Pack Charging and Discharging Test System Revenue (million), by Types 2025 & 2033
- Figure 23: Middle East & Africa Power Battery Pack Charging and Discharging Test System Revenue Share (%), by Types 2025 & 2033
- Figure 24: Middle East & Africa Power Battery Pack Charging and Discharging Test System Revenue (million), by Country 2025 & 2033
- Figure 25: Middle East & Africa Power Battery Pack Charging and Discharging Test System Revenue Share (%), by Country 2025 & 2033
- Figure 26: Asia Pacific Power Battery Pack Charging and Discharging Test System Revenue (million), by Application 2025 & 2033
- Figure 27: Asia Pacific Power Battery Pack Charging and Discharging Test System Revenue Share (%), by Application 2025 & 2033
- Figure 28: Asia Pacific Power Battery Pack Charging and Discharging Test System Revenue (million), by Types 2025 & 2033
- Figure 29: Asia Pacific Power Battery Pack Charging and Discharging Test System Revenue Share (%), by Types 2025 & 2033
- Figure 30: Asia Pacific Power Battery Pack Charging and Discharging Test System Revenue (million), by Country 2025 & 2033
- Figure 31: Asia Pacific Power Battery Pack Charging and Discharging Test System Revenue Share (%), by Country 2025 & 2033
List of Tables
- Table 1: Global Power Battery Pack Charging and Discharging Test System Revenue million Forecast, by Application 2020 & 2033
- Table 2: Global Power Battery Pack Charging and Discharging Test System Revenue million Forecast, by Types 2020 & 2033
- Table 3: Global Power Battery Pack Charging and Discharging Test System Revenue million Forecast, by Region 2020 & 2033
- Table 4: Global Power Battery Pack Charging and Discharging Test System Revenue million Forecast, by Application 2020 & 2033
- Table 5: Global Power Battery Pack Charging and Discharging Test System Revenue million Forecast, by Types 2020 & 2033
- Table 6: Global Power Battery Pack Charging and Discharging Test System Revenue million Forecast, by Country 2020 & 2033
- Table 7: United States Power Battery Pack Charging and Discharging Test System Revenue (million) Forecast, by Application 2020 & 2033
- Table 8: Canada Power Battery Pack Charging and Discharging Test System Revenue (million) Forecast, by Application 2020 & 2033
- Table 9: Mexico Power Battery Pack Charging and Discharging Test System Revenue (million) Forecast, by Application 2020 & 2033
- Table 10: Global Power Battery Pack Charging and Discharging Test System Revenue million Forecast, by Application 2020 & 2033
- Table 11: Global Power Battery Pack Charging and Discharging Test System Revenue million Forecast, by Types 2020 & 2033
- Table 12: Global Power Battery Pack Charging and Discharging Test System Revenue million Forecast, by Country 2020 & 2033
- Table 13: Brazil Power Battery Pack Charging and Discharging Test System Revenue (million) Forecast, by Application 2020 & 2033
- Table 14: Argentina Power Battery Pack Charging and Discharging Test System Revenue (million) Forecast, by Application 2020 & 2033
- Table 15: Rest of South America Power Battery Pack Charging and Discharging Test System Revenue (million) Forecast, by Application 2020 & 2033
- Table 16: Global Power Battery Pack Charging and Discharging Test System Revenue million Forecast, by Application 2020 & 2033
- Table 17: Global Power Battery Pack Charging and Discharging Test System Revenue million Forecast, by Types 2020 & 2033
- Table 18: Global Power Battery Pack Charging and Discharging Test System Revenue million Forecast, by Country 2020 & 2033
- Table 19: United Kingdom Power Battery Pack Charging and Discharging Test System Revenue (million) Forecast, by Application 2020 & 2033
- Table 20: Germany Power Battery Pack Charging and Discharging Test System Revenue (million) Forecast, by Application 2020 & 2033
- Table 21: France Power Battery Pack Charging and Discharging Test System Revenue (million) Forecast, by Application 2020 & 2033
- Table 22: Italy Power Battery Pack Charging and Discharging Test System Revenue (million) Forecast, by Application 2020 & 2033
- Table 23: Spain Power Battery Pack Charging and Discharging Test System Revenue (million) Forecast, by Application 2020 & 2033
- Table 24: Russia Power Battery Pack Charging and Discharging Test System Revenue (million) Forecast, by Application 2020 & 2033
- Table 25: Benelux Power Battery Pack Charging and Discharging Test System Revenue (million) Forecast, by Application 2020 & 2033
- Table 26: Nordics Power Battery Pack Charging and Discharging Test System Revenue (million) Forecast, by Application 2020 & 2033
- Table 27: Rest of Europe Power Battery Pack Charging and Discharging Test System Revenue (million) Forecast, by Application 2020 & 2033
- Table 28: Global Power Battery Pack Charging and Discharging Test System Revenue million Forecast, by Application 2020 & 2033
- Table 29: Global Power Battery Pack Charging and Discharging Test System Revenue million Forecast, by Types 2020 & 2033
- Table 30: Global Power Battery Pack Charging and Discharging Test System Revenue million Forecast, by Country 2020 & 2033
- Table 31: Turkey Power Battery Pack Charging and Discharging Test System Revenue (million) Forecast, by Application 2020 & 2033
- Table 32: Israel Power Battery Pack Charging and Discharging Test System Revenue (million) Forecast, by Application 2020 & 2033
- Table 33: GCC Power Battery Pack Charging and Discharging Test System Revenue (million) Forecast, by Application 2020 & 2033
- Table 34: North Africa Power Battery Pack Charging and Discharging Test System Revenue (million) Forecast, by Application 2020 & 2033
- Table 35: South Africa Power Battery Pack Charging and Discharging Test System Revenue (million) Forecast, by Application 2020 & 2033
- Table 36: Rest of Middle East & Africa Power Battery Pack Charging and Discharging Test System Revenue (million) Forecast, by Application 2020 & 2033
- Table 37: Global Power Battery Pack Charging and Discharging Test System Revenue million Forecast, by Application 2020 & 2033
- Table 38: Global Power Battery Pack Charging and Discharging Test System Revenue million Forecast, by Types 2020 & 2033
- Table 39: Global Power Battery Pack Charging and Discharging Test System Revenue million Forecast, by Country 2020 & 2033
- Table 40: China Power Battery Pack Charging and Discharging Test System Revenue (million) Forecast, by Application 2020 & 2033
- Table 41: India Power Battery Pack Charging and Discharging Test System Revenue (million) Forecast, by Application 2020 & 2033
- Table 42: Japan Power Battery Pack Charging and Discharging Test System Revenue (million) Forecast, by Application 2020 & 2033
- Table 43: South Korea Power Battery Pack Charging and Discharging Test System Revenue (million) Forecast, by Application 2020 & 2033
- Table 44: ASEAN Power Battery Pack Charging and Discharging Test System Revenue (million) Forecast, by Application 2020 & 2033
- Table 45: Oceania Power Battery Pack Charging and Discharging Test System Revenue (million) Forecast, by Application 2020 & 2033
- Table 46: Rest of Asia Pacific Power Battery Pack Charging and Discharging Test System Revenue (million) Forecast, by Application 2020 & 2033
Frequently Asked Questions
1. What is the projected Compound Annual Growth Rate (CAGR) of the Power Battery Pack Charging and Discharging Test System?
The projected CAGR is approximately 6.3%.
2. Which companies are prominent players in the Power Battery Pack Charging and Discharging Test System?
Key companies in the market include ESPEC Corp, Chroma, Fujian Nebula Electronics, Arbin Instruments, Bitrode, Keysight, Digatron, Chen Tech Electric, Kikusui Electronics, Sinexcel, Matsusada Precision, NH Research, PRODIGIT Electronics, WinAck Battery Technology, Myway Plus.
3. What are the main segments of the Power Battery Pack Charging and Discharging Test System?
The market segments include Application, Types.
4. Can you provide details about the market size?
The market size is estimated to be USD 871 million as of 2022.
5. What are some drivers contributing to market growth?
N/A
6. What are the notable trends driving market growth?
N/A
7. Are there any restraints impacting market growth?
N/A
8. Can you provide examples of recent developments in the market?
N/A
9. What pricing options are available for accessing the report?
Pricing options include single-user, multi-user, and enterprise licenses priced at USD 4350.00, USD 6525.00, and USD 8700.00 respectively.
10. Is the market size provided in terms of value or volume?
The market size is provided in terms of value, measured in million.
11. Are there any specific market keywords associated with the report?
Yes, the market keyword associated with the report is "Power Battery Pack Charging and Discharging Test System," which aids in identifying and referencing the specific market segment covered.
12. How do I determine which pricing option suits my needs best?
The pricing options vary based on user requirements and access needs. Individual users may opt for single-user licenses, while businesses requiring broader access may choose multi-user or enterprise licenses for cost-effective access to the report.
13. Are there any additional resources or data provided in the Power Battery Pack Charging and Discharging Test System report?
While the report offers comprehensive insights, it's advisable to review the specific contents or supplementary materials provided to ascertain if additional resources or data are available.
14. How can I stay updated on further developments or reports in the Power Battery Pack Charging and Discharging Test System?
To stay informed about further developments, trends, and reports in the Power Battery Pack Charging and Discharging Test System, consider subscribing to industry newsletters, following relevant companies and organizations, or regularly checking reputable industry news sources and publications.
Methodology
Step 1 - Identification of Relevant Samples Size from Population Database


Step 2 - Approaches for Defining Global Market Size (Value, Volume* & Price*)

Note*: In applicable scenarios
Step 3 - Data Sources
Primary Research
- Web Analytics
- Survey Reports
- Research Institute
- Latest Research Reports
- Opinion Leaders
Secondary Research
- Annual Reports
- White Paper
- Latest Press Release
- Industry Association
- Paid Database
- Investor Presentations

Step 4 - Data Triangulation
Involves using different sources of information in order to increase the validity of a study
These sources are likely to be stakeholders in a program - participants, other researchers, program staff, other community members, and so on.
Then we put all data in single framework & apply various statistical tools to find out the dynamic on the market.
During the analysis stage, feedback from the stakeholder groups would be compared to determine areas of agreement as well as areas of divergence

