

Key Insights
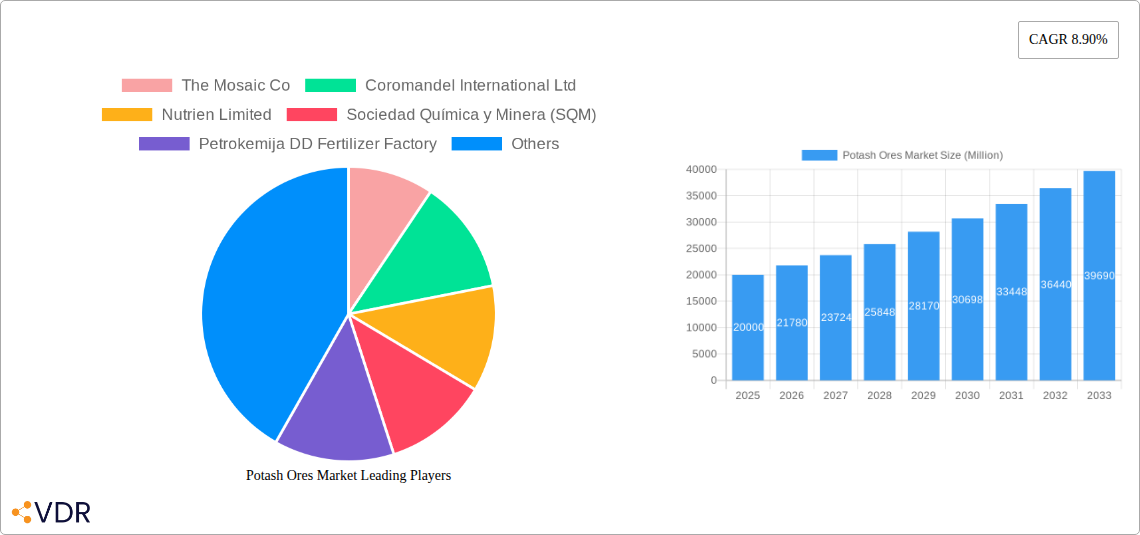
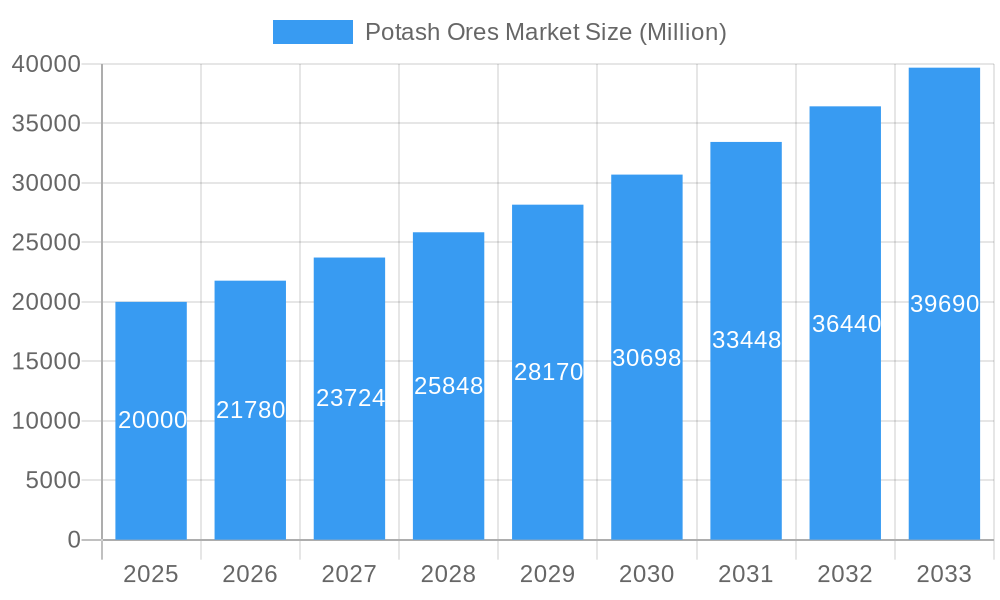
The global potash ores market, valued at $66.11 billion in 2025, is projected for significant expansion, with a compound annual growth rate (CAGR) of 8.9% from 2025 to 2033. This growth is propelled by escalating global food demand due to a growing population and rising incomes, which necessitates increased crop yields and, consequently, higher demand for potash fertilizers. Advancements in agricultural practices, including precision farming and wider adoption of fertigation, are improving potash utilization efficiency. Government initiatives promoting sustainable agriculture and food security further bolster market growth. However, market expansion is moderated by volatile potash prices influenced by geopolitical factors and production limitations, alongside environmental concerns regarding fertilizer overuse. The market is segmented by type (straight potash, others), application mode (fertigation, foliar, soil), and crop type (field crops, horticultural crops, turf & ornamental). Key players such as The Mosaic Company, Nutrien, and SQM lead the market, capitalizing on their established distribution and production capacities. Geographically, North America, Europe, and Asia-Pacific are significant contributors, with growth trajectories shaped by local agricultural practices and policies. Intensifying competition arises from new entrants focusing on innovative production and sustainable fertilizer solutions.
Potash Ores Market Market Size (In Billion)
The forecast period (2025-2033) anticipates sustained market growth, subject to global economic conditions and agricultural production trends. The increasing adoption of sustainable farming and development of high-efficiency fertilizers will critically shape market dynamics. Companies are expected to prioritize R&D for enhanced fertilizer efficiency and reduced environmental impact, influencing the competitive landscape and future growth. Innovative blending techniques optimizing nutrient delivery for specific crops will also impact market segmentation and player strategies. The long-term outlook for the potash ores market remains robust, driven by the fundamental requirement for improved agricultural productivity and global food security.
Potash Ores Market Company Market Share
Potash Ores Market: A Comprehensive Report (2019-2033)
This comprehensive report provides an in-depth analysis of the global Potash Ores market, encompassing its parent market (Fertilizers) and child markets (segments by Type, Application Mode, and Crop Type). The report covers the historical period (2019-2024), base year (2025), and forecast period (2025-2033), offering invaluable insights for industry professionals, investors, and stakeholders. The market size is presented in million units.
Potash Ores Market Dynamics & Structure
The Potash Ores market is characterized by moderate concentration, with key players holding significant market shares. Technological innovation, primarily focused on enhancing nutrient efficiency and sustainable farming practices, is a key driver. Regulatory frameworks, varying across regions, significantly influence production and consumption patterns. Competitive substitutes, such as alternative fertilizers, exert pressure on market growth. End-user demographics, especially the increasing demand from developing economies' burgeoning agricultural sectors, play a vital role. Mergers and acquisitions (M&A) activity is relatively frequent, reflecting consolidation efforts within the industry.
- Market Concentration: Moderately concentrated, with top 5 players holding approximately xx% market share in 2024.
- Technological Innovation: Focus on precision agriculture, nutrient-use efficiency, and sustainable production methods.
- Regulatory Landscape: Stringent environmental regulations impact production and transportation costs.
- Competitive Substitutes: Competition from alternative fertilizers and organic farming practices.
- End-User Demographics: Growing demand driven by increasing global population and rising food consumption.
- M&A Activity: xx M&A deals recorded between 2019 and 2024, primarily driven by expansion and market consolidation.
Potash Ores Market Growth Trends & Insights
The global Potash Ores market is projected to experience significant growth during the forecast period (2025-2033). Driven by factors including rising agricultural production, increasing fertilizer consumption, and favorable government policies promoting agricultural development, the market is expected to achieve a CAGR of xx% during this period. Technological disruptions, such as the introduction of precision agriculture technologies, will further accelerate adoption rates. Consumer behavior shifts towards sustainable and efficient farming practices also contribute to market growth. Market penetration of potash fertilizers in developing regions remains relatively low, presenting significant untapped opportunities.
- Market Size Evolution: Market size increased from xx million units in 2019 to xx million units in 2024, projected to reach xx million units by 2033.
- Adoption Rates: Increasing adoption of potash fertilizers, driven by higher crop yields and improved soil health.
- Technological Disruptions: Precision agriculture technologies enhance efficiency and reduce environmental impact.
- Consumer Behavior Shifts: Growing preference for sustainable and environmentally friendly farming practices.
Dominant Regions, Countries, or Segments in Potash Ores Market
North America and Asia-Pacific currently dominate the Potash Ores market, driven by large-scale agricultural activities and robust economic growth. Within these regions, specific countries like the USA, Canada, China, and India are leading contributors. In terms of segments, the "Straight" type of potash dominates the market due to its widespread use and cost-effectiveness. Among application modes, soil application remains the predominant method, while fertigation is gradually gaining traction. Field crops represent the largest consumer segment, followed by horticultural crops.
- Key Drivers:
- North America: Established agricultural infrastructure and high fertilizer consumption.
- Asia-Pacific: Rapidly growing agricultural sector and rising food demand.
- Straight Potash: Cost-effectiveness and widespread availability.
- Soil Application: Established practice and ease of use.
- Field Crops: Large-scale cultivation and high demand for fertilizer.
- Dominance Factors: Market share, growth potential, economic policies, and agricultural infrastructure.
Potash Ores Market Product Landscape
Potash ore products are continuously evolving, with a focus on enhanced nutrient delivery, improved solubility, and reduced environmental impact. Innovations include coated fertilizers, slow-release formulations, and blends with other essential nutrients. These advancements address specific crop needs and improve fertilizer use efficiency. The unique selling propositions center on superior crop yields, optimized nutrient uptake, and reduced environmental footprint.
Key Drivers, Barriers & Challenges in Potash Ores Market
Key Drivers: Rising global food demand, increasing agricultural intensification, favorable government policies supporting agricultural development, and technological advancements in fertilizer production and application. For example, the increasing adoption of precision agriculture techniques enhances fertilizer utilization efficiency.
Challenges & Restraints: Fluctuating potash prices due to supply chain disruptions and geopolitical factors, stringent environmental regulations, and competition from substitute fertilizers impact market growth. For example, supply chain bottlenecks caused by geopolitical instability have led to xx% price increase in 2024.
Emerging Opportunities in Potash Ores Market
Untapped markets in developing economies, the growing demand for organic and sustainable farming practices, and the development of new fertilizer formulations with improved nutrient efficiency offer significant opportunities. The increasing use of precision agriculture technologies and data-driven farming practices also presents considerable potential for innovation and growth.
Growth Accelerators in the Potash Ores Market Industry
Technological advancements in fertilizer production and application, strategic partnerships between fertilizer producers and agricultural technology companies, and expansion into new markets are key growth accelerators. Development of innovative fertilizer products tailored to specific crop requirements and the integration of sustainable practices will enhance market growth in the long term.
Key Players Shaping the Potash Ores Market Market
- The Mosaic Co (The Mosaic Co)
- Coromandel International Ltd
- Nutrien Limited (Nutrien Limited)
- Sociedad Química y Minera (SQM) (Sociedad Química y Minera (SQM))
- Petrokemija DD Fertilizer Factory
- Sinofert Holdings Ltd
- Eurochem
- Intrepid Potash Inc
- K+S AKTIENGESELLSCHAFT (K+S AKTIENGESELLSCHAFT)
Notable Milestones in Potash Ores Market Sector
- March 2022: EuroChem Group strengthens its Brazilian presence by acquiring a 51.48% stake in Fertilizantes Heringer SA.
- March 2021: Mosaic partners with Sound Agriculture to develop a nutrient efficiency product, scheduled for US market release in 2023.
- February 2019: Nutrien Ltd. expands its retail business through the acquisition of Van Horn, Inc.
In-Depth Potash Ores Market Market Outlook
The Potash Ores market is poised for sustained growth, driven by increasing global food demand, technological advancements, and strategic initiatives by key players. The focus on sustainable and efficient agricultural practices will further accelerate market expansion. Opportunities lie in untapped markets, innovation in fertilizer technology, and strategic collaborations to enhance market penetration and deliver superior value to customers.
Potash Ores Market Segmentation
- 1. Production Analysis
- 2. Consumption Analysis
- 3. Import Market Analysis (Value & Volume)
- 4. Export Market Analysis (Value & Volume)
- 5. Price Trend Analysis
Potash Ores Market Segmentation By Geography
-
1. North America
- 1.1. United States
- 1.2. Canada
- 1.3. Mexico
-
2. South America
- 2.1. Brazil
- 2.2. Argentina
- 2.3. Rest of South America
-
3. Europe
- 3.1. United Kingdom
- 3.2. Germany
- 3.3. France
- 3.4. Italy
- 3.5. Spain
- 3.6. Russia
- 3.7. Benelux
- 3.8. Nordics
- 3.9. Rest of Europe
-
4. Middle East & Africa
- 4.1. Turkey
- 4.2. Israel
- 4.3. GCC
- 4.4. North Africa
- 4.5. South Africa
- 4.6. Rest of Middle East & Africa
-
5. Asia Pacific
- 5.1. China
- 5.2. India
- 5.3. Japan
- 5.4. South Korea
- 5.5. ASEAN
- 5.6. Oceania
- 5.7. Rest of Asia Pacific
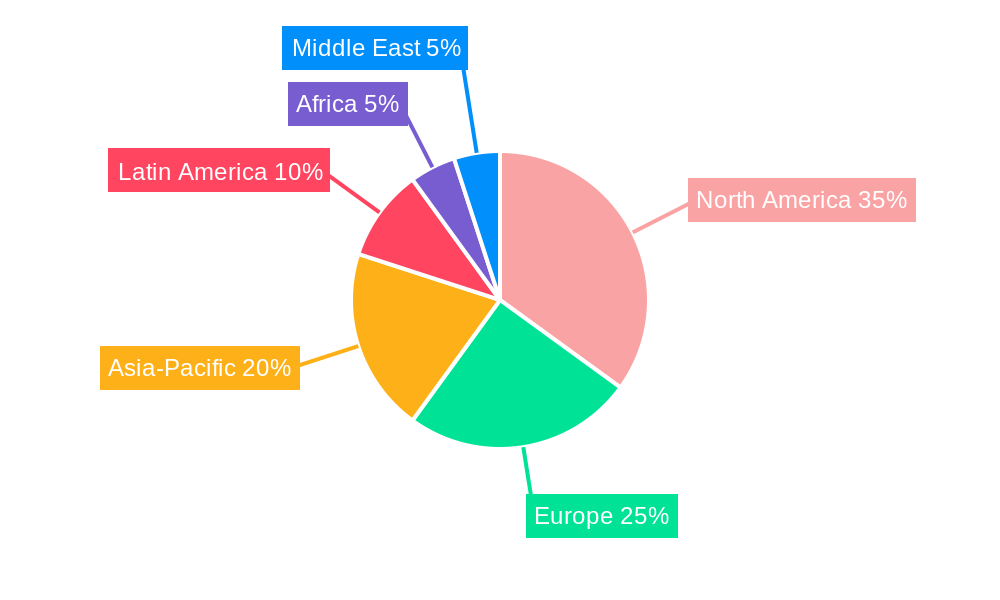
Potash Ores Market Regional Market Share
Geographic Coverage of Potash Ores Market
Potash Ores Market REPORT HIGHLIGHTS
| Aspects | Details |
|---|---|
| Study Period | 2020-2034 |
| Base Year | 2025 |
| Estimated Year | 2026 |
| Forecast Period | 2026-2034 |
| Historical Period | 2020-2025 |
| Growth Rate | CAGR of 8.9% from 2020-2034 |
| Segmentation |
|
Table of Contents
- 1. Introduction
- 1.1. Research Scope
- 1.2. Market Segmentation
- 1.3. Research Objective
- 1.4. Definitions and Assumptions
- 2. Executive Summary
- 2.1. Market Snapshot
- 3. Market Dynamics
- 3.1. Market Drivers
- 3.2. Market Restrains
- 3.3. Market Trends
- 3.4. Market Opportunities
- 4. Market Factor Analysis
- 4.1. Porters Five Forces
- 4.1.1. Bargaining Power of Suppliers
- 4.1.2. Bargaining Power of Buyers
- 4.1.3. Threat of New Entrants
- 4.1.4. Threat of Substitutes
- 4.1.5. Competitive Rivalry
- 4.2. PESTEL analysis
- 4.3. BCG Analysis
- 4.3.1. Stars (High Growth, High Market Share)
- 4.3.2. Cash Cows (Low Growth, High Market Share)
- 4.3.3. Question Mark (High Growth, Low Market Share)
- 4.3.4. Dogs (Low Growth, Low Market Share)
- 4.4. Ansoff Matrix Analysis
- 4.5. Supply Chain Analysis
- 4.6. Regulatory Landscape
- 4.7. Current Market Potential and Opportunity Assessment (TAM–SAM–SOM Framework)
- 4.8. VDR Analyst Note
- 4.1. Porters Five Forces
- 5. Market Analysis, Insights and Forecast 2021-2033
- 5.1. Market Analysis, Insights and Forecast - by Production Analysis
- 5.2. Market Analysis, Insights and Forecast - by Consumption Analysis
- 5.3. Market Analysis, Insights and Forecast - by Import Market Analysis (Value & Volume)
- 5.4. Market Analysis, Insights and Forecast - by Export Market Analysis (Value & Volume)
- 5.5. Market Analysis, Insights and Forecast - by Price Trend Analysis
- 5.6. Market Analysis, Insights and Forecast - by Region
- 5.6.1. North America
- 5.6.2. South America
- 5.6.3. Europe
- 5.6.4. Middle East & Africa
- 5.6.5. Asia Pacific
- 6. Global Potash Ores Market Analysis, Insights and Forecast, 2021-2033
- 6.1. Market Analysis, Insights and Forecast - by Production Analysis
- 6.2. Market Analysis, Insights and Forecast - by Consumption Analysis
- 6.3. Market Analysis, Insights and Forecast - by Import Market Analysis (Value & Volume)
- 6.4. Market Analysis, Insights and Forecast - by Export Market Analysis (Value & Volume)
- 6.5. Market Analysis, Insights and Forecast - by Price Trend Analysis
- 7. North America Potash Ores Market Analysis, Insights and Forecast, 2021-2033
- 7.1. Market Analysis, Insights and Forecast - by Production Analysis
- 7.2. Market Analysis, Insights and Forecast - by Consumption Analysis
- 7.3. Market Analysis, Insights and Forecast - by Import Market Analysis (Value & Volume)
- 7.4. Market Analysis, Insights and Forecast - by Export Market Analysis (Value & Volume)
- 7.5. Market Analysis, Insights and Forecast - by Price Trend Analysis
- 8. South America Potash Ores Market Analysis, Insights and Forecast, 2021-2033
- 8.1. Market Analysis, Insights and Forecast - by Production Analysis
- 8.2. Market Analysis, Insights and Forecast - by Consumption Analysis
- 8.3. Market Analysis, Insights and Forecast - by Import Market Analysis (Value & Volume)
- 8.4. Market Analysis, Insights and Forecast - by Export Market Analysis (Value & Volume)
- 8.5. Market Analysis, Insights and Forecast - by Price Trend Analysis
- 9. Europe Potash Ores Market Analysis, Insights and Forecast, 2021-2033
- 9.1. Market Analysis, Insights and Forecast - by Production Analysis
- 9.2. Market Analysis, Insights and Forecast - by Consumption Analysis
- 9.3. Market Analysis, Insights and Forecast - by Import Market Analysis (Value & Volume)
- 9.4. Market Analysis, Insights and Forecast - by Export Market Analysis (Value & Volume)
- 9.5. Market Analysis, Insights and Forecast - by Price Trend Analysis
- 10. Middle East & Africa Potash Ores Market Analysis, Insights and Forecast, 2021-2033
- 10.1. Market Analysis, Insights and Forecast - by Production Analysis
- 10.2. Market Analysis, Insights and Forecast - by Consumption Analysis
- 10.3. Market Analysis, Insights and Forecast - by Import Market Analysis (Value & Volume)
- 10.4. Market Analysis, Insights and Forecast - by Export Market Analysis (Value & Volume)
- 10.5. Market Analysis, Insights and Forecast - by Price Trend Analysis
- 11. Asia Pacific Potash Ores Market Analysis, Insights and Forecast, 2021-2033
- 11.1. Market Analysis, Insights and Forecast - by Production Analysis
- 11.2. Market Analysis, Insights and Forecast - by Consumption Analysis
- 11.3. Market Analysis, Insights and Forecast - by Import Market Analysis (Value & Volume)
- 11.4. Market Analysis, Insights and Forecast - by Export Market Analysis (Value & Volume)
- 11.5. Market Analysis, Insights and Forecast - by Price Trend Analysis
- 12. Competitive Analysis
- 12.1. Company Profiles
- 12.1.1 The Mosaic Co
- 12.1.1.1. Company Overview
- 12.1.1.2. Products
- 12.1.1.3. Company Financials
- 12.1.1.4. SWOT Analysis
- 12.1.2 Coromandel International Ltd
- 12.1.2.1. Company Overview
- 12.1.2.2. Products
- 12.1.2.3. Company Financials
- 12.1.2.4. SWOT Analysis
- 12.1.3 Nutrien Limited
- 12.1.3.1. Company Overview
- 12.1.3.2. Products
- 12.1.3.3. Company Financials
- 12.1.3.4. SWOT Analysis
- 12.1.4 Sociedad Química y Minera (SQM)
- 12.1.4.1. Company Overview
- 12.1.4.2. Products
- 12.1.4.3. Company Financials
- 12.1.4.4. SWOT Analysis
- 12.1.5 Petrokemija DD Fertilizer Factory
- 12.1.5.1. Company Overview
- 12.1.5.2. Products
- 12.1.5.3. Company Financials
- 12.1.5.4. SWOT Analysis
- 12.1.6 Sinofert Holdings Ltd
- 12.1.6.1. Company Overview
- 12.1.6.2. Products
- 12.1.6.3. Company Financials
- 12.1.6.4. SWOT Analysis
- 12.1.7 Eurochem
- 12.1.7.1. Company Overview
- 12.1.7.2. Products
- 12.1.7.3. Company Financials
- 12.1.7.4. SWOT Analysis
- 12.1.8 Intrepid Potash Inc
- 12.1.8.1. Company Overview
- 12.1.8.2. Products
- 12.1.8.3. Company Financials
- 12.1.8.4. SWOT Analysis
- 12.1.9 K+S AKTIENGESELLSCHAFT
- 12.1.9.1. Company Overview
- 12.1.9.2. Products
- 12.1.9.3. Company Financials
- 12.1.9.4. SWOT Analysis
- 12.1.1 The Mosaic Co
- 12.2. Market Entropy
- 12.2.1 Company's Key Areas Served
- 12.2.2 Recent Developments
- 12.3. Company Market Share Analysis 2025
- 12.3.1 Top 5 Companies Market Share Analysis
- 12.3.2 Top 3 Companies Market Share Analysis
- 12.4. List of Potential Customers
- 13. Research Methodology
List of Figures
- Figure 1: Global Potash Ores Market Revenue Breakdown (billion, %) by Region 2025 & 2033
- Figure 2: North America Potash Ores Market Revenue (billion), by Production Analysis 2025 & 2033
- Figure 3: North America Potash Ores Market Revenue Share (%), by Production Analysis 2025 & 2033
- Figure 4: North America Potash Ores Market Revenue (billion), by Consumption Analysis 2025 & 2033
- Figure 5: North America Potash Ores Market Revenue Share (%), by Consumption Analysis 2025 & 2033
- Figure 6: North America Potash Ores Market Revenue (billion), by Import Market Analysis (Value & Volume) 2025 & 2033
- Figure 7: North America Potash Ores Market Revenue Share (%), by Import Market Analysis (Value & Volume) 2025 & 2033
- Figure 8: North America Potash Ores Market Revenue (billion), by Export Market Analysis (Value & Volume) 2025 & 2033
- Figure 9: North America Potash Ores Market Revenue Share (%), by Export Market Analysis (Value & Volume) 2025 & 2033
- Figure 10: North America Potash Ores Market Revenue (billion), by Price Trend Analysis 2025 & 2033
- Figure 11: North America Potash Ores Market Revenue Share (%), by Price Trend Analysis 2025 & 2033
- Figure 12: North America Potash Ores Market Revenue (billion), by Country 2025 & 2033
- Figure 13: North America Potash Ores Market Revenue Share (%), by Country 2025 & 2033
- Figure 14: South America Potash Ores Market Revenue (billion), by Production Analysis 2025 & 2033
- Figure 15: South America Potash Ores Market Revenue Share (%), by Production Analysis 2025 & 2033
- Figure 16: South America Potash Ores Market Revenue (billion), by Consumption Analysis 2025 & 2033
- Figure 17: South America Potash Ores Market Revenue Share (%), by Consumption Analysis 2025 & 2033
- Figure 18: South America Potash Ores Market Revenue (billion), by Import Market Analysis (Value & Volume) 2025 & 2033
- Figure 19: South America Potash Ores Market Revenue Share (%), by Import Market Analysis (Value & Volume) 2025 & 2033
- Figure 20: South America Potash Ores Market Revenue (billion), by Export Market Analysis (Value & Volume) 2025 & 2033
- Figure 21: South America Potash Ores Market Revenue Share (%), by Export Market Analysis (Value & Volume) 2025 & 2033
- Figure 22: South America Potash Ores Market Revenue (billion), by Price Trend Analysis 2025 & 2033
- Figure 23: South America Potash Ores Market Revenue Share (%), by Price Trend Analysis 2025 & 2033
- Figure 24: South America Potash Ores Market Revenue (billion), by Country 2025 & 2033
- Figure 25: South America Potash Ores Market Revenue Share (%), by Country 2025 & 2033
- Figure 26: Europe Potash Ores Market Revenue (billion), by Production Analysis 2025 & 2033
- Figure 27: Europe Potash Ores Market Revenue Share (%), by Production Analysis 2025 & 2033
- Figure 28: Europe Potash Ores Market Revenue (billion), by Consumption Analysis 2025 & 2033
- Figure 29: Europe Potash Ores Market Revenue Share (%), by Consumption Analysis 2025 & 2033
- Figure 30: Europe Potash Ores Market Revenue (billion), by Import Market Analysis (Value & Volume) 2025 & 2033
- Figure 31: Europe Potash Ores Market Revenue Share (%), by Import Market Analysis (Value & Volume) 2025 & 2033
- Figure 32: Europe Potash Ores Market Revenue (billion), by Export Market Analysis (Value & Volume) 2025 & 2033
- Figure 33: Europe Potash Ores Market Revenue Share (%), by Export Market Analysis (Value & Volume) 2025 & 2033
- Figure 34: Europe Potash Ores Market Revenue (billion), by Price Trend Analysis 2025 & 2033
- Figure 35: Europe Potash Ores Market Revenue Share (%), by Price Trend Analysis 2025 & 2033
- Figure 36: Europe Potash Ores Market Revenue (billion), by Country 2025 & 2033
- Figure 37: Europe Potash Ores Market Revenue Share (%), by Country 2025 & 2033
- Figure 38: Middle East & Africa Potash Ores Market Revenue (billion), by Production Analysis 2025 & 2033
- Figure 39: Middle East & Africa Potash Ores Market Revenue Share (%), by Production Analysis 2025 & 2033
- Figure 40: Middle East & Africa Potash Ores Market Revenue (billion), by Consumption Analysis 2025 & 2033
- Figure 41: Middle East & Africa Potash Ores Market Revenue Share (%), by Consumption Analysis 2025 & 2033
- Figure 42: Middle East & Africa Potash Ores Market Revenue (billion), by Import Market Analysis (Value & Volume) 2025 & 2033
- Figure 43: Middle East & Africa Potash Ores Market Revenue Share (%), by Import Market Analysis (Value & Volume) 2025 & 2033
- Figure 44: Middle East & Africa Potash Ores Market Revenue (billion), by Export Market Analysis (Value & Volume) 2025 & 2033
- Figure 45: Middle East & Africa Potash Ores Market Revenue Share (%), by Export Market Analysis (Value & Volume) 2025 & 2033
- Figure 46: Middle East & Africa Potash Ores Market Revenue (billion), by Price Trend Analysis 2025 & 2033
- Figure 47: Middle East & Africa Potash Ores Market Revenue Share (%), by Price Trend Analysis 2025 & 2033
- Figure 48: Middle East & Africa Potash Ores Market Revenue (billion), by Country 2025 & 2033
- Figure 49: Middle East & Africa Potash Ores Market Revenue Share (%), by Country 2025 & 2033
- Figure 50: Asia Pacific Potash Ores Market Revenue (billion), by Production Analysis 2025 & 2033
- Figure 51: Asia Pacific Potash Ores Market Revenue Share (%), by Production Analysis 2025 & 2033
- Figure 52: Asia Pacific Potash Ores Market Revenue (billion), by Consumption Analysis 2025 & 2033
- Figure 53: Asia Pacific Potash Ores Market Revenue Share (%), by Consumption Analysis 2025 & 2033
- Figure 54: Asia Pacific Potash Ores Market Revenue (billion), by Import Market Analysis (Value & Volume) 2025 & 2033
- Figure 55: Asia Pacific Potash Ores Market Revenue Share (%), by Import Market Analysis (Value & Volume) 2025 & 2033
- Figure 56: Asia Pacific Potash Ores Market Revenue (billion), by Export Market Analysis (Value & Volume) 2025 & 2033
- Figure 57: Asia Pacific Potash Ores Market Revenue Share (%), by Export Market Analysis (Value & Volume) 2025 & 2033
- Figure 58: Asia Pacific Potash Ores Market Revenue (billion), by Price Trend Analysis 2025 & 2033
- Figure 59: Asia Pacific Potash Ores Market Revenue Share (%), by Price Trend Analysis 2025 & 2033
- Figure 60: Asia Pacific Potash Ores Market Revenue (billion), by Country 2025 & 2033
- Figure 61: Asia Pacific Potash Ores Market Revenue Share (%), by Country 2025 & 2033
List of Tables
- Table 1: Global Potash Ores Market Revenue billion Forecast, by Production Analysis 2020 & 2033
- Table 2: Global Potash Ores Market Revenue billion Forecast, by Consumption Analysis 2020 & 2033
- Table 3: Global Potash Ores Market Revenue billion Forecast, by Import Market Analysis (Value & Volume) 2020 & 2033
- Table 4: Global Potash Ores Market Revenue billion Forecast, by Export Market Analysis (Value & Volume) 2020 & 2033
- Table 5: Global Potash Ores Market Revenue billion Forecast, by Price Trend Analysis 2020 & 2033
- Table 6: Global Potash Ores Market Revenue billion Forecast, by Region 2020 & 2033
- Table 7: Global Potash Ores Market Revenue billion Forecast, by Production Analysis 2020 & 2033
- Table 8: Global Potash Ores Market Revenue billion Forecast, by Consumption Analysis 2020 & 2033
- Table 9: Global Potash Ores Market Revenue billion Forecast, by Import Market Analysis (Value & Volume) 2020 & 2033
- Table 10: Global Potash Ores Market Revenue billion Forecast, by Export Market Analysis (Value & Volume) 2020 & 2033
- Table 11: Global Potash Ores Market Revenue billion Forecast, by Price Trend Analysis 2020 & 2033
- Table 12: Global Potash Ores Market Revenue billion Forecast, by Country 2020 & 2033
- Table 13: United States Potash Ores Market Revenue (billion) Forecast, by Application 2020 & 2033
- Table 14: Canada Potash Ores Market Revenue (billion) Forecast, by Application 2020 & 2033
- Table 15: Mexico Potash Ores Market Revenue (billion) Forecast, by Application 2020 & 2033
- Table 16: Global Potash Ores Market Revenue billion Forecast, by Production Analysis 2020 & 2033
- Table 17: Global Potash Ores Market Revenue billion Forecast, by Consumption Analysis 2020 & 2033
- Table 18: Global Potash Ores Market Revenue billion Forecast, by Import Market Analysis (Value & Volume) 2020 & 2033
- Table 19: Global Potash Ores Market Revenue billion Forecast, by Export Market Analysis (Value & Volume) 2020 & 2033
- Table 20: Global Potash Ores Market Revenue billion Forecast, by Price Trend Analysis 2020 & 2033
- Table 21: Global Potash Ores Market Revenue billion Forecast, by Country 2020 & 2033
- Table 22: Brazil Potash Ores Market Revenue (billion) Forecast, by Application 2020 & 2033
- Table 23: Argentina Potash Ores Market Revenue (billion) Forecast, by Application 2020 & 2033
- Table 24: Rest of South America Potash Ores Market Revenue (billion) Forecast, by Application 2020 & 2033
- Table 25: Global Potash Ores Market Revenue billion Forecast, by Production Analysis 2020 & 2033
- Table 26: Global Potash Ores Market Revenue billion Forecast, by Consumption Analysis 2020 & 2033
- Table 27: Global Potash Ores Market Revenue billion Forecast, by Import Market Analysis (Value & Volume) 2020 & 2033
- Table 28: Global Potash Ores Market Revenue billion Forecast, by Export Market Analysis (Value & Volume) 2020 & 2033
- Table 29: Global Potash Ores Market Revenue billion Forecast, by Price Trend Analysis 2020 & 2033
- Table 30: Global Potash Ores Market Revenue billion Forecast, by Country 2020 & 2033
- Table 31: United Kingdom Potash Ores Market Revenue (billion) Forecast, by Application 2020 & 2033
- Table 32: Germany Potash Ores Market Revenue (billion) Forecast, by Application 2020 & 2033
- Table 33: France Potash Ores Market Revenue (billion) Forecast, by Application 2020 & 2033
- Table 34: Italy Potash Ores Market Revenue (billion) Forecast, by Application 2020 & 2033
- Table 35: Spain Potash Ores Market Revenue (billion) Forecast, by Application 2020 & 2033
- Table 36: Russia Potash Ores Market Revenue (billion) Forecast, by Application 2020 & 2033
- Table 37: Benelux Potash Ores Market Revenue (billion) Forecast, by Application 2020 & 2033
- Table 38: Nordics Potash Ores Market Revenue (billion) Forecast, by Application 2020 & 2033
- Table 39: Rest of Europe Potash Ores Market Revenue (billion) Forecast, by Application 2020 & 2033
- Table 40: Global Potash Ores Market Revenue billion Forecast, by Production Analysis 2020 & 2033
- Table 41: Global Potash Ores Market Revenue billion Forecast, by Consumption Analysis 2020 & 2033
- Table 42: Global Potash Ores Market Revenue billion Forecast, by Import Market Analysis (Value & Volume) 2020 & 2033
- Table 43: Global Potash Ores Market Revenue billion Forecast, by Export Market Analysis (Value & Volume) 2020 & 2033
- Table 44: Global Potash Ores Market Revenue billion Forecast, by Price Trend Analysis 2020 & 2033
- Table 45: Global Potash Ores Market Revenue billion Forecast, by Country 2020 & 2033
- Table 46: Turkey Potash Ores Market Revenue (billion) Forecast, by Application 2020 & 2033
- Table 47: Israel Potash Ores Market Revenue (billion) Forecast, by Application 2020 & 2033
- Table 48: GCC Potash Ores Market Revenue (billion) Forecast, by Application 2020 & 2033
- Table 49: North Africa Potash Ores Market Revenue (billion) Forecast, by Application 2020 & 2033
- Table 50: South Africa Potash Ores Market Revenue (billion) Forecast, by Application 2020 & 2033
- Table 51: Rest of Middle East & Africa Potash Ores Market Revenue (billion) Forecast, by Application 2020 & 2033
- Table 52: Global Potash Ores Market Revenue billion Forecast, by Production Analysis 2020 & 2033
- Table 53: Global Potash Ores Market Revenue billion Forecast, by Consumption Analysis 2020 & 2033
- Table 54: Global Potash Ores Market Revenue billion Forecast, by Import Market Analysis (Value & Volume) 2020 & 2033
- Table 55: Global Potash Ores Market Revenue billion Forecast, by Export Market Analysis (Value & Volume) 2020 & 2033
- Table 56: Global Potash Ores Market Revenue billion Forecast, by Price Trend Analysis 2020 & 2033
- Table 57: Global Potash Ores Market Revenue billion Forecast, by Country 2020 & 2033
- Table 58: China Potash Ores Market Revenue (billion) Forecast, by Application 2020 & 2033
- Table 59: India Potash Ores Market Revenue (billion) Forecast, by Application 2020 & 2033
- Table 60: Japan Potash Ores Market Revenue (billion) Forecast, by Application 2020 & 2033
- Table 61: South Korea Potash Ores Market Revenue (billion) Forecast, by Application 2020 & 2033
- Table 62: ASEAN Potash Ores Market Revenue (billion) Forecast, by Application 2020 & 2033
- Table 63: Oceania Potash Ores Market Revenue (billion) Forecast, by Application 2020 & 2033
- Table 64: Rest of Asia Pacific Potash Ores Market Revenue (billion) Forecast, by Application 2020 & 2033
Frequently Asked Questions
1. What is the projected Compound Annual Growth Rate (CAGR) of the Potash Ores Market?
The projected CAGR is approximately 8.9%.
2. Which companies are prominent players in the Potash Ores Market?
Key companies in the market include The Mosaic Co, Coromandel International Ltd, Nutrien Limited, Sociedad Química y Minera (SQM), Petrokemija DD Fertilizer Factory, Sinofert Holdings Ltd, Eurochem, Intrepid Potash Inc, K+S AKTIENGESELLSCHAFT.
3. What are the main segments of the Potash Ores Market?
The market segments include Production Analysis, Consumption Analysis, Import Market Analysis (Value & Volume), Export Market Analysis (Value & Volume), Price Trend Analysis.
4. Can you provide details about the market size?
The market size is estimated to be USD 66.11 billion as of 2022.
5. What are some drivers contributing to market growth?
Shortage of Skilled Labor; Government Support to Enhance Farm Mechanization.
6. What are the notable trends driving market growth?
MoP is the largest segment by Product..
7. Are there any restraints impacting market growth?
Heavy Initial Procurement Cost and High Expenditure on Maintenance.
8. Can you provide examples of recent developments in the market?
March 2022: EuroChem Group announced that it has completed the purchase of the share holding control of Brazilian distributor Fertilizantes Heringer SA, with 51.48% of the shares, further strengthening its production and distribution capacity in Brazil.March 2021: Mosaic announced a partnership with Sound Agriculture to develop and distribute a nutrient efficiency product. Sound Agriculture will focus on manufacturing of the active ingredient and product formulation, while Mosaic will oversee field development, regulatory, sales and marketing efforts. The product leverage Sound Agrculture Bio-inspired chemistry that activates the soil microbiome to give plants access to important nutrients and allow growers to optimize fertilizer inputs.It is expected to release in 2023 for US market.February 2019: Nutrien Ltd. acquired Van Horn, Inc. (Van Horn), a leading US retailer and agricultural services provider which serve over 5,000 customers in 18 counties to grow their Retail business.
9. What pricing options are available for accessing the report?
Pricing options include single-user, multi-user, and enterprise licenses priced at USD 3800, USD 4500, and USD 5800 respectively.
10. Is the market size provided in terms of value or volume?
The market size is provided in terms of value, measured in billion.
11. Are there any specific market keywords associated with the report?
Yes, the market keyword associated with the report is "Potash Ores Market," which aids in identifying and referencing the specific market segment covered.
12. How do I determine which pricing option suits my needs best?
The pricing options vary based on user requirements and access needs. Individual users may opt for single-user licenses, while businesses requiring broader access may choose multi-user or enterprise licenses for cost-effective access to the report.
13. Are there any additional resources or data provided in the Potash Ores Market report?
While the report offers comprehensive insights, it's advisable to review the specific contents or supplementary materials provided to ascertain if additional resources or data are available.
14. How can I stay updated on further developments or reports in the Potash Ores Market?
To stay informed about further developments, trends, and reports in the Potash Ores Market, consider subscribing to industry newsletters, following relevant companies and organizations, or regularly checking reputable industry news sources and publications.
Methodology
Step 1 - Identification of Relevant Samples Size from Population Database


Step 2 - Approaches for Defining Global Market Size (Value, Volume* & Price*)

Note*: In applicable scenarios
Step 3 - Data Sources
Primary Research
- Web Analytics
- Survey Reports
- Research Institute
- Latest Research Reports
- Opinion Leaders
Secondary Research
- Annual Reports
- White Paper
- Latest Press Release
- Industry Association
- Paid Database
- Investor Presentations

Step 4 - Data Triangulation
Involves using different sources of information in order to increase the validity of a study
These sources are likely to be stakeholders in a program - participants, other researchers, program staff, other community members, and so on.
Then we put all data in single framework & apply various statistical tools to find out the dynamic on the market.
During the analysis stage, feedback from the stakeholder groups would be compared to determine areas of agreement as well as areas of divergence