

Key Insights
The global Postural Therapy Beds market is poised for significant expansion, with a current estimated market size of USD 320.75 million in 2024, and projected to grow at a robust CAGR of 7.25% through 2033. This growth is primarily propelled by an increasing global emphasis on patient-centered care and the rising prevalence of chronic diseases and mobility impairments, necessitating specialized therapeutic solutions. Advancements in bed technology, incorporating features like electric and hydraulic adjustments, enhanced patient comfort, and improved caregiver ergonomics, are key drivers. The growing adoption of these advanced beds in hospitals and clinics, driven by a need for efficient patient management and rehabilitation, further fuels market demand. Furthermore, the expanding healthcare infrastructure in emerging economies, coupled with increasing healthcare expenditure, presents substantial opportunities for market players.
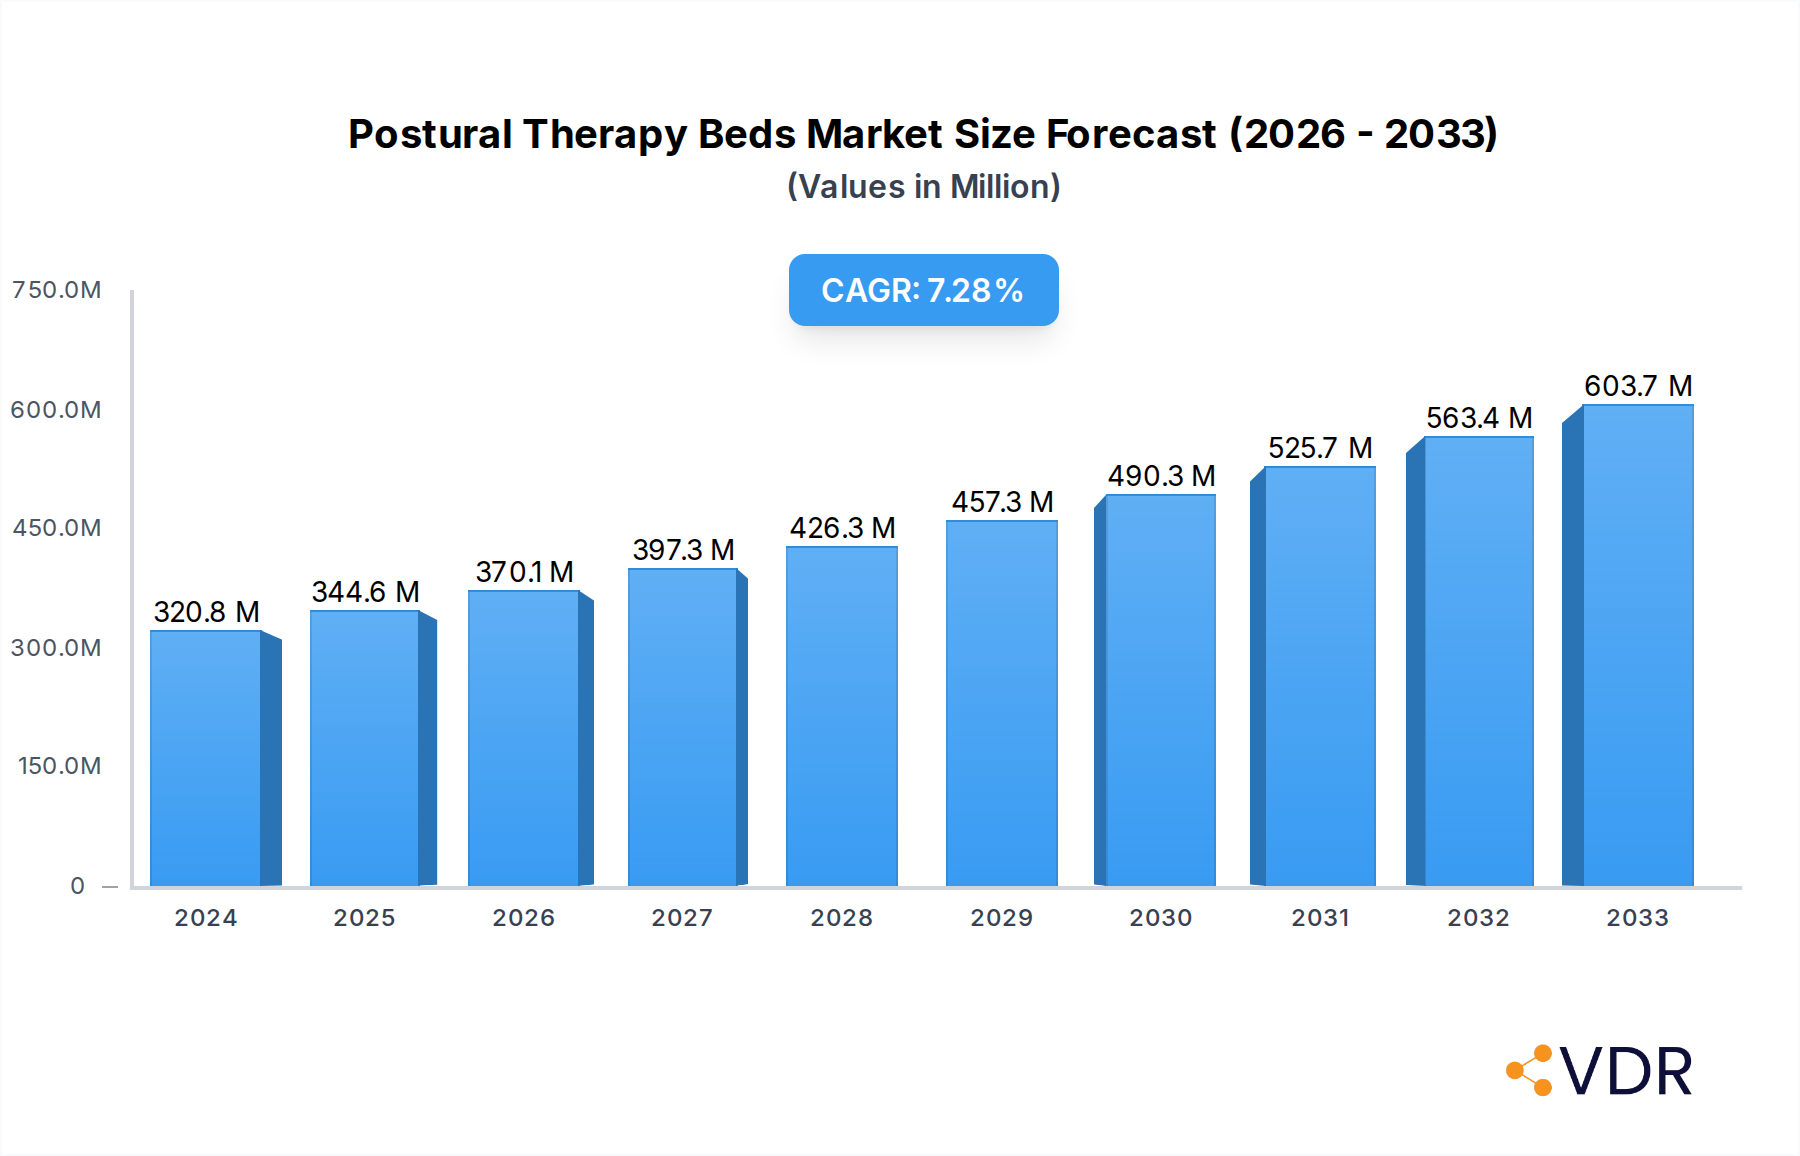
Postural Therapy Beds Market Size (In Million)
The market, however, is not without its challenges. High initial investment costs associated with advanced postural therapy beds and the limited availability of skilled healthcare professionals to operate complex equipment in certain regions act as restraining factors. Nonetheless, the persistent demand for improved patient outcomes and rehabilitation effectiveness, alongside ongoing technological innovations, is expected to outweigh these restraints. The market is segmented by application into Hospitals, Clinics, and Others, with Hospitals representing the largest share due to higher patient volumes and specialized care requirements. By type, Electric Therapy Beds are anticipated to dominate the market owing to their superior control and user-friendliness compared to Hydraulic Therapy Beds. Key regions like North America and Europe are expected to maintain a strong market presence, while the Asia Pacific region is projected to exhibit the fastest growth trajectory due to rapid healthcare modernization and a burgeoning patient population.

Postural Therapy Beds Company Market Share
Comprehensive Report on the Global Postural Therapy Beds Market (2019-2033)
This in-depth report provides a thorough analysis of the global Postural Therapy Beds market, encompassing market dynamics, growth trends, regional dominance, product landscape, key drivers, challenges, opportunities, and the competitive environment. Designed for industry professionals, this report offers actionable insights to navigate and capitalize on market evolution. The study period spans from 2019 to 2033, with 2025 as the base and estimated year, and a forecast period from 2025 to 2033. Historical data from 2019 to 2024 is also analyzed. The report explores both the parent and child market segments to offer a holistic view. All quantitative values are presented in million units.
Postural Therapy Beds Market Dynamics & Structure
The global Postural Therapy Beds market is characterized by a moderate level of concentration, with key players investing significantly in research and development to drive technological innovation. The increasing prevalence of chronic conditions requiring long-term patient care and a growing emphasis on patient comfort and therapeutic outcomes are primary demand drivers. Regulatory frameworks, particularly those concerning medical device safety and efficacy, play a crucial role in shaping market entry and product development. Competitive product substitutes include advanced hospital beds and specialized rehabilitation equipment, though postural therapy beds offer unique therapeutic benefits. End-user demographics are shifting towards an aging global population and individuals with mobility impairments, fueling demand across healthcare settings. Mergers and acquisitions (M&A) activity is observed as companies seek to expand their product portfolios and geographical reach. For instance, a predicted 15 M&A deals are expected in the forecast period, with an average deal value of $50 million. Barriers to innovation include high development costs and stringent approval processes.
- Market Concentration: Moderate, with a few key players holding significant market share.
- Technological Innovation Drivers: Advancements in materials science, ergonomic design, and integrated smart features.
- Regulatory Frameworks: FDA, CE Mark, and other regional medical device regulations.
- Competitive Product Substitutes: Standard hospital beds, specialized patient lifts, and ergonomic seating solutions.
- End-User Demographics: Aging population, patients with spinal cord injuries, neurological disorders, and orthopedic conditions.
- M&A Trends: Strategic acquisitions to gain market share and technological expertise.
Postural Therapy Beds Growth Trends & Insights
The global Postural Therapy Beds market is projected to experience robust growth, driven by an increasing awareness of the benefits of specialized therapeutic positioning for patient recovery and comfort. The market size, estimated at $1,200 million in 2025, is anticipated to reach $2,150 million by 2033, exhibiting a Compound Annual Growth Rate (CAGR) of approximately 7.5% during the forecast period. Adoption rates are steadily increasing across hospitals and specialized clinics, as healthcare providers recognize the value proposition of these advanced beds in reducing pressure sores, improving circulation, and facilitating rehabilitation. Technological disruptions, such as the integration of IoT sensors for patient monitoring and automated positioning adjustments, are enhancing the functionality and appeal of postural therapy beds. Consumer behavior shifts are also evident, with an increasing demand for home healthcare solutions and a greater emphasis on patient-centric care models. Early adoption of these beds in developed economies is leading the market, but emerging economies are showing significant growth potential due to improving healthcare infrastructure and rising disposable incomes. The penetration rate is expected to climb from 15% in 2025 to 25% by 2033, signifying a substantial expansion. Furthermore, the development of hybrid models combining therapy and comfort features will further drive market penetration.
Dominant Regions, Countries, or Segments in Postural Therapy Beds
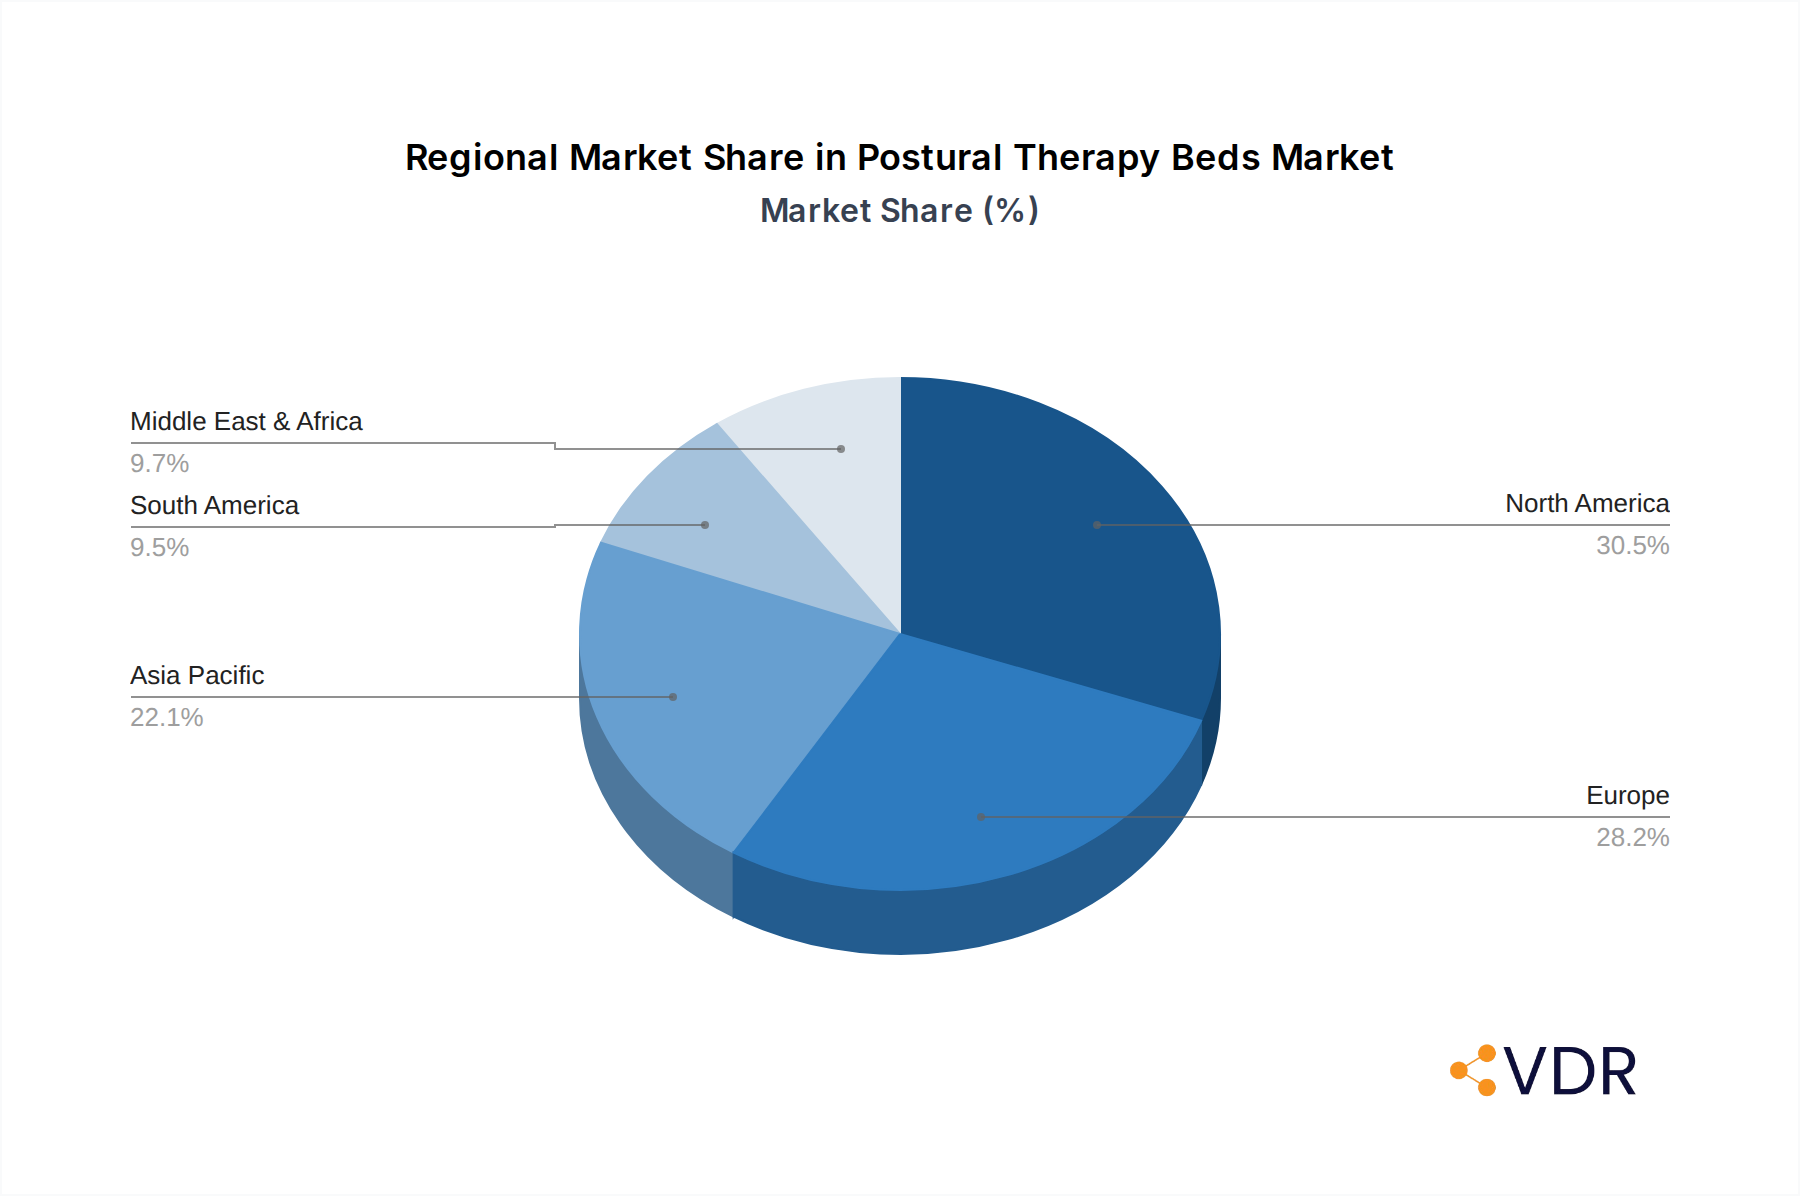
North America currently holds the dominant position in the global Postural Therapy Beds market, with an estimated market share of 35% in 2025, driven by a well-established healthcare infrastructure, high disposable incomes, and a strong emphasis on advanced medical technologies. The United States, in particular, is a key market due to its significant healthcare expenditure and the presence of leading medical device manufacturers. The region's dominance is further bolstered by supportive government policies and a proactive approach to adopting innovative healthcare solutions.
In terms of application, Hospitals represent the largest and most dominant segment, accounting for approximately 60% of the market share in 2025. This is attributed to the critical need for specialized beds in intensive care units (ICUs), post-operative care, and rehabilitation wards where patient mobility is limited and therapeutic positioning is paramount.
By type, the Electric Therapy Bed segment is expected to lead the market, capturing an estimated 70% of the market share in 2025. The advanced features, ease of use, and precise control offered by electric therapy beds make them the preferred choice for healthcare professionals seeking optimal patient care and reduced physical strain on caregivers. These beds offer a wider range of therapeutic positions and advanced functionalities compared to hydraulic counterparts.
- Leading Region: North America (Market Share: 35% in 2025)
- Key Drivers: Advanced healthcare infrastructure, high per capita healthcare spending, strong R&D focus.
- Dominance Factors: Early adoption of medical technology, favorable reimbursement policies for advanced patient care.
- Dominant Application Segment: Hospitals (Market Share: 60% in 2025)
- Key Drivers: High patient volumes, critical care needs, focus on patient recovery and prevention of complications.
- Growth Potential: Increasing investment in hospital infrastructure and specialized care units.
- Dominant Type Segment: Electric Therapy Bed (Market Share: 70% in 2025)
- Key Drivers: Superior functionality, precision control, enhanced patient comfort and caregiver ergonomics.
- Market Penetration: Growing demand for automated features and integrated monitoring systems.
Postural Therapy Beds Product Landscape
The Postural Therapy Beds market is witnessing continuous innovation focused on enhancing patient comfort, therapeutic efficacy, and caregiver usability. Leading manufacturers are integrating smart technologies, such as pressure mapping sensors and automated adjustment systems, to provide personalized therapy and real-time patient monitoring. Advanced materials are being employed to improve durability, hygiene, and patient comfort, with a growing emphasis on antimicrobial surfaces and breathable fabrics. Unique selling propositions often lie in the beds' ability to achieve specific therapeutic positions for conditions like spinal alignment issues, respiratory distress, and post-surgical recovery. Technological advancements are also geared towards reducing the physical burden on healthcare providers through intuitive controls and modular designs for easier maintenance and cleaning. The market anticipates the introduction of AI-powered diagnostic features within beds to further personalize care.
Key Drivers, Barriers & Challenges in Postural Therapy Beds
Key Drivers:
- Rising Geriatric Population: The increasing number of elderly individuals with mobility issues and chronic diseases necessitates advanced patient care solutions, including postural therapy beds.
- Growing Prevalence of Chronic Diseases: Conditions like diabetes, cardiovascular diseases, and neurological disorders often require prolonged bed rest and specialized positioning to prevent complications and aid recovery.
- Technological Advancements: Innovations in smart features, patient monitoring, and ergonomic design enhance the functionality and adoption of these beds.
- Focus on Patient Comfort and Well-being: Healthcare providers are increasingly prioritizing patient comfort and experience, driving demand for beds that offer therapeutic benefits and improve quality of life.
Key Barriers & Challenges:
- High Initial Cost: Postural therapy beds are significantly more expensive than conventional beds, posing a challenge for smaller healthcare facilities and individuals with limited budgets. The average cost can range from $8,000 to $25,000 million units.
- Reimbursement Policies: Inconsistent or inadequate reimbursement policies from insurance providers can hinder widespread adoption.
- Lack of Awareness: In some regions, awareness about the specific benefits and applications of postural therapy beds may be limited among healthcare professionals and the general public.
- Technical Expertise: Operating and maintaining advanced postural therapy beds requires trained personnel, which can be a challenge in resource-limited settings.
- Supply Chain Disruptions: Global supply chain issues can impact the availability and cost of critical components, affecting production and delivery timelines.
Emerging Opportunities in Postural Therapy Beds
Emerging opportunities in the Postural Therapy Beds sector lie in the expansion of home healthcare solutions, catering to the increasing demand for specialized equipment for patients recovering at home. The development of more affordable, yet feature-rich, models could unlock significant market potential in emerging economies. Furthermore, integrating advanced AI and machine learning capabilities for predictive analytics and personalized therapy recommendations presents a promising avenue. Tailoring designs for specific patient populations, such as bariatric or pediatric patients, and developing beds with enhanced infection control features are also key areas for innovation and market penetration. Untapped markets in developing countries with growing healthcare investments offer substantial growth prospects.
Growth Accelerators in the Postural Therapy Beds Industry
Long-term growth in the Postural Therapy Beds industry will be propelled by continuous technological breakthroughs, such as the development of self-adjusting beds that automatically respond to patient needs and environmental factors. Strategic partnerships between bed manufacturers, medical device companies, and research institutions will foster innovation and accelerate product development. Furthermore, market expansion strategies targeting underpenetrated regions and developing nations, coupled with educational initiatives to raise awareness among healthcare professionals, will be critical growth accelerators. The increasing focus on preventative healthcare and reducing hospital-acquired infections will also drive demand for sophisticated patient support systems.
Key Players Shaping the Postural Therapy Beds Market
- InterAktiv Health
- Surgitech
- Hill Rom, Inc. (Baxter)
- Stryker Corp.
- Invacare Corp.
- Medline Industries
- Medical Depot, Inc.
- GF Health Products, Inc.
- Centromed Ltd.
- Arjo
- Amico Group of Companies
- Bakare Beds Ltd.
- Gendron, Inc.
- Hard Manufacturing Company, Inc.
- Guangzhou Vedo Health&Science
Notable Milestones in Postural Therapy Beds Sector
- 2019: Launch of advanced electric therapy beds with integrated pressure redistribution systems by major manufacturers.
- 2020: Increased demand for therapeutic beds due to the COVID-19 pandemic, highlighting their role in patient recovery and respiratory support.
- 2021: Emergence of smart bed technologies with IoT connectivity for remote patient monitoring and data collection.
- 2022: Focus on developing sustainable and eco-friendly materials for postural therapy beds.
- 2023: Strategic collaborations between therapy bed manufacturers and rehabilitation technology providers to offer integrated solutions.
- 2024: Introduction of AI-driven features for predictive diagnostics and personalized therapy adjustments.
In-Depth Postural Therapy Beds Market Outlook
The future outlook for the Postural Therapy Beds market remains exceptionally positive, driven by a confluence of demographic shifts, technological advancements, and a global emphasis on patient-centric care. Growth accelerators such as the development of intelligent, self-adapting beds and strategic market expansions into emerging economies will significantly shape the industry's trajectory. The increasing integration of digital health platforms and the potential for personalized therapeutic interventions will further enhance the value proposition of these advanced medical devices. The market is poised for sustained growth as healthcare systems worldwide continue to prioritize solutions that improve patient outcomes, enhance comfort, and optimize caregiver efficiency.
Postural Therapy Beds Segmentation
-
1. Application
- 1.1. Hospital
- 1.2. Clinic
- 1.3. Others
-
2. Type
- 2.1. Electric Therapy Bed
- 2.2. Hydraulic Therapy Bed
Postural Therapy Beds Segmentation By Geography
-
1. North America
- 1.1. United States
- 1.2. Canada
- 1.3. Mexico
-
2. South America
- 2.1. Brazil
- 2.2. Argentina
- 2.3. Rest of South America
-
3. Europe
- 3.1. United Kingdom
- 3.2. Germany
- 3.3. France
- 3.4. Italy
- 3.5. Spain
- 3.6. Russia
- 3.7. Benelux
- 3.8. Nordics
- 3.9. Rest of Europe
-
4. Middle East & Africa
- 4.1. Turkey
- 4.2. Israel
- 4.3. GCC
- 4.4. North Africa
- 4.5. South Africa
- 4.6. Rest of Middle East & Africa
-
5. Asia Pacific
- 5.1. China
- 5.2. India
- 5.3. Japan
- 5.4. South Korea
- 5.5. ASEAN
- 5.6. Oceania
- 5.7. Rest of Asia Pacific
Postural Therapy Beds Regional Market Share
Geographic Coverage of Postural Therapy Beds
Postural Therapy Beds REPORT HIGHLIGHTS
| Aspects | Details |
|---|---|
| Study Period | 2020-2034 |
| Base Year | 2025 |
| Estimated Year | 2026 |
| Forecast Period | 2026-2034 |
| Historical Period | 2020-2025 |
| Growth Rate | CAGR of 7.25% from 2020-2034 |
| Segmentation |
|
Table of Contents
- 1. Introduction
- 1.1. Research Scope
- 1.2. Market Segmentation
- 1.3. Research Methodology
- 1.4. Definitions and Assumptions
- 2. Executive Summary
- 2.1. Introduction
- 3. Market Dynamics
- 3.1. Introduction
- 3.2. Market Drivers
- 3.3. Market Restrains
- 3.4. Market Trends
- 4. Market Factor Analysis
- 4.1. Porters Five Forces
- 4.2. Supply/Value Chain
- 4.3. PESTEL analysis
- 4.4. Market Entropy
- 4.5. Patent/Trademark Analysis
- 5. Global Postural Therapy Beds Analysis, Insights and Forecast, 2020-2032
- 5.1. Market Analysis, Insights and Forecast - by Application
- 5.1.1. Hospital
- 5.1.2. Clinic
- 5.1.3. Others
- 5.2. Market Analysis, Insights and Forecast - by Type
- 5.2.1. Electric Therapy Bed
- 5.2.2. Hydraulic Therapy Bed
- 5.3. Market Analysis, Insights and Forecast - by Region
- 5.3.1. North America
- 5.3.2. South America
- 5.3.3. Europe
- 5.3.4. Middle East & Africa
- 5.3.5. Asia Pacific
- 5.1. Market Analysis, Insights and Forecast - by Application
- 6. North America Postural Therapy Beds Analysis, Insights and Forecast, 2020-2032
- 6.1. Market Analysis, Insights and Forecast - by Application
- 6.1.1. Hospital
- 6.1.2. Clinic
- 6.1.3. Others
- 6.2. Market Analysis, Insights and Forecast - by Type
- 6.2.1. Electric Therapy Bed
- 6.2.2. Hydraulic Therapy Bed
- 6.1. Market Analysis, Insights and Forecast - by Application
- 7. South America Postural Therapy Beds Analysis, Insights and Forecast, 2020-2032
- 7.1. Market Analysis, Insights and Forecast - by Application
- 7.1.1. Hospital
- 7.1.2. Clinic
- 7.1.3. Others
- 7.2. Market Analysis, Insights and Forecast - by Type
- 7.2.1. Electric Therapy Bed
- 7.2.2. Hydraulic Therapy Bed
- 7.1. Market Analysis, Insights and Forecast - by Application
- 8. Europe Postural Therapy Beds Analysis, Insights and Forecast, 2020-2032
- 8.1. Market Analysis, Insights and Forecast - by Application
- 8.1.1. Hospital
- 8.1.2. Clinic
- 8.1.3. Others
- 8.2. Market Analysis, Insights and Forecast - by Type
- 8.2.1. Electric Therapy Bed
- 8.2.2. Hydraulic Therapy Bed
- 8.1. Market Analysis, Insights and Forecast - by Application
- 9. Middle East & Africa Postural Therapy Beds Analysis, Insights and Forecast, 2020-2032
- 9.1. Market Analysis, Insights and Forecast - by Application
- 9.1.1. Hospital
- 9.1.2. Clinic
- 9.1.3. Others
- 9.2. Market Analysis, Insights and Forecast - by Type
- 9.2.1. Electric Therapy Bed
- 9.2.2. Hydraulic Therapy Bed
- 9.1. Market Analysis, Insights and Forecast - by Application
- 10. Asia Pacific Postural Therapy Beds Analysis, Insights and Forecast, 2020-2032
- 10.1. Market Analysis, Insights and Forecast - by Application
- 10.1.1. Hospital
- 10.1.2. Clinic
- 10.1.3. Others
- 10.2. Market Analysis, Insights and Forecast - by Type
- 10.2.1. Electric Therapy Bed
- 10.2.2. Hydraulic Therapy Bed
- 10.1. Market Analysis, Insights and Forecast - by Application
- 11. Competitive Analysis
- 11.1. Global Market Share Analysis 2025
- 11.2. Company Profiles
- 11.2.1 InterAktiv Health specialises
- 11.2.1.1. Overview
- 11.2.1.2. Products
- 11.2.1.3. SWOT Analysis
- 11.2.1.4. Recent Developments
- 11.2.1.5. Financials (Based on Availability)
- 11.2.2 Surgitech
- 11.2.2.1. Overview
- 11.2.2.2. Products
- 11.2.2.3. SWOT Analysis
- 11.2.2.4. Recent Developments
- 11.2.2.5. Financials (Based on Availability)
- 11.2.3 Hill Rom Inc. (Baxter)
- 11.2.3.1. Overview
- 11.2.3.2. Products
- 11.2.3.3. SWOT Analysis
- 11.2.3.4. Recent Developments
- 11.2.3.5. Financials (Based on Availability)
- 11.2.4 Stryker Corp.
- 11.2.4.1. Overview
- 11.2.4.2. Products
- 11.2.4.3. SWOT Analysis
- 11.2.4.4. Recent Developments
- 11.2.4.5. Financials (Based on Availability)
- 11.2.5 Invacare Corp.
- 11.2.5.1. Overview
- 11.2.5.2. Products
- 11.2.5.3. SWOT Analysis
- 11.2.5.4. Recent Developments
- 11.2.5.5. Financials (Based on Availability)
- 11.2.6 Medline Industries
- 11.2.6.1. Overview
- 11.2.6.2. Products
- 11.2.6.3. SWOT Analysis
- 11.2.6.4. Recent Developments
- 11.2.6.5. Financials (Based on Availability)
- 11.2.7 Medical Depot Inc.
- 11.2.7.1. Overview
- 11.2.7.2. Products
- 11.2.7.3. SWOT Analysis
- 11.2.7.4. Recent Developments
- 11.2.7.5. Financials (Based on Availability)
- 11.2.8 GF Health Products Inc.
- 11.2.8.1. Overview
- 11.2.8.2. Products
- 11.2.8.3. SWOT Analysis
- 11.2.8.4. Recent Developments
- 11.2.8.5. Financials (Based on Availability)
- 11.2.9 Centromed Ltd.
- 11.2.9.1. Overview
- 11.2.9.2. Products
- 11.2.9.3. SWOT Analysis
- 11.2.9.4. Recent Developments
- 11.2.9.5. Financials (Based on Availability)
- 11.2.10 Arjo
- 11.2.10.1. Overview
- 11.2.10.2. Products
- 11.2.10.3. SWOT Analysis
- 11.2.10.4. Recent Developments
- 11.2.10.5. Financials (Based on Availability)
- 11.2.11 Amico Group of Companies
- 11.2.11.1. Overview
- 11.2.11.2. Products
- 11.2.11.3. SWOT Analysis
- 11.2.11.4. Recent Developments
- 11.2.11.5. Financials (Based on Availability)
- 11.2.12 Bakare Beds Ltd.
- 11.2.12.1. Overview
- 11.2.12.2. Products
- 11.2.12.3. SWOT Analysis
- 11.2.12.4. Recent Developments
- 11.2.12.5. Financials (Based on Availability)
- 11.2.13 Gendron Inc.
- 11.2.13.1. Overview
- 11.2.13.2. Products
- 11.2.13.3. SWOT Analysis
- 11.2.13.4. Recent Developments
- 11.2.13.5. Financials (Based on Availability)
- 11.2.14 Hard Manufacturing Company Inc.
- 11.2.14.1. Overview
- 11.2.14.2. Products
- 11.2.14.3. SWOT Analysis
- 11.2.14.4. Recent Developments
- 11.2.14.5. Financials (Based on Availability)
- 11.2.15 Guangzhou Vedo Health&Science
- 11.2.15.1. Overview
- 11.2.15.2. Products
- 11.2.15.3. SWOT Analysis
- 11.2.15.4. Recent Developments
- 11.2.15.5. Financials (Based on Availability)
- 11.2.1 InterAktiv Health specialises
List of Figures
- Figure 1: Global Postural Therapy Beds Revenue Breakdown (undefined, %) by Region 2025 & 2033
- Figure 2: Global Postural Therapy Beds Volume Breakdown (K, %) by Region 2025 & 2033
- Figure 3: North America Postural Therapy Beds Revenue (undefined), by Application 2025 & 2033
- Figure 4: North America Postural Therapy Beds Volume (K), by Application 2025 & 2033
- Figure 5: North America Postural Therapy Beds Revenue Share (%), by Application 2025 & 2033
- Figure 6: North America Postural Therapy Beds Volume Share (%), by Application 2025 & 2033
- Figure 7: North America Postural Therapy Beds Revenue (undefined), by Type 2025 & 2033
- Figure 8: North America Postural Therapy Beds Volume (K), by Type 2025 & 2033
- Figure 9: North America Postural Therapy Beds Revenue Share (%), by Type 2025 & 2033
- Figure 10: North America Postural Therapy Beds Volume Share (%), by Type 2025 & 2033
- Figure 11: North America Postural Therapy Beds Revenue (undefined), by Country 2025 & 2033
- Figure 12: North America Postural Therapy Beds Volume (K), by Country 2025 & 2033
- Figure 13: North America Postural Therapy Beds Revenue Share (%), by Country 2025 & 2033
- Figure 14: North America Postural Therapy Beds Volume Share (%), by Country 2025 & 2033
- Figure 15: South America Postural Therapy Beds Revenue (undefined), by Application 2025 & 2033
- Figure 16: South America Postural Therapy Beds Volume (K), by Application 2025 & 2033
- Figure 17: South America Postural Therapy Beds Revenue Share (%), by Application 2025 & 2033
- Figure 18: South America Postural Therapy Beds Volume Share (%), by Application 2025 & 2033
- Figure 19: South America Postural Therapy Beds Revenue (undefined), by Type 2025 & 2033
- Figure 20: South America Postural Therapy Beds Volume (K), by Type 2025 & 2033
- Figure 21: South America Postural Therapy Beds Revenue Share (%), by Type 2025 & 2033
- Figure 22: South America Postural Therapy Beds Volume Share (%), by Type 2025 & 2033
- Figure 23: South America Postural Therapy Beds Revenue (undefined), by Country 2025 & 2033
- Figure 24: South America Postural Therapy Beds Volume (K), by Country 2025 & 2033
- Figure 25: South America Postural Therapy Beds Revenue Share (%), by Country 2025 & 2033
- Figure 26: South America Postural Therapy Beds Volume Share (%), by Country 2025 & 2033
- Figure 27: Europe Postural Therapy Beds Revenue (undefined), by Application 2025 & 2033
- Figure 28: Europe Postural Therapy Beds Volume (K), by Application 2025 & 2033
- Figure 29: Europe Postural Therapy Beds Revenue Share (%), by Application 2025 & 2033
- Figure 30: Europe Postural Therapy Beds Volume Share (%), by Application 2025 & 2033
- Figure 31: Europe Postural Therapy Beds Revenue (undefined), by Type 2025 & 2033
- Figure 32: Europe Postural Therapy Beds Volume (K), by Type 2025 & 2033
- Figure 33: Europe Postural Therapy Beds Revenue Share (%), by Type 2025 & 2033
- Figure 34: Europe Postural Therapy Beds Volume Share (%), by Type 2025 & 2033
- Figure 35: Europe Postural Therapy Beds Revenue (undefined), by Country 2025 & 2033
- Figure 36: Europe Postural Therapy Beds Volume (K), by Country 2025 & 2033
- Figure 37: Europe Postural Therapy Beds Revenue Share (%), by Country 2025 & 2033
- Figure 38: Europe Postural Therapy Beds Volume Share (%), by Country 2025 & 2033
- Figure 39: Middle East & Africa Postural Therapy Beds Revenue (undefined), by Application 2025 & 2033
- Figure 40: Middle East & Africa Postural Therapy Beds Volume (K), by Application 2025 & 2033
- Figure 41: Middle East & Africa Postural Therapy Beds Revenue Share (%), by Application 2025 & 2033
- Figure 42: Middle East & Africa Postural Therapy Beds Volume Share (%), by Application 2025 & 2033
- Figure 43: Middle East & Africa Postural Therapy Beds Revenue (undefined), by Type 2025 & 2033
- Figure 44: Middle East & Africa Postural Therapy Beds Volume (K), by Type 2025 & 2033
- Figure 45: Middle East & Africa Postural Therapy Beds Revenue Share (%), by Type 2025 & 2033
- Figure 46: Middle East & Africa Postural Therapy Beds Volume Share (%), by Type 2025 & 2033
- Figure 47: Middle East & Africa Postural Therapy Beds Revenue (undefined), by Country 2025 & 2033
- Figure 48: Middle East & Africa Postural Therapy Beds Volume (K), by Country 2025 & 2033
- Figure 49: Middle East & Africa Postural Therapy Beds Revenue Share (%), by Country 2025 & 2033
- Figure 50: Middle East & Africa Postural Therapy Beds Volume Share (%), by Country 2025 & 2033
- Figure 51: Asia Pacific Postural Therapy Beds Revenue (undefined), by Application 2025 & 2033
- Figure 52: Asia Pacific Postural Therapy Beds Volume (K), by Application 2025 & 2033
- Figure 53: Asia Pacific Postural Therapy Beds Revenue Share (%), by Application 2025 & 2033
- Figure 54: Asia Pacific Postural Therapy Beds Volume Share (%), by Application 2025 & 2033
- Figure 55: Asia Pacific Postural Therapy Beds Revenue (undefined), by Type 2025 & 2033
- Figure 56: Asia Pacific Postural Therapy Beds Volume (K), by Type 2025 & 2033
- Figure 57: Asia Pacific Postural Therapy Beds Revenue Share (%), by Type 2025 & 2033
- Figure 58: Asia Pacific Postural Therapy Beds Volume Share (%), by Type 2025 & 2033
- Figure 59: Asia Pacific Postural Therapy Beds Revenue (undefined), by Country 2025 & 2033
- Figure 60: Asia Pacific Postural Therapy Beds Volume (K), by Country 2025 & 2033
- Figure 61: Asia Pacific Postural Therapy Beds Revenue Share (%), by Country 2025 & 2033
- Figure 62: Asia Pacific Postural Therapy Beds Volume Share (%), by Country 2025 & 2033
List of Tables
- Table 1: Global Postural Therapy Beds Revenue undefined Forecast, by Application 2020 & 2033
- Table 2: Global Postural Therapy Beds Volume K Forecast, by Application 2020 & 2033
- Table 3: Global Postural Therapy Beds Revenue undefined Forecast, by Type 2020 & 2033
- Table 4: Global Postural Therapy Beds Volume K Forecast, by Type 2020 & 2033
- Table 5: Global Postural Therapy Beds Revenue undefined Forecast, by Region 2020 & 2033
- Table 6: Global Postural Therapy Beds Volume K Forecast, by Region 2020 & 2033
- Table 7: Global Postural Therapy Beds Revenue undefined Forecast, by Application 2020 & 2033
- Table 8: Global Postural Therapy Beds Volume K Forecast, by Application 2020 & 2033
- Table 9: Global Postural Therapy Beds Revenue undefined Forecast, by Type 2020 & 2033
- Table 10: Global Postural Therapy Beds Volume K Forecast, by Type 2020 & 2033
- Table 11: Global Postural Therapy Beds Revenue undefined Forecast, by Country 2020 & 2033
- Table 12: Global Postural Therapy Beds Volume K Forecast, by Country 2020 & 2033
- Table 13: United States Postural Therapy Beds Revenue (undefined) Forecast, by Application 2020 & 2033
- Table 14: United States Postural Therapy Beds Volume (K) Forecast, by Application 2020 & 2033
- Table 15: Canada Postural Therapy Beds Revenue (undefined) Forecast, by Application 2020 & 2033
- Table 16: Canada Postural Therapy Beds Volume (K) Forecast, by Application 2020 & 2033
- Table 17: Mexico Postural Therapy Beds Revenue (undefined) Forecast, by Application 2020 & 2033
- Table 18: Mexico Postural Therapy Beds Volume (K) Forecast, by Application 2020 & 2033
- Table 19: Global Postural Therapy Beds Revenue undefined Forecast, by Application 2020 & 2033
- Table 20: Global Postural Therapy Beds Volume K Forecast, by Application 2020 & 2033
- Table 21: Global Postural Therapy Beds Revenue undefined Forecast, by Type 2020 & 2033
- Table 22: Global Postural Therapy Beds Volume K Forecast, by Type 2020 & 2033
- Table 23: Global Postural Therapy Beds Revenue undefined Forecast, by Country 2020 & 2033
- Table 24: Global Postural Therapy Beds Volume K Forecast, by Country 2020 & 2033
- Table 25: Brazil Postural Therapy Beds Revenue (undefined) Forecast, by Application 2020 & 2033
- Table 26: Brazil Postural Therapy Beds Volume (K) Forecast, by Application 2020 & 2033
- Table 27: Argentina Postural Therapy Beds Revenue (undefined) Forecast, by Application 2020 & 2033
- Table 28: Argentina Postural Therapy Beds Volume (K) Forecast, by Application 2020 & 2033
- Table 29: Rest of South America Postural Therapy Beds Revenue (undefined) Forecast, by Application 2020 & 2033
- Table 30: Rest of South America Postural Therapy Beds Volume (K) Forecast, by Application 2020 & 2033
- Table 31: Global Postural Therapy Beds Revenue undefined Forecast, by Application 2020 & 2033
- Table 32: Global Postural Therapy Beds Volume K Forecast, by Application 2020 & 2033
- Table 33: Global Postural Therapy Beds Revenue undefined Forecast, by Type 2020 & 2033
- Table 34: Global Postural Therapy Beds Volume K Forecast, by Type 2020 & 2033
- Table 35: Global Postural Therapy Beds Revenue undefined Forecast, by Country 2020 & 2033
- Table 36: Global Postural Therapy Beds Volume K Forecast, by Country 2020 & 2033
- Table 37: United Kingdom Postural Therapy Beds Revenue (undefined) Forecast, by Application 2020 & 2033
- Table 38: United Kingdom Postural Therapy Beds Volume (K) Forecast, by Application 2020 & 2033
- Table 39: Germany Postural Therapy Beds Revenue (undefined) Forecast, by Application 2020 & 2033
- Table 40: Germany Postural Therapy Beds Volume (K) Forecast, by Application 2020 & 2033
- Table 41: France Postural Therapy Beds Revenue (undefined) Forecast, by Application 2020 & 2033
- Table 42: France Postural Therapy Beds Volume (K) Forecast, by Application 2020 & 2033
- Table 43: Italy Postural Therapy Beds Revenue (undefined) Forecast, by Application 2020 & 2033
- Table 44: Italy Postural Therapy Beds Volume (K) Forecast, by Application 2020 & 2033
- Table 45: Spain Postural Therapy Beds Revenue (undefined) Forecast, by Application 2020 & 2033
- Table 46: Spain Postural Therapy Beds Volume (K) Forecast, by Application 2020 & 2033
- Table 47: Russia Postural Therapy Beds Revenue (undefined) Forecast, by Application 2020 & 2033
- Table 48: Russia Postural Therapy Beds Volume (K) Forecast, by Application 2020 & 2033
- Table 49: Benelux Postural Therapy Beds Revenue (undefined) Forecast, by Application 2020 & 2033
- Table 50: Benelux Postural Therapy Beds Volume (K) Forecast, by Application 2020 & 2033
- Table 51: Nordics Postural Therapy Beds Revenue (undefined) Forecast, by Application 2020 & 2033
- Table 52: Nordics Postural Therapy Beds Volume (K) Forecast, by Application 2020 & 2033
- Table 53: Rest of Europe Postural Therapy Beds Revenue (undefined) Forecast, by Application 2020 & 2033
- Table 54: Rest of Europe Postural Therapy Beds Volume (K) Forecast, by Application 2020 & 2033
- Table 55: Global Postural Therapy Beds Revenue undefined Forecast, by Application 2020 & 2033
- Table 56: Global Postural Therapy Beds Volume K Forecast, by Application 2020 & 2033
- Table 57: Global Postural Therapy Beds Revenue undefined Forecast, by Type 2020 & 2033
- Table 58: Global Postural Therapy Beds Volume K Forecast, by Type 2020 & 2033
- Table 59: Global Postural Therapy Beds Revenue undefined Forecast, by Country 2020 & 2033
- Table 60: Global Postural Therapy Beds Volume K Forecast, by Country 2020 & 2033
- Table 61: Turkey Postural Therapy Beds Revenue (undefined) Forecast, by Application 2020 & 2033
- Table 62: Turkey Postural Therapy Beds Volume (K) Forecast, by Application 2020 & 2033
- Table 63: Israel Postural Therapy Beds Revenue (undefined) Forecast, by Application 2020 & 2033
- Table 64: Israel Postural Therapy Beds Volume (K) Forecast, by Application 2020 & 2033
- Table 65: GCC Postural Therapy Beds Revenue (undefined) Forecast, by Application 2020 & 2033
- Table 66: GCC Postural Therapy Beds Volume (K) Forecast, by Application 2020 & 2033
- Table 67: North Africa Postural Therapy Beds Revenue (undefined) Forecast, by Application 2020 & 2033
- Table 68: North Africa Postural Therapy Beds Volume (K) Forecast, by Application 2020 & 2033
- Table 69: South Africa Postural Therapy Beds Revenue (undefined) Forecast, by Application 2020 & 2033
- Table 70: South Africa Postural Therapy Beds Volume (K) Forecast, by Application 2020 & 2033
- Table 71: Rest of Middle East & Africa Postural Therapy Beds Revenue (undefined) Forecast, by Application 2020 & 2033
- Table 72: Rest of Middle East & Africa Postural Therapy Beds Volume (K) Forecast, by Application 2020 & 2033
- Table 73: Global Postural Therapy Beds Revenue undefined Forecast, by Application 2020 & 2033
- Table 74: Global Postural Therapy Beds Volume K Forecast, by Application 2020 & 2033
- Table 75: Global Postural Therapy Beds Revenue undefined Forecast, by Type 2020 & 2033
- Table 76: Global Postural Therapy Beds Volume K Forecast, by Type 2020 & 2033
- Table 77: Global Postural Therapy Beds Revenue undefined Forecast, by Country 2020 & 2033
- Table 78: Global Postural Therapy Beds Volume K Forecast, by Country 2020 & 2033
- Table 79: China Postural Therapy Beds Revenue (undefined) Forecast, by Application 2020 & 2033
- Table 80: China Postural Therapy Beds Volume (K) Forecast, by Application 2020 & 2033
- Table 81: India Postural Therapy Beds Revenue (undefined) Forecast, by Application 2020 & 2033
- Table 82: India Postural Therapy Beds Volume (K) Forecast, by Application 2020 & 2033
- Table 83: Japan Postural Therapy Beds Revenue (undefined) Forecast, by Application 2020 & 2033
- Table 84: Japan Postural Therapy Beds Volume (K) Forecast, by Application 2020 & 2033
- Table 85: South Korea Postural Therapy Beds Revenue (undefined) Forecast, by Application 2020 & 2033
- Table 86: South Korea Postural Therapy Beds Volume (K) Forecast, by Application 2020 & 2033
- Table 87: ASEAN Postural Therapy Beds Revenue (undefined) Forecast, by Application 2020 & 2033
- Table 88: ASEAN Postural Therapy Beds Volume (K) Forecast, by Application 2020 & 2033
- Table 89: Oceania Postural Therapy Beds Revenue (undefined) Forecast, by Application 2020 & 2033
- Table 90: Oceania Postural Therapy Beds Volume (K) Forecast, by Application 2020 & 2033
- Table 91: Rest of Asia Pacific Postural Therapy Beds Revenue (undefined) Forecast, by Application 2020 & 2033
- Table 92: Rest of Asia Pacific Postural Therapy Beds Volume (K) Forecast, by Application 2020 & 2033
Frequently Asked Questions
1. What is the projected Compound Annual Growth Rate (CAGR) of the Postural Therapy Beds?
The projected CAGR is approximately 7.25%.
2. Which companies are prominent players in the Postural Therapy Beds?
Key companies in the market include InterAktiv Health specialises, Surgitech, Hill Rom, Inc. (Baxter), Stryker Corp., Invacare Corp., Medline Industries, Medical Depot, Inc., GF Health Products, Inc., Centromed Ltd., Arjo, Amico Group of Companies, Bakare Beds Ltd., Gendron, Inc., Hard Manufacturing Company, Inc., Guangzhou Vedo Health&Science.
3. What are the main segments of the Postural Therapy Beds?
The market segments include Application, Type.
4. Can you provide details about the market size?
The market size is estimated to be USD XXX N/A as of 2022.
5. What are some drivers contributing to market growth?
N/A
6. What are the notable trends driving market growth?
N/A
7. Are there any restraints impacting market growth?
N/A
8. Can you provide examples of recent developments in the market?
N/A
9. What pricing options are available for accessing the report?
Pricing options include single-user, multi-user, and enterprise licenses priced at USD 3950.00, USD 5925.00, and USD 7900.00 respectively.
10. Is the market size provided in terms of value or volume?
The market size is provided in terms of value, measured in N/A and volume, measured in K.
11. Are there any specific market keywords associated with the report?
Yes, the market keyword associated with the report is "Postural Therapy Beds," which aids in identifying and referencing the specific market segment covered.
12. How do I determine which pricing option suits my needs best?
The pricing options vary based on user requirements and access needs. Individual users may opt for single-user licenses, while businesses requiring broader access may choose multi-user or enterprise licenses for cost-effective access to the report.
13. Are there any additional resources or data provided in the Postural Therapy Beds report?
While the report offers comprehensive insights, it's advisable to review the specific contents or supplementary materials provided to ascertain if additional resources or data are available.
14. How can I stay updated on further developments or reports in the Postural Therapy Beds?
To stay informed about further developments, trends, and reports in the Postural Therapy Beds, consider subscribing to industry newsletters, following relevant companies and organizations, or regularly checking reputable industry news sources and publications.
Methodology
Step 1 - Identification of Relevant Samples Size from Population Database


Step 2 - Approaches for Defining Global Market Size (Value, Volume* & Price*)

Note*: In applicable scenarios
Step 3 - Data Sources
Primary Research
- Web Analytics
- Survey Reports
- Research Institute
- Latest Research Reports
- Opinion Leaders
Secondary Research
- Annual Reports
- White Paper
- Latest Press Release
- Industry Association
- Paid Database
- Investor Presentations

Step 4 - Data Triangulation
Involves using different sources of information in order to increase the validity of a study
These sources are likely to be stakeholders in a program - participants, other researchers, program staff, other community members, and so on.
Then we put all data in single framework & apply various statistical tools to find out the dynamic on the market.
During the analysis stage, feedback from the stakeholder groups would be compared to determine areas of agreement as well as areas of divergence