

Key Insights
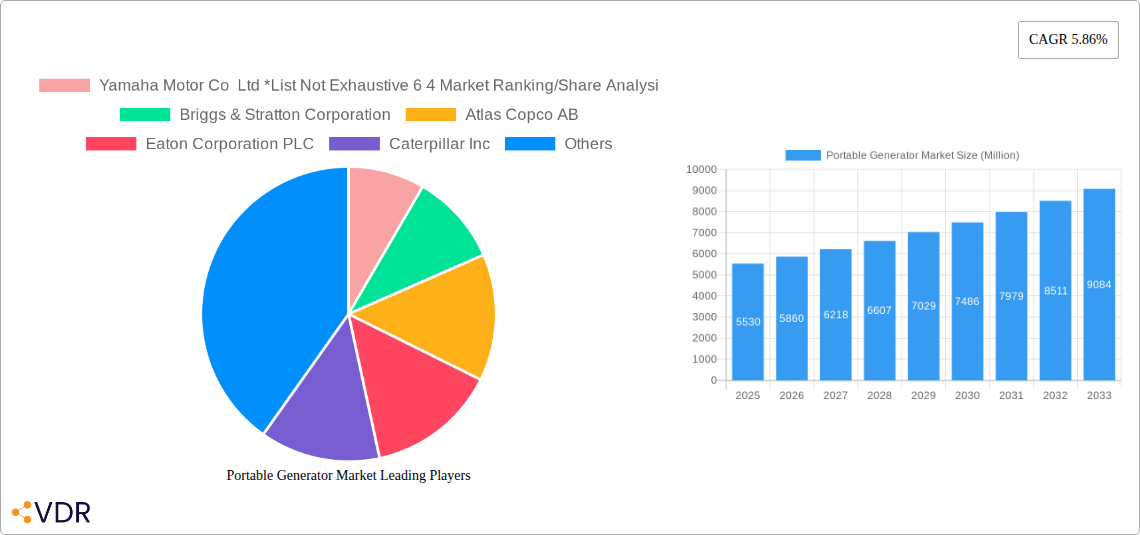
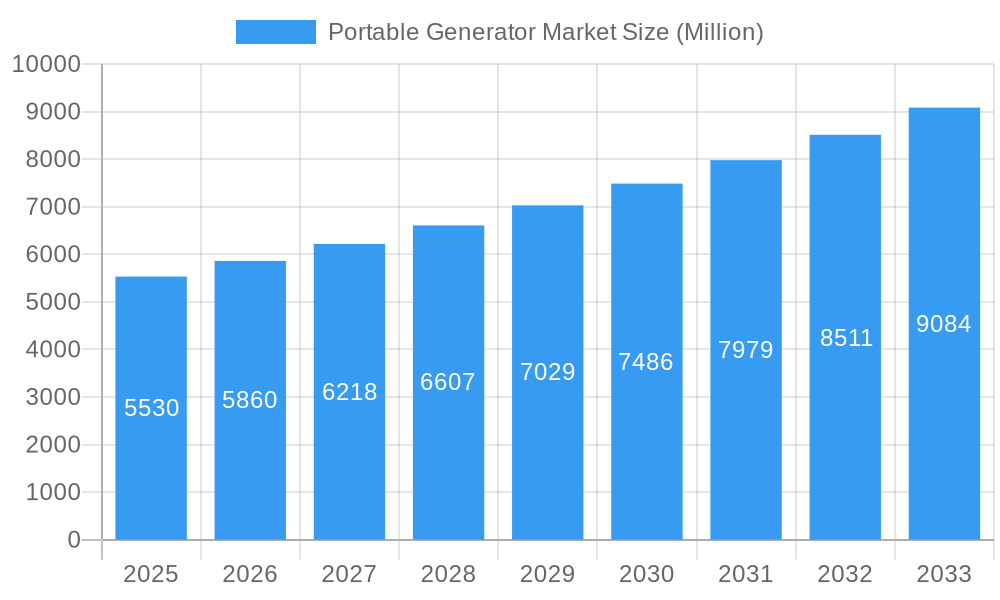
The portable generator market, valued at $5.53 billion in 2025, is projected to experience robust growth, exhibiting a compound annual growth rate (CAGR) of 5.86% from 2025 to 2033. This expansion is fueled by several key factors. Increased frequency and intensity of natural disasters, leading to power outages, are driving demand for reliable backup power solutions. Furthermore, the rising adoption of portable generators in remote areas lacking consistent grid electricity and the growth of construction and industrial activities are contributing significantly to market growth. Technological advancements, such as the incorporation of cleaner fuel technologies (e.g., propane and natural gas) and improved fuel efficiency, are also boosting market appeal. The market is segmented by power rating (below 5 kW, 5-10 kW, above 10 kW), fuel type (gas, diesel, other), and end-user (industrial, commercial, residential). The industrial sector currently dominates, driven by the need for reliable power in manufacturing and construction, but the residential segment is showing strong growth potential due to rising awareness of power outage risks. Key players such as Yamaha Motor Co. Ltd., Briggs & Stratton Corporation, and Generac Holdings Inc. are actively involved in product innovation and expansion into emerging markets, further shaping the market landscape.
Portable Generator Market Market Size (In Billion)
Competitive intensity is expected to remain high, with established players focusing on innovation and strategic partnerships to maintain market share. Geographical expansion, particularly in developing economies experiencing rapid urbanization and industrialization, presents substantial opportunities. The Asia-Pacific region is anticipated to witness significant growth due to increasing infrastructure development and rising demand for reliable power sources in both urban and rural areas. However, regulatory changes concerning emission standards and fluctuations in raw material prices pose challenges. The market's success depends on continued technological advancements, addressing environmental concerns, and navigating economic volatility to meet the growing demand for portable power solutions across various sectors and geographies.
Portable Generator Market Company Market Share
Portable Generator Market: A Comprehensive Report (2019-2033)
This in-depth report provides a comprehensive analysis of the Portable Generator Market, encompassing market dynamics, growth trends, regional segmentation, product landscape, key players, and future outlook. The study period covers 2019-2033, with 2025 as the base and estimated year. The report is essential for industry professionals, investors, and stakeholders seeking a thorough understanding of this dynamic market. The parent market is the power generation equipment market, and the child market is the portable power generation segment. Market size is presented in million units.
Portable Generator Market Market Dynamics & Structure
The portable generator market is characterized by moderate concentration, with key players like Generac Holdings Inc, Kohler Power Systems, and Honda Siel Power Products Ltd holding significant market share. Technological innovation, driven by advancements in engine efficiency, fuel technology, and noise reduction, is a major driver. Stringent emission regulations across various geographies are shaping product development. Competitive substitutes include uninterruptible power supplies (UPS) and solar power systems, influencing market segmentation. End-user demographics, particularly in developing economies experiencing rapid industrialization and urbanization, are significantly impacting demand. Market consolidation through mergers and acquisitions (M&A) is observed, with xx deals recorded in the historical period (2019-2024), resulting in a xx% market share shift amongst the top players.
- Market Concentration: Moderately concentrated, with top 5 players holding xx% market share in 2024.
- Technological Innovation: Focus on fuel efficiency, noise reduction, and smart features.
- Regulatory Landscape: Stringent emission norms influencing product design and adoption.
- Competitive Substitutes: UPS systems and solar power pose competitive challenges.
- M&A Activity: xx deals between 2019 and 2024, leading to market consolidation.
- Innovation Barriers: High R&D costs and regulatory compliance requirements.
Portable Generator Market Growth Trends & Insights
The portable generator market witnessed a Compound Annual Growth Rate (CAGR) of xx% during the historical period (2019-2024), reaching a market size of xx million units in 2024. Adoption rates are high in regions with unreliable grid power or frequent power outages. Technological disruptions, such as the incorporation of inverter technology for cleaner power output and the integration of smart features for remote monitoring, are driving growth. Consumer behavior shifts towards eco-friendly options and increased awareness of safety features are also influencing purchase decisions. The market is projected to maintain a CAGR of xx% during the forecast period (2025-2033), reaching xx million units by 2033. Market penetration in emerging economies is expected to increase significantly.
Dominant Regions, Countries, or Segments in Portable Generator Market
North America and Europe currently dominate the portable generator market, driven by high consumer awareness, established distribution networks, and stringent safety regulations. Within these regions, the residential segment holds the largest market share, followed by the commercial and industrial segments. The gas-powered generators dominate the fuel type segment. However, the demand for diesel generators is expected to increase in industrial and commercial segments. High economic growth and rapid infrastructure development in Asia-Pacific countries are expected to fuel market expansion in the future.
- Leading Region: North America holds the largest market share in 2024 (xx%).
- Fastest Growing Region: Asia-Pacific is projected to experience the fastest growth (xx% CAGR during forecast period).
- Dominant Segment (Power Rating): 5-10 kW segment holds the largest market share.
- Dominant Segment (Fuel Type): Gas-powered generators lead, with xx% market share.
- Dominant Segment (End-User): Residential segment dominates, followed by commercial and industrial.
- Key Growth Drivers: Increasing demand for backup power, rising construction activity, and favorable government policies.
Portable Generator Market Product Landscape
Portable generators are constantly evolving, with advancements focusing on enhanced portability, fuel efficiency, quieter operation, and improved power quality. Inverter technology is becoming increasingly prevalent, providing cleaner power for sensitive electronics. Many models now feature advanced features such as digital displays, remote start capabilities, and parallel operation for increased power output. Unique selling propositions include compact designs, eco-friendly fuel options, and long run times. Technological advancements continually improve performance metrics such as fuel efficiency and noise levels.
Key Drivers, Barriers & Challenges in Portable Generator Market
Key Drivers:
- Rising demand for reliable backup power in areas with unreliable electricity grids.
- Increased construction and infrastructure development activities.
- Growing adoption of portable generators in various sectors, such as residential, commercial, and industrial.
Key Challenges:
- Fluctuations in raw material prices, impacting manufacturing costs.
- Stringent emission regulations and their impact on product development.
- Intense competition among established and emerging players.
- Supply chain disruptions potentially impacting manufacturing and distribution. The disruption in 2022-2023 impacted production by xx%.
Emerging Opportunities in Portable Generator Market
- Expanding into untapped markets in developing economies.
- Development of hybrid and renewable energy-powered portable generators.
- Focus on portable generators with smart functionalities and connectivity features.
- Increasing adoption of rental services for portable generators.
Growth Accelerators in the Portable Generator Market Industry
Technological advancements, strategic partnerships between generator manufacturers and energy companies, and expansion into new geographic markets are key growth catalysts. Development of lightweight, fuel-efficient models, integrating smart technology for remote monitoring and control, and exploring alternative fuel sources will further accelerate market growth.
Key Players Shaping the Portable Generator Market Market
- Yamaha Motor Co Ltd
- Briggs & Stratton Corporation
- Atlas Copco AB
- Eaton Corporation PLC
- Caterpillar Inc
- Honda Siel Power Products Ltd
- Kohler Power Systems
- Wacker Neuson SE
- Generac Holdings Inc
Notable Milestones in Portable Generator Market Sector
- February 2023: Caterpillar launched the XQ330 mobile diesel generator, featuring low noise operation, weather-resistant enclosure, and rental-ready features. This launch significantly strengthens Caterpillar’s position in the high-power segment.
- January 2022: Honda announced the launch of its EU32i portable generator, emphasizing reliability and global market expansion. This indicates Honda's continued investment in the consumer portable generator market.
In-Depth Portable Generator Market Market Outlook
The portable generator market is poised for sustained growth, driven by technological innovation, expanding applications across various sectors, and increasing demand in emerging economies. Strategic partnerships, focus on sustainable and smart technologies, and proactive responses to regulatory changes will be crucial for success in this competitive landscape. The market exhibits a promising future, with significant potential for growth across all major segments.
Portable Generator Market Segmentation
-
1. Power Rating
- 1.1. Below 5 kW
- 1.2. 5-10 kW
- 1.3. Above 10 kW
-
2. Fuel Type
- 2.1. Gas
- 2.2. Diesel
- 2.3. Other Fuel Types
-
3. End User
- 3.1. Industrial
- 3.2. Commercial
- 3.3. Residential
Portable Generator Market Segmentation By Geography
-
1. North America
- 1.1. United States
- 1.2. Canada
- 1.3. Rest of North America
-
2. Europe
- 2.1. Germany
- 2.2. France
- 2.3. United Kingdom
- 2.4. Spain
- 2.5. NORDIC
- 2.6. Turkey
- 2.7. Russia
- 2.8. Rest of Europe
-
3. Asia Pacific
- 3.1. India
- 3.2. China
- 3.3. Japan
- 3.4. Australia
- 3.5. Malaysia
- 3.6. Thailand
- 3.7. Indonesia
- 3.8. Vietnam
- 3.9. Rest of Asia Pacific
-
4. South America
- 4.1. Brazil
- 4.2. Argentina
- 4.3. Colombia
- 4.4. Rest of South America
-
5. Middle East and Africa
- 5.1. United Arab Emirates
- 5.2. Saudi Arabia
- 5.3. Nigeria
- 5.4. Rest of Middle East and Africa
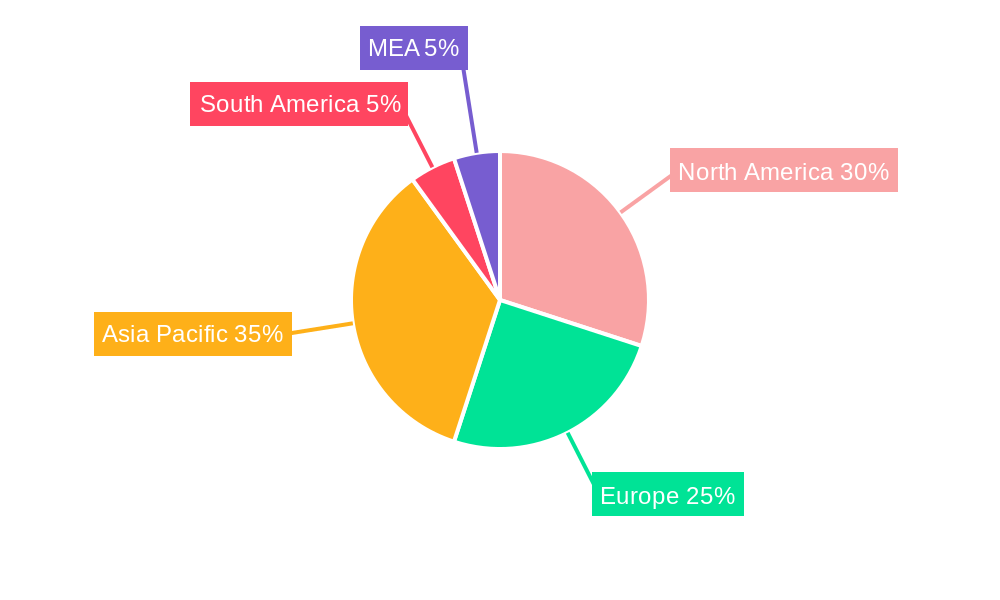
Portable Generator Market Regional Market Share
Geographic Coverage of Portable Generator Market
Portable Generator Market REPORT HIGHLIGHTS
| Aspects | Details |
|---|---|
| Study Period | 2020-2034 |
| Base Year | 2025 |
| Estimated Year | 2026 |
| Forecast Period | 2026-2034 |
| Historical Period | 2020-2025 |
| Growth Rate | CAGR of 5.86% from 2020-2034 |
| Segmentation |
|
Table of Contents
- 1. Introduction
- 1.1. Research Scope
- 1.2. Market Segmentation
- 1.3. Research Objective
- 1.4. Definitions and Assumptions
- 2. Executive Summary
- 2.1. Market Snapshot
- 3. Market Dynamics
- 3.1. Market Drivers
- 3.2. Market Restrains
- 3.3. Market Trends
- 3.4. Market Opportunities
- 4. Market Factor Analysis
- 4.1. Porters Five Forces
- 4.1.1. Bargaining Power of Suppliers
- 4.1.2. Bargaining Power of Buyers
- 4.1.3. Threat of New Entrants
- 4.1.4. Threat of Substitutes
- 4.1.5. Competitive Rivalry
- 4.2. PESTEL analysis
- 4.3. BCG Analysis
- 4.3.1. Stars (High Growth, High Market Share)
- 4.3.2. Cash Cows (Low Growth, High Market Share)
- 4.3.3. Question Mark (High Growth, Low Market Share)
- 4.3.4. Dogs (Low Growth, Low Market Share)
- 4.4. Ansoff Matrix Analysis
- 4.5. Supply Chain Analysis
- 4.6. Regulatory Landscape
- 4.7. Current Market Potential and Opportunity Assessment (TAM–SAM–SOM Framework)
- 4.8. VDR Analyst Note
- 4.1. Porters Five Forces
- 5. Market Analysis, Insights and Forecast 2021-2033
- 5.1. Market Analysis, Insights and Forecast - by Power Rating
- 5.1.1. Below 5 kW
- 5.1.2. 5-10 kW
- 5.1.3. Above 10 kW
- 5.2. Market Analysis, Insights and Forecast - by Fuel Type
- 5.2.1. Gas
- 5.2.2. Diesel
- 5.2.3. Other Fuel Types
- 5.3. Market Analysis, Insights and Forecast - by End User
- 5.3.1. Industrial
- 5.3.2. Commercial
- 5.3.3. Residential
- 5.4. Market Analysis, Insights and Forecast - by Region
- 5.4.1. North America
- 5.4.2. Europe
- 5.4.3. Asia Pacific
- 5.4.4. South America
- 5.4.5. Middle East and Africa
- 5.1. Market Analysis, Insights and Forecast - by Power Rating
- 6. Global Portable Generator Market Analysis, Insights and Forecast, 2021-2033
- 6.1. Market Analysis, Insights and Forecast - by Power Rating
- 6.1.1. Below 5 kW
- 6.1.2. 5-10 kW
- 6.1.3. Above 10 kW
- 6.2. Market Analysis, Insights and Forecast - by Fuel Type
- 6.2.1. Gas
- 6.2.2. Diesel
- 6.2.3. Other Fuel Types
- 6.3. Market Analysis, Insights and Forecast - by End User
- 6.3.1. Industrial
- 6.3.2. Commercial
- 6.3.3. Residential
- 6.1. Market Analysis, Insights and Forecast - by Power Rating
- 7. North America Portable Generator Market Analysis, Insights and Forecast, 2021-2033
- 7.1. Market Analysis, Insights and Forecast - by Power Rating
- 7.1.1. Below 5 kW
- 7.1.2. 5-10 kW
- 7.1.3. Above 10 kW
- 7.2. Market Analysis, Insights and Forecast - by Fuel Type
- 7.2.1. Gas
- 7.2.2. Diesel
- 7.2.3. Other Fuel Types
- 7.3. Market Analysis, Insights and Forecast - by End User
- 7.3.1. Industrial
- 7.3.2. Commercial
- 7.3.3. Residential
- 7.1. Market Analysis, Insights and Forecast - by Power Rating
- 8. Europe Portable Generator Market Analysis, Insights and Forecast, 2021-2033
- 8.1. Market Analysis, Insights and Forecast - by Power Rating
- 8.1.1. Below 5 kW
- 8.1.2. 5-10 kW
- 8.1.3. Above 10 kW
- 8.2. Market Analysis, Insights and Forecast - by Fuel Type
- 8.2.1. Gas
- 8.2.2. Diesel
- 8.2.3. Other Fuel Types
- 8.3. Market Analysis, Insights and Forecast - by End User
- 8.3.1. Industrial
- 8.3.2. Commercial
- 8.3.3. Residential
- 8.1. Market Analysis, Insights and Forecast - by Power Rating
- 9. Asia Pacific Portable Generator Market Analysis, Insights and Forecast, 2021-2033
- 9.1. Market Analysis, Insights and Forecast - by Power Rating
- 9.1.1. Below 5 kW
- 9.1.2. 5-10 kW
- 9.1.3. Above 10 kW
- 9.2. Market Analysis, Insights and Forecast - by Fuel Type
- 9.2.1. Gas
- 9.2.2. Diesel
- 9.2.3. Other Fuel Types
- 9.3. Market Analysis, Insights and Forecast - by End User
- 9.3.1. Industrial
- 9.3.2. Commercial
- 9.3.3. Residential
- 9.1. Market Analysis, Insights and Forecast - by Power Rating
- 10. South America Portable Generator Market Analysis, Insights and Forecast, 2021-2033
- 10.1. Market Analysis, Insights and Forecast - by Power Rating
- 10.1.1. Below 5 kW
- 10.1.2. 5-10 kW
- 10.1.3. Above 10 kW
- 10.2. Market Analysis, Insights and Forecast - by Fuel Type
- 10.2.1. Gas
- 10.2.2. Diesel
- 10.2.3. Other Fuel Types
- 10.3. Market Analysis, Insights and Forecast - by End User
- 10.3.1. Industrial
- 10.3.2. Commercial
- 10.3.3. Residential
- 10.1. Market Analysis, Insights and Forecast - by Power Rating
- 11. Middle East and Africa Portable Generator Market Analysis, Insights and Forecast, 2021-2033
- 11.1. Market Analysis, Insights and Forecast - by Power Rating
- 11.1.1. Below 5 kW
- 11.1.2. 5-10 kW
- 11.1.3. Above 10 kW
- 11.2. Market Analysis, Insights and Forecast - by Fuel Type
- 11.2.1. Gas
- 11.2.2. Diesel
- 11.2.3. Other Fuel Types
- 11.3. Market Analysis, Insights and Forecast - by End User
- 11.3.1. Industrial
- 11.3.2. Commercial
- 11.3.3. Residential
- 11.1. Market Analysis, Insights and Forecast - by Power Rating
- 12. Competitive Analysis
- 12.1. Company Profiles
- 12.1.1 Yamaha Motor Co Ltd *List Not Exhaustive 6 4 Market Ranking/Share Analysi
- 12.1.1.1. Company Overview
- 12.1.1.2. Products
- 12.1.1.3. Company Financials
- 12.1.1.4. SWOT Analysis
- 12.1.2 Briggs & Stratton Corporation
- 12.1.2.1. Company Overview
- 12.1.2.2. Products
- 12.1.2.3. Company Financials
- 12.1.2.4. SWOT Analysis
- 12.1.3 Atlas Copco AB
- 12.1.3.1. Company Overview
- 12.1.3.2. Products
- 12.1.3.3. Company Financials
- 12.1.3.4. SWOT Analysis
- 12.1.4 Eaton Corporation PLC
- 12.1.4.1. Company Overview
- 12.1.4.2. Products
- 12.1.4.3. Company Financials
- 12.1.4.4. SWOT Analysis
- 12.1.5 Caterpillar Inc
- 12.1.5.1. Company Overview
- 12.1.5.2. Products
- 12.1.5.3. Company Financials
- 12.1.5.4. SWOT Analysis
- 12.1.6 Honda Siel Power Products Ltd
- 12.1.6.1. Company Overview
- 12.1.6.2. Products
- 12.1.6.3. Company Financials
- 12.1.6.4. SWOT Analysis
- 12.1.7 Kohler Power Systems
- 12.1.7.1. Company Overview
- 12.1.7.2. Products
- 12.1.7.3. Company Financials
- 12.1.7.4. SWOT Analysis
- 12.1.8 Wacker Neuson SE
- 12.1.8.1. Company Overview
- 12.1.8.2. Products
- 12.1.8.3. Company Financials
- 12.1.8.4. SWOT Analysis
- 12.1.9 Generac Holdings Inc
- 12.1.9.1. Company Overview
- 12.1.9.2. Products
- 12.1.9.3. Company Financials
- 12.1.9.4. SWOT Analysis
- 12.1.1 Yamaha Motor Co Ltd *List Not Exhaustive 6 4 Market Ranking/Share Analysi
- 12.2. Market Entropy
- 12.2.1 Company's Key Areas Served
- 12.2.2 Recent Developments
- 12.3. Company Market Share Analysis 2025
- 12.3.1 Top 5 Companies Market Share Analysis
- 12.3.2 Top 3 Companies Market Share Analysis
- 12.4. List of Potential Customers
- 13. Research Methodology
List of Figures
- Figure 1: Global Portable Generator Market Revenue Breakdown (Million, %) by Region 2025 & 2033
- Figure 2: Global Portable Generator Market Volume Breakdown (K Unit, %) by Region 2025 & 2033
- Figure 3: North America Portable Generator Market Revenue (Million), by Power Rating 2025 & 2033
- Figure 4: North America Portable Generator Market Volume (K Unit), by Power Rating 2025 & 2033
- Figure 5: North America Portable Generator Market Revenue Share (%), by Power Rating 2025 & 2033
- Figure 6: North America Portable Generator Market Volume Share (%), by Power Rating 2025 & 2033
- Figure 7: North America Portable Generator Market Revenue (Million), by Fuel Type 2025 & 2033
- Figure 8: North America Portable Generator Market Volume (K Unit), by Fuel Type 2025 & 2033
- Figure 9: North America Portable Generator Market Revenue Share (%), by Fuel Type 2025 & 2033
- Figure 10: North America Portable Generator Market Volume Share (%), by Fuel Type 2025 & 2033
- Figure 11: North America Portable Generator Market Revenue (Million), by End User 2025 & 2033
- Figure 12: North America Portable Generator Market Volume (K Unit), by End User 2025 & 2033
- Figure 13: North America Portable Generator Market Revenue Share (%), by End User 2025 & 2033
- Figure 14: North America Portable Generator Market Volume Share (%), by End User 2025 & 2033
- Figure 15: North America Portable Generator Market Revenue (Million), by Country 2025 & 2033
- Figure 16: North America Portable Generator Market Volume (K Unit), by Country 2025 & 2033
- Figure 17: North America Portable Generator Market Revenue Share (%), by Country 2025 & 2033
- Figure 18: North America Portable Generator Market Volume Share (%), by Country 2025 & 2033
- Figure 19: Europe Portable Generator Market Revenue (Million), by Power Rating 2025 & 2033
- Figure 20: Europe Portable Generator Market Volume (K Unit), by Power Rating 2025 & 2033
- Figure 21: Europe Portable Generator Market Revenue Share (%), by Power Rating 2025 & 2033
- Figure 22: Europe Portable Generator Market Volume Share (%), by Power Rating 2025 & 2033
- Figure 23: Europe Portable Generator Market Revenue (Million), by Fuel Type 2025 & 2033
- Figure 24: Europe Portable Generator Market Volume (K Unit), by Fuel Type 2025 & 2033
- Figure 25: Europe Portable Generator Market Revenue Share (%), by Fuel Type 2025 & 2033
- Figure 26: Europe Portable Generator Market Volume Share (%), by Fuel Type 2025 & 2033
- Figure 27: Europe Portable Generator Market Revenue (Million), by End User 2025 & 2033
- Figure 28: Europe Portable Generator Market Volume (K Unit), by End User 2025 & 2033
- Figure 29: Europe Portable Generator Market Revenue Share (%), by End User 2025 & 2033
- Figure 30: Europe Portable Generator Market Volume Share (%), by End User 2025 & 2033
- Figure 31: Europe Portable Generator Market Revenue (Million), by Country 2025 & 2033
- Figure 32: Europe Portable Generator Market Volume (K Unit), by Country 2025 & 2033
- Figure 33: Europe Portable Generator Market Revenue Share (%), by Country 2025 & 2033
- Figure 34: Europe Portable Generator Market Volume Share (%), by Country 2025 & 2033
- Figure 35: Asia Pacific Portable Generator Market Revenue (Million), by Power Rating 2025 & 2033
- Figure 36: Asia Pacific Portable Generator Market Volume (K Unit), by Power Rating 2025 & 2033
- Figure 37: Asia Pacific Portable Generator Market Revenue Share (%), by Power Rating 2025 & 2033
- Figure 38: Asia Pacific Portable Generator Market Volume Share (%), by Power Rating 2025 & 2033
- Figure 39: Asia Pacific Portable Generator Market Revenue (Million), by Fuel Type 2025 & 2033
- Figure 40: Asia Pacific Portable Generator Market Volume (K Unit), by Fuel Type 2025 & 2033
- Figure 41: Asia Pacific Portable Generator Market Revenue Share (%), by Fuel Type 2025 & 2033
- Figure 42: Asia Pacific Portable Generator Market Volume Share (%), by Fuel Type 2025 & 2033
- Figure 43: Asia Pacific Portable Generator Market Revenue (Million), by End User 2025 & 2033
- Figure 44: Asia Pacific Portable Generator Market Volume (K Unit), by End User 2025 & 2033
- Figure 45: Asia Pacific Portable Generator Market Revenue Share (%), by End User 2025 & 2033
- Figure 46: Asia Pacific Portable Generator Market Volume Share (%), by End User 2025 & 2033
- Figure 47: Asia Pacific Portable Generator Market Revenue (Million), by Country 2025 & 2033
- Figure 48: Asia Pacific Portable Generator Market Volume (K Unit), by Country 2025 & 2033
- Figure 49: Asia Pacific Portable Generator Market Revenue Share (%), by Country 2025 & 2033
- Figure 50: Asia Pacific Portable Generator Market Volume Share (%), by Country 2025 & 2033
- Figure 51: South America Portable Generator Market Revenue (Million), by Power Rating 2025 & 2033
- Figure 52: South America Portable Generator Market Volume (K Unit), by Power Rating 2025 & 2033
- Figure 53: South America Portable Generator Market Revenue Share (%), by Power Rating 2025 & 2033
- Figure 54: South America Portable Generator Market Volume Share (%), by Power Rating 2025 & 2033
- Figure 55: South America Portable Generator Market Revenue (Million), by Fuel Type 2025 & 2033
- Figure 56: South America Portable Generator Market Volume (K Unit), by Fuel Type 2025 & 2033
- Figure 57: South America Portable Generator Market Revenue Share (%), by Fuel Type 2025 & 2033
- Figure 58: South America Portable Generator Market Volume Share (%), by Fuel Type 2025 & 2033
- Figure 59: South America Portable Generator Market Revenue (Million), by End User 2025 & 2033
- Figure 60: South America Portable Generator Market Volume (K Unit), by End User 2025 & 2033
- Figure 61: South America Portable Generator Market Revenue Share (%), by End User 2025 & 2033
- Figure 62: South America Portable Generator Market Volume Share (%), by End User 2025 & 2033
- Figure 63: South America Portable Generator Market Revenue (Million), by Country 2025 & 2033
- Figure 64: South America Portable Generator Market Volume (K Unit), by Country 2025 & 2033
- Figure 65: South America Portable Generator Market Revenue Share (%), by Country 2025 & 2033
- Figure 66: South America Portable Generator Market Volume Share (%), by Country 2025 & 2033
- Figure 67: Middle East and Africa Portable Generator Market Revenue (Million), by Power Rating 2025 & 2033
- Figure 68: Middle East and Africa Portable Generator Market Volume (K Unit), by Power Rating 2025 & 2033
- Figure 69: Middle East and Africa Portable Generator Market Revenue Share (%), by Power Rating 2025 & 2033
- Figure 70: Middle East and Africa Portable Generator Market Volume Share (%), by Power Rating 2025 & 2033
- Figure 71: Middle East and Africa Portable Generator Market Revenue (Million), by Fuel Type 2025 & 2033
- Figure 72: Middle East and Africa Portable Generator Market Volume (K Unit), by Fuel Type 2025 & 2033
- Figure 73: Middle East and Africa Portable Generator Market Revenue Share (%), by Fuel Type 2025 & 2033
- Figure 74: Middle East and Africa Portable Generator Market Volume Share (%), by Fuel Type 2025 & 2033
- Figure 75: Middle East and Africa Portable Generator Market Revenue (Million), by End User 2025 & 2033
- Figure 76: Middle East and Africa Portable Generator Market Volume (K Unit), by End User 2025 & 2033
- Figure 77: Middle East and Africa Portable Generator Market Revenue Share (%), by End User 2025 & 2033
- Figure 78: Middle East and Africa Portable Generator Market Volume Share (%), by End User 2025 & 2033
- Figure 79: Middle East and Africa Portable Generator Market Revenue (Million), by Country 2025 & 2033
- Figure 80: Middle East and Africa Portable Generator Market Volume (K Unit), by Country 2025 & 2033
- Figure 81: Middle East and Africa Portable Generator Market Revenue Share (%), by Country 2025 & 2033
- Figure 82: Middle East and Africa Portable Generator Market Volume Share (%), by Country 2025 & 2033
List of Tables
- Table 1: Global Portable Generator Market Revenue Million Forecast, by Power Rating 2020 & 2033
- Table 2: Global Portable Generator Market Volume K Unit Forecast, by Power Rating 2020 & 2033
- Table 3: Global Portable Generator Market Revenue Million Forecast, by Fuel Type 2020 & 2033
- Table 4: Global Portable Generator Market Volume K Unit Forecast, by Fuel Type 2020 & 2033
- Table 5: Global Portable Generator Market Revenue Million Forecast, by End User 2020 & 2033
- Table 6: Global Portable Generator Market Volume K Unit Forecast, by End User 2020 & 2033
- Table 7: Global Portable Generator Market Revenue Million Forecast, by Region 2020 & 2033
- Table 8: Global Portable Generator Market Volume K Unit Forecast, by Region 2020 & 2033
- Table 9: Global Portable Generator Market Revenue Million Forecast, by Power Rating 2020 & 2033
- Table 10: Global Portable Generator Market Volume K Unit Forecast, by Power Rating 2020 & 2033
- Table 11: Global Portable Generator Market Revenue Million Forecast, by Fuel Type 2020 & 2033
- Table 12: Global Portable Generator Market Volume K Unit Forecast, by Fuel Type 2020 & 2033
- Table 13: Global Portable Generator Market Revenue Million Forecast, by End User 2020 & 2033
- Table 14: Global Portable Generator Market Volume K Unit Forecast, by End User 2020 & 2033
- Table 15: Global Portable Generator Market Revenue Million Forecast, by Country 2020 & 2033
- Table 16: Global Portable Generator Market Volume K Unit Forecast, by Country 2020 & 2033
- Table 17: United States Portable Generator Market Revenue (Million) Forecast, by Application 2020 & 2033
- Table 18: United States Portable Generator Market Volume (K Unit) Forecast, by Application 2020 & 2033
- Table 19: Canada Portable Generator Market Revenue (Million) Forecast, by Application 2020 & 2033
- Table 20: Canada Portable Generator Market Volume (K Unit) Forecast, by Application 2020 & 2033
- Table 21: Rest of North America Portable Generator Market Revenue (Million) Forecast, by Application 2020 & 2033
- Table 22: Rest of North America Portable Generator Market Volume (K Unit) Forecast, by Application 2020 & 2033
- Table 23: Global Portable Generator Market Revenue Million Forecast, by Power Rating 2020 & 2033
- Table 24: Global Portable Generator Market Volume K Unit Forecast, by Power Rating 2020 & 2033
- Table 25: Global Portable Generator Market Revenue Million Forecast, by Fuel Type 2020 & 2033
- Table 26: Global Portable Generator Market Volume K Unit Forecast, by Fuel Type 2020 & 2033
- Table 27: Global Portable Generator Market Revenue Million Forecast, by End User 2020 & 2033
- Table 28: Global Portable Generator Market Volume K Unit Forecast, by End User 2020 & 2033
- Table 29: Global Portable Generator Market Revenue Million Forecast, by Country 2020 & 2033
- Table 30: Global Portable Generator Market Volume K Unit Forecast, by Country 2020 & 2033
- Table 31: Germany Portable Generator Market Revenue (Million) Forecast, by Application 2020 & 2033
- Table 32: Germany Portable Generator Market Volume (K Unit) Forecast, by Application 2020 & 2033
- Table 33: France Portable Generator Market Revenue (Million) Forecast, by Application 2020 & 2033
- Table 34: France Portable Generator Market Volume (K Unit) Forecast, by Application 2020 & 2033
- Table 35: United Kingdom Portable Generator Market Revenue (Million) Forecast, by Application 2020 & 2033
- Table 36: United Kingdom Portable Generator Market Volume (K Unit) Forecast, by Application 2020 & 2033
- Table 37: Spain Portable Generator Market Revenue (Million) Forecast, by Application 2020 & 2033
- Table 38: Spain Portable Generator Market Volume (K Unit) Forecast, by Application 2020 & 2033
- Table 39: NORDIC Portable Generator Market Revenue (Million) Forecast, by Application 2020 & 2033
- Table 40: NORDIC Portable Generator Market Volume (K Unit) Forecast, by Application 2020 & 2033
- Table 41: Turkey Portable Generator Market Revenue (Million) Forecast, by Application 2020 & 2033
- Table 42: Turkey Portable Generator Market Volume (K Unit) Forecast, by Application 2020 & 2033
- Table 43: Russia Portable Generator Market Revenue (Million) Forecast, by Application 2020 & 2033
- Table 44: Russia Portable Generator Market Volume (K Unit) Forecast, by Application 2020 & 2033
- Table 45: Rest of Europe Portable Generator Market Revenue (Million) Forecast, by Application 2020 & 2033
- Table 46: Rest of Europe Portable Generator Market Volume (K Unit) Forecast, by Application 2020 & 2033
- Table 47: Global Portable Generator Market Revenue Million Forecast, by Power Rating 2020 & 2033
- Table 48: Global Portable Generator Market Volume K Unit Forecast, by Power Rating 2020 & 2033
- Table 49: Global Portable Generator Market Revenue Million Forecast, by Fuel Type 2020 & 2033
- Table 50: Global Portable Generator Market Volume K Unit Forecast, by Fuel Type 2020 & 2033
- Table 51: Global Portable Generator Market Revenue Million Forecast, by End User 2020 & 2033
- Table 52: Global Portable Generator Market Volume K Unit Forecast, by End User 2020 & 2033
- Table 53: Global Portable Generator Market Revenue Million Forecast, by Country 2020 & 2033
- Table 54: Global Portable Generator Market Volume K Unit Forecast, by Country 2020 & 2033
- Table 55: India Portable Generator Market Revenue (Million) Forecast, by Application 2020 & 2033
- Table 56: India Portable Generator Market Volume (K Unit) Forecast, by Application 2020 & 2033
- Table 57: China Portable Generator Market Revenue (Million) Forecast, by Application 2020 & 2033
- Table 58: China Portable Generator Market Volume (K Unit) Forecast, by Application 2020 & 2033
- Table 59: Japan Portable Generator Market Revenue (Million) Forecast, by Application 2020 & 2033
- Table 60: Japan Portable Generator Market Volume (K Unit) Forecast, by Application 2020 & 2033
- Table 61: Australia Portable Generator Market Revenue (Million) Forecast, by Application 2020 & 2033
- Table 62: Australia Portable Generator Market Volume (K Unit) Forecast, by Application 2020 & 2033
- Table 63: Malaysia Portable Generator Market Revenue (Million) Forecast, by Application 2020 & 2033
- Table 64: Malaysia Portable Generator Market Volume (K Unit) Forecast, by Application 2020 & 2033
- Table 65: Thailand Portable Generator Market Revenue (Million) Forecast, by Application 2020 & 2033
- Table 66: Thailand Portable Generator Market Volume (K Unit) Forecast, by Application 2020 & 2033
- Table 67: Indonesia Portable Generator Market Revenue (Million) Forecast, by Application 2020 & 2033
- Table 68: Indonesia Portable Generator Market Volume (K Unit) Forecast, by Application 2020 & 2033
- Table 69: Vietnam Portable Generator Market Revenue (Million) Forecast, by Application 2020 & 2033
- Table 70: Vietnam Portable Generator Market Volume (K Unit) Forecast, by Application 2020 & 2033
- Table 71: Rest of Asia Pacific Portable Generator Market Revenue (Million) Forecast, by Application 2020 & 2033
- Table 72: Rest of Asia Pacific Portable Generator Market Volume (K Unit) Forecast, by Application 2020 & 2033
- Table 73: Global Portable Generator Market Revenue Million Forecast, by Power Rating 2020 & 2033
- Table 74: Global Portable Generator Market Volume K Unit Forecast, by Power Rating 2020 & 2033
- Table 75: Global Portable Generator Market Revenue Million Forecast, by Fuel Type 2020 & 2033
- Table 76: Global Portable Generator Market Volume K Unit Forecast, by Fuel Type 2020 & 2033
- Table 77: Global Portable Generator Market Revenue Million Forecast, by End User 2020 & 2033
- Table 78: Global Portable Generator Market Volume K Unit Forecast, by End User 2020 & 2033
- Table 79: Global Portable Generator Market Revenue Million Forecast, by Country 2020 & 2033
- Table 80: Global Portable Generator Market Volume K Unit Forecast, by Country 2020 & 2033
- Table 81: Brazil Portable Generator Market Revenue (Million) Forecast, by Application 2020 & 2033
- Table 82: Brazil Portable Generator Market Volume (K Unit) Forecast, by Application 2020 & 2033
- Table 83: Argentina Portable Generator Market Revenue (Million) Forecast, by Application 2020 & 2033
- Table 84: Argentina Portable Generator Market Volume (K Unit) Forecast, by Application 2020 & 2033
- Table 85: Colombia Portable Generator Market Revenue (Million) Forecast, by Application 2020 & 2033
- Table 86: Colombia Portable Generator Market Volume (K Unit) Forecast, by Application 2020 & 2033
- Table 87: Rest of South America Portable Generator Market Revenue (Million) Forecast, by Application 2020 & 2033
- Table 88: Rest of South America Portable Generator Market Volume (K Unit) Forecast, by Application 2020 & 2033
- Table 89: Global Portable Generator Market Revenue Million Forecast, by Power Rating 2020 & 2033
- Table 90: Global Portable Generator Market Volume K Unit Forecast, by Power Rating 2020 & 2033
- Table 91: Global Portable Generator Market Revenue Million Forecast, by Fuel Type 2020 & 2033
- Table 92: Global Portable Generator Market Volume K Unit Forecast, by Fuel Type 2020 & 2033
- Table 93: Global Portable Generator Market Revenue Million Forecast, by End User 2020 & 2033
- Table 94: Global Portable Generator Market Volume K Unit Forecast, by End User 2020 & 2033
- Table 95: Global Portable Generator Market Revenue Million Forecast, by Country 2020 & 2033
- Table 96: Global Portable Generator Market Volume K Unit Forecast, by Country 2020 & 2033
- Table 97: United Arab Emirates Portable Generator Market Revenue (Million) Forecast, by Application 2020 & 2033
- Table 98: United Arab Emirates Portable Generator Market Volume (K Unit) Forecast, by Application 2020 & 2033
- Table 99: Saudi Arabia Portable Generator Market Revenue (Million) Forecast, by Application 2020 & 2033
- Table 100: Saudi Arabia Portable Generator Market Volume (K Unit) Forecast, by Application 2020 & 2033
- Table 101: Nigeria Portable Generator Market Revenue (Million) Forecast, by Application 2020 & 2033
- Table 102: Nigeria Portable Generator Market Volume (K Unit) Forecast, by Application 2020 & 2033
- Table 103: Rest of Middle East and Africa Portable Generator Market Revenue (Million) Forecast, by Application 2020 & 2033
- Table 104: Rest of Middle East and Africa Portable Generator Market Volume (K Unit) Forecast, by Application 2020 & 2033
Frequently Asked Questions
1. What is the projected Compound Annual Growth Rate (CAGR) of the Portable Generator Market?
The projected CAGR is approximately 5.86%.
2. Which companies are prominent players in the Portable Generator Market?
Key companies in the market include Yamaha Motor Co Ltd *List Not Exhaustive 6 4 Market Ranking/Share Analysi, Briggs & Stratton Corporation, Atlas Copco AB, Eaton Corporation PLC, Caterpillar Inc, Honda Siel Power Products Ltd, Kohler Power Systems, Wacker Neuson SE, Generac Holdings Inc.
3. What are the main segments of the Portable Generator Market?
The market segments include Power Rating, Fuel Type, End User.
4. Can you provide details about the market size?
The market size is estimated to be USD 5.53 Million as of 2022.
5. What are some drivers contributing to market growth?
Increasing Demand for Power.
6. What are the notable trends driving market growth?
Industrial Sector to be a Significant Market Segment.
7. Are there any restraints impacting market growth?
Increasing Demand for Battery Storage Systems and other Cleaner Sources of Standby Power.
8. Can you provide examples of recent developments in the market?
February 2023: Caterpillar announced the launch of the XQ330 mobile diesel generator powered by the Cat C9.3B diesel engine; the XQ330 is rated for up to 288 kW in standby and 264 kW in prime operation at 60 Hz and up to 341 kVA in standby and 310 kVA in prime power applications at 50 Hz. Engineered to operate at low noise levels, the XQ330 packages system components in a weather-resistant enclosure. It is also equipped with several rental-ready features, including a battery charger, block heater, switchable voltage outputs, permanent magnet generator (PMG), and optional mounting on a trailer.
9. What pricing options are available for accessing the report?
Pricing options include single-user, multi-user, and enterprise licenses priced at USD 4750, USD 5250, and USD 8750 respectively.
10. Is the market size provided in terms of value or volume?
The market size is provided in terms of value, measured in Million and volume, measured in K Unit.
11. Are there any specific market keywords associated with the report?
Yes, the market keyword associated with the report is "Portable Generator Market," which aids in identifying and referencing the specific market segment covered.
12. How do I determine which pricing option suits my needs best?
The pricing options vary based on user requirements and access needs. Individual users may opt for single-user licenses, while businesses requiring broader access may choose multi-user or enterprise licenses for cost-effective access to the report.
13. Are there any additional resources or data provided in the Portable Generator Market report?
While the report offers comprehensive insights, it's advisable to review the specific contents or supplementary materials provided to ascertain if additional resources or data are available.
14. How can I stay updated on further developments or reports in the Portable Generator Market?
To stay informed about further developments, trends, and reports in the Portable Generator Market, consider subscribing to industry newsletters, following relevant companies and organizations, or regularly checking reputable industry news sources and publications.
Methodology
Step 1 - Identification of Relevant Samples Size from Population Database


Step 2 - Approaches for Defining Global Market Size (Value, Volume* & Price*)

Note*: In applicable scenarios
Step 3 - Data Sources
Primary Research
- Web Analytics
- Survey Reports
- Research Institute
- Latest Research Reports
- Opinion Leaders
Secondary Research
- Annual Reports
- White Paper
- Latest Press Release
- Industry Association
- Paid Database
- Investor Presentations

Step 4 - Data Triangulation
Involves using different sources of information in order to increase the validity of a study
These sources are likely to be stakeholders in a program - participants, other researchers, program staff, other community members, and so on.
Then we put all data in single framework & apply various statistical tools to find out the dynamic on the market.
During the analysis stage, feedback from the stakeholder groups would be compared to determine areas of agreement as well as areas of divergence