

Key Insights
The global popcorn container market is poised for robust expansion, driven by the sustained popularity of popcorn as a convenient and accessible snack. Key growth catalysts include the escalating demand for ready-to-eat options, the widespread presence of cinemas and entertainment hubs, and a growing consumer preference for sustainable packaging solutions. Leading manufacturers such as Gold Medal Products, PLUS PAPER FOODPAC, and International Paper are at the forefront of innovation, introducing diverse container formats from classic paperboard to advanced biodegradable and compostable alternatives. The market is segmented by container type, size, and material, addressing a spectrum of consumer needs. Despite potential headwinds from raw material cost volatility and economic fluctuations, the market trajectory remains favorable, underpinned by continuous innovation and persistent consumer appetite for popcorn.
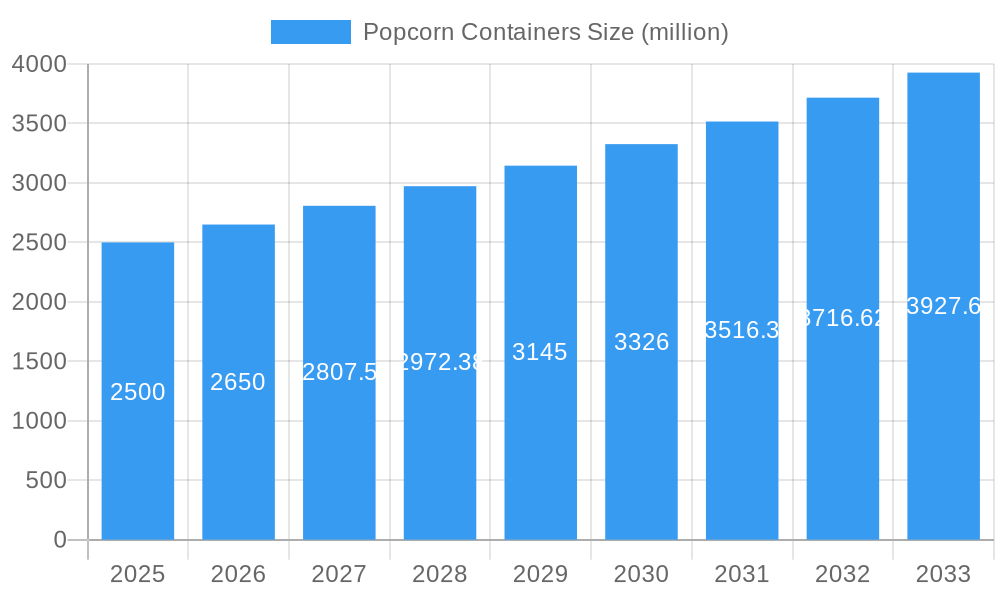
Popcorn Containers Market Size (In Million)
This growth is projected to continue throughout the forecast period (2025-2033), with an estimated Compound Annual Growth Rate (CAGR) of 9.8%. The market size was valued at 599.2 million in the base year, 2023. The competitive environment features a blend of established leaders and specialized players, fostering a wide array of product offerings and pricing structures. Regional consumption patterns will shape market dynamics, with North America and Europe anticipated to retain substantial market shares. Strategic initiatives by companies are focused on enhancing product functionalities, such as improved barrier properties for extended shelf life, and customer-centric designs, contributing to steady market growth. Environmental considerations are increasingly influential, driving the adoption of eco-friendly materials and responsible production methods.
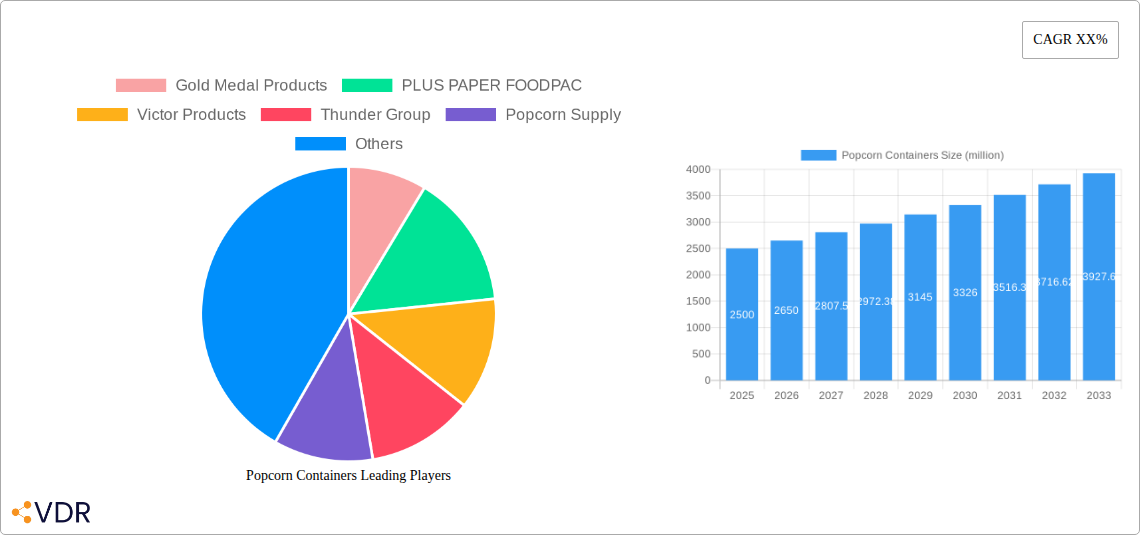
Popcorn Containers Company Market Share
Popcorn Containers Market Report: 2019-2033
This comprehensive report provides an in-depth analysis of the global popcorn containers market, offering invaluable insights for industry professionals, investors, and strategic decision-makers. The study covers the period 2019-2033, with a focus on the forecast period 2025-2033, using 2025 as the base year. The report segments the market by various factors and analyzes key players such as Gold Medal Products, PLUS PAPER FOODPAC, Victor Products, and others, providing a detailed understanding of market dynamics, growth trends, and future opportunities. The market is valued at xx million units in 2025 and is projected to reach xx million units by 2033.
Popcorn Containers Market Dynamics & Structure
This section analyzes the competitive landscape, technological advancements, regulatory influences, and market trends within the popcorn containers industry. The market is moderately fragmented, with several key players competing for market share. Gold Medal Products, PLUS PAPER FOODPAC, and Victor Products are among the established players. However, smaller regional players and new entrants are also contributing to the market's dynamism.
- Market Concentration: The Herfindahl-Hirschman Index (HHI) is estimated at xx, indicating a moderately concentrated market.
- Technological Innovation: Key drivers include the development of eco-friendly materials (e.g., biodegradable, compostable options) and improved printing technologies for enhanced branding. Barriers include high initial investment costs for new technologies and the need for regulatory approvals for novel materials.
- Regulatory Frameworks: Regulations related to food safety and environmental sustainability significantly influence material selection and manufacturing processes.
- Competitive Substitutes: Alternative packaging solutions like bags and tubs pose some level of competition, but the unique advantages of popcorn containers (e.g., convenience, branding opportunities) maintain their market position.
- End-User Demographics: The primary end-users are movie theaters, popcorn stands, supermarkets, and food service businesses. Growing demand from online popcorn delivery services presents a new avenue for growth.
- M&A Trends: The number of M&A deals in the sector has averaged xx per year during the historical period (2019-2024), with a focus on expanding product portfolios and geographic reach.
Popcorn Containers Growth Trends & Insights
The global popcorn containers market exhibited a CAGR of xx% during 2019-2024 and is projected to grow at a CAGR of xx% from 2025 to 2033. This growth is fueled by increasing consumer demand for convenient snack packaging, the expansion of the popcorn industry (both traditional and gourmet), and the rising popularity of online food delivery services. Technological advancements, such as the introduction of sustainable materials and innovative designs, are also contributing to market expansion. Market penetration is currently at approximately xx% in developed countries and is expected to rise significantly in emerging markets. Consumer behavior shifts toward healthier snacking options and greater environmental consciousness are driving demand for eco-friendly alternatives. The shift towards online ordering and delivery also presents opportunities for specialized packaging designs that improve product protection during transit.
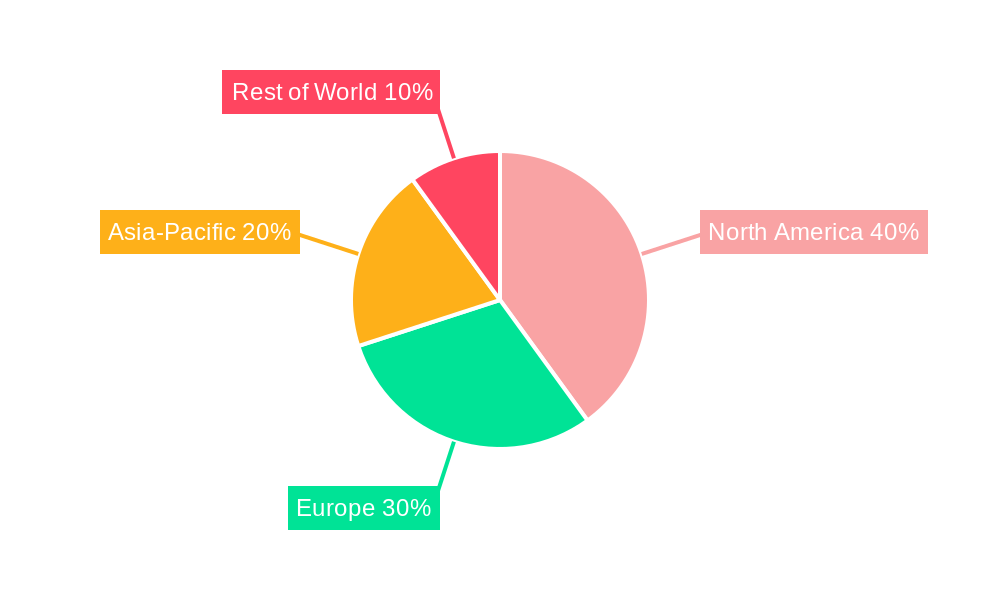
Dominant Regions, Countries, or Segments in Popcorn Containers
North America currently dominates the global popcorn containers market, accounting for xx% of the total market share in 2025. This dominance is primarily attributed to strong demand from the large and well-established movie theater and food service industries in the region. However, the Asia-Pacific region is expected to witness the fastest growth during the forecast period, driven by rapid economic growth, rising disposable incomes, and a burgeoning food service sector.
- North America: High per capita consumption of popcorn, established distribution networks, and a robust movie theater industry.
- Europe: Moderate growth driven by increasing health consciousness and demand for eco-friendly packaging options.
- Asia-Pacific: Rapid expansion propelled by rising disposable incomes, expanding food service sector, and increasing urbanization.
Popcorn Containers Product Landscape
The popcorn containers market offers a diverse range of products, from standard paperboard containers to more premium options with innovative designs and materials. The emphasis is shifting towards eco-friendly solutions, including biodegradable and compostable materials. These new options often incorporate enhanced features such as improved grease resistance, microwave-safe designs, and customizable printing options for branding purposes. Several companies are focusing on developing containers with unique shapes and sizes to cater to different consumer preferences and product offerings.
Key Drivers, Barriers & Challenges in Popcorn Containers
Key Drivers:
- Growing demand for convenient snack packaging.
- Expansion of the popcorn industry (both traditional and gourmet segments).
- Increasing popularity of online food delivery.
- Rise in consumer demand for eco-friendly packaging options.
Key Challenges:
- Fluctuations in raw material prices (e.g., paper pulp).
- Intense competition among manufacturers.
- Stringent environmental regulations related to packaging waste.
- Supply chain disruptions impacting timely delivery.
Emerging Opportunities in Popcorn Containers
Untapped markets in developing countries present significant opportunities. Growing popularity of home-movie nights and increased demand for convenient snacking options at home are contributing factors. Moreover, there's considerable potential for innovation in functional aspects, such as creating containers that keep popcorn fresher for longer or integrate heating elements for convenience. Customization options, through unique printing and designs, offer another opportunity for growth.
Growth Accelerators in the Popcorn Containers Industry
Technological advancements, particularly in sustainable materials and printing technologies, are key growth accelerators. Strategic partnerships between container manufacturers and popcorn producers can also enhance market penetration. Companies are increasingly focusing on expanding their geographic presence to capitalize on untapped markets and gain a competitive edge.
Key Players Shaping the Popcorn Containers Market
- Gold Medal Products
- PLUS PAPER FOODPAC
- Victor Products
- Thunder Group
- Popcorn Supply
- WABASH VALLEY FARMS
- Southern Champion Tray
- DixiePopcorn Boxes
- International Paper
- My Popcorn Boxes
- Shenzhen Zhongjie Gifts
- Shanghai Pureco Packaging Products
Notable Milestones in Popcorn Containers Sector
- 2020: Introduction of fully compostable popcorn containers by several key players.
- 2022: Partnership between a major popcorn producer and a packaging company to develop customized containers for online delivery.
- 2023: Several mergers and acquisitions, aimed at expanding production capacity and market reach.
In-Depth Popcorn Containers Market Outlook
The future of the popcorn containers market appears promising, driven by ongoing growth in the broader popcorn industry and an increasing focus on sustainable and innovative packaging solutions. Strategic partnerships and geographical expansion will play a crucial role in market dominance, while continued innovation in materials and designs will create new opportunities. The market is poised for sustained growth, with a high potential for further consolidation and expansion among leading players.
Popcorn Containers Segmentation
-
1. Application
- 1.1. Sports
- 1.2. Movie theaters
- 1.3. Retail
- 1.4. Others
-
2. Types
- 2.1. Plastic
- 2.2. Paper
- 2.3. Metal
Popcorn Containers Segmentation By Geography
-
1. North America
- 1.1. United States
- 1.2. Canada
- 1.3. Mexico
-
2. South America
- 2.1. Brazil
- 2.2. Argentina
- 2.3. Rest of South America
-
3. Europe
- 3.1. United Kingdom
- 3.2. Germany
- 3.3. France
- 3.4. Italy
- 3.5. Spain
- 3.6. Russia
- 3.7. Benelux
- 3.8. Nordics
- 3.9. Rest of Europe
-
4. Middle East & Africa
- 4.1. Turkey
- 4.2. Israel
- 4.3. GCC
- 4.4. North Africa
- 4.5. South Africa
- 4.6. Rest of Middle East & Africa
-
5. Asia Pacific
- 5.1. China
- 5.2. India
- 5.3. Japan
- 5.4. South Korea
- 5.5. ASEAN
- 5.6. Oceania
- 5.7. Rest of Asia Pacific
Popcorn Containers Regional Market Share
Geographic Coverage of Popcorn Containers
Popcorn Containers REPORT HIGHLIGHTS
| Aspects | Details |
|---|---|
| Study Period | 2020-2034 |
| Base Year | 2025 |
| Estimated Year | 2026 |
| Forecast Period | 2026-2034 |
| Historical Period | 2020-2025 |
| Growth Rate | CAGR of 9.8% from 2020-2034 |
| Segmentation |
|
Table of Contents
- 1. Introduction
- 1.1. Research Scope
- 1.2. Market Segmentation
- 1.3. Research Objective
- 1.4. Definitions and Assumptions
- 2. Executive Summary
- 2.1. Market Snapshot
- 3. Market Dynamics
- 3.1. Market Drivers
- 3.2. Market Restrains
- 3.3. Market Trends
- 3.4. Market Opportunities
- 4. Market Factor Analysis
- 4.1. Porters Five Forces
- 4.1.1. Bargaining Power of Suppliers
- 4.1.2. Bargaining Power of Buyers
- 4.1.3. Threat of New Entrants
- 4.1.4. Threat of Substitutes
- 4.1.5. Competitive Rivalry
- 4.2. PESTEL analysis
- 4.3. BCG Analysis
- 4.3.1. Stars (High Growth, High Market Share)
- 4.3.2. Cash Cows (Low Growth, High Market Share)
- 4.3.3. Question Mark (High Growth, Low Market Share)
- 4.3.4. Dogs (Low Growth, Low Market Share)
- 4.4. Ansoff Matrix Analysis
- 4.5. Supply Chain Analysis
- 4.6. Regulatory Landscape
- 4.7. Current Market Potential and Opportunity Assessment (TAM–SAM–SOM Framework)
- 4.8. VDR Analyst Note
- 4.1. Porters Five Forces
- 5. Market Analysis, Insights and Forecast 2021-2033
- 5.1. Market Analysis, Insights and Forecast - by Application
- 5.1.1. Sports
- 5.1.2. Movie theaters
- 5.1.3. Retail
- 5.1.4. Others
- 5.2. Market Analysis, Insights and Forecast - by Types
- 5.2.1. Plastic
- 5.2.2. Paper
- 5.2.3. Metal
- 5.3. Market Analysis, Insights and Forecast - by Region
- 5.3.1. North America
- 5.3.2. South America
- 5.3.3. Europe
- 5.3.4. Middle East & Africa
- 5.3.5. Asia Pacific
- 5.1. Market Analysis, Insights and Forecast - by Application
- 6. Global Popcorn Containers Analysis, Insights and Forecast, 2021-2033
- 6.1. Market Analysis, Insights and Forecast - by Application
- 6.1.1. Sports
- 6.1.2. Movie theaters
- 6.1.3. Retail
- 6.1.4. Others
- 6.2. Market Analysis, Insights and Forecast - by Types
- 6.2.1. Plastic
- 6.2.2. Paper
- 6.2.3. Metal
- 6.1. Market Analysis, Insights and Forecast - by Application
- 7. North America Popcorn Containers Analysis, Insights and Forecast, 2021-2033
- 7.1. Market Analysis, Insights and Forecast - by Application
- 7.1.1. Sports
- 7.1.2. Movie theaters
- 7.1.3. Retail
- 7.1.4. Others
- 7.2. Market Analysis, Insights and Forecast - by Types
- 7.2.1. Plastic
- 7.2.2. Paper
- 7.2.3. Metal
- 7.1. Market Analysis, Insights and Forecast - by Application
- 8. South America Popcorn Containers Analysis, Insights and Forecast, 2021-2033
- 8.1. Market Analysis, Insights and Forecast - by Application
- 8.1.1. Sports
- 8.1.2. Movie theaters
- 8.1.3. Retail
- 8.1.4. Others
- 8.2. Market Analysis, Insights and Forecast - by Types
- 8.2.1. Plastic
- 8.2.2. Paper
- 8.2.3. Metal
- 8.1. Market Analysis, Insights and Forecast - by Application
- 9. Europe Popcorn Containers Analysis, Insights and Forecast, 2021-2033
- 9.1. Market Analysis, Insights and Forecast - by Application
- 9.1.1. Sports
- 9.1.2. Movie theaters
- 9.1.3. Retail
- 9.1.4. Others
- 9.2. Market Analysis, Insights and Forecast - by Types
- 9.2.1. Plastic
- 9.2.2. Paper
- 9.2.3. Metal
- 9.1. Market Analysis, Insights and Forecast - by Application
- 10. Middle East & Africa Popcorn Containers Analysis, Insights and Forecast, 2021-2033
- 10.1. Market Analysis, Insights and Forecast - by Application
- 10.1.1. Sports
- 10.1.2. Movie theaters
- 10.1.3. Retail
- 10.1.4. Others
- 10.2. Market Analysis, Insights and Forecast - by Types
- 10.2.1. Plastic
- 10.2.2. Paper
- 10.2.3. Metal
- 10.1. Market Analysis, Insights and Forecast - by Application
- 11. Asia Pacific Popcorn Containers Analysis, Insights and Forecast, 2021-2033
- 11.1. Market Analysis, Insights and Forecast - by Application
- 11.1.1. Sports
- 11.1.2. Movie theaters
- 11.1.3. Retail
- 11.1.4. Others
- 11.2. Market Analysis, Insights and Forecast - by Types
- 11.2.1. Plastic
- 11.2.2. Paper
- 11.2.3. Metal
- 11.1. Market Analysis, Insights and Forecast - by Application
- 12. Competitive Analysis
- 12.1. Company Profiles
- 12.1.1 Gold Medal Products
- 12.1.1.1. Company Overview
- 12.1.1.2. Products
- 12.1.1.3. Company Financials
- 12.1.1.4. SWOT Analysis
- 12.1.2 PLUS PAPER FOODPAC
- 12.1.2.1. Company Overview
- 12.1.2.2. Products
- 12.1.2.3. Company Financials
- 12.1.2.4. SWOT Analysis
- 12.1.3 Victor Products
- 12.1.3.1. Company Overview
- 12.1.3.2. Products
- 12.1.3.3. Company Financials
- 12.1.3.4. SWOT Analysis
- 12.1.4 Thunder Group
- 12.1.4.1. Company Overview
- 12.1.4.2. Products
- 12.1.4.3. Company Financials
- 12.1.4.4. SWOT Analysis
- 12.1.5 Popcorn Supply
- 12.1.5.1. Company Overview
- 12.1.5.2. Products
- 12.1.5.3. Company Financials
- 12.1.5.4. SWOT Analysis
- 12.1.6 WABASH VALLEY FARMS
- 12.1.6.1. Company Overview
- 12.1.6.2. Products
- 12.1.6.3. Company Financials
- 12.1.6.4. SWOT Analysis
- 12.1.7 Southern Champion Tray
- 12.1.7.1. Company Overview
- 12.1.7.2. Products
- 12.1.7.3. Company Financials
- 12.1.7.4. SWOT Analysis
- 12.1.8 DixiePopcorn Boxes
- 12.1.8.1. Company Overview
- 12.1.8.2. Products
- 12.1.8.3. Company Financials
- 12.1.8.4. SWOT Analysis
- 12.1.9 International Paper
- 12.1.9.1. Company Overview
- 12.1.9.2. Products
- 12.1.9.3. Company Financials
- 12.1.9.4. SWOT Analysis
- 12.1.10 My Popcorn Boxes
- 12.1.10.1. Company Overview
- 12.1.10.2. Products
- 12.1.10.3. Company Financials
- 12.1.10.4. SWOT Analysis
- 12.1.11 Shenzhen Zhongjie Gifts
- 12.1.11.1. Company Overview
- 12.1.11.2. Products
- 12.1.11.3. Company Financials
- 12.1.11.4. SWOT Analysis
- 12.1.12 Shanghai Pureco Packaging Products
- 12.1.12.1. Company Overview
- 12.1.12.2. Products
- 12.1.12.3. Company Financials
- 12.1.12.4. SWOT Analysis
- 12.1.1 Gold Medal Products
- 12.2. Market Entropy
- 12.2.1 Company's Key Areas Served
- 12.2.2 Recent Developments
- 12.3. Company Market Share Analysis 2025
- 12.3.1 Top 5 Companies Market Share Analysis
- 12.3.2 Top 3 Companies Market Share Analysis
- 12.4. List of Potential Customers
- 13. Research Methodology
List of Figures
- Figure 1: Global Popcorn Containers Revenue Breakdown (million, %) by Region 2025 & 2033
- Figure 2: Global Popcorn Containers Volume Breakdown (K, %) by Region 2025 & 2033
- Figure 3: North America Popcorn Containers Revenue (million), by Application 2025 & 2033
- Figure 4: North America Popcorn Containers Volume (K), by Application 2025 & 2033
- Figure 5: North America Popcorn Containers Revenue Share (%), by Application 2025 & 2033
- Figure 6: North America Popcorn Containers Volume Share (%), by Application 2025 & 2033
- Figure 7: North America Popcorn Containers Revenue (million), by Types 2025 & 2033
- Figure 8: North America Popcorn Containers Volume (K), by Types 2025 & 2033
- Figure 9: North America Popcorn Containers Revenue Share (%), by Types 2025 & 2033
- Figure 10: North America Popcorn Containers Volume Share (%), by Types 2025 & 2033
- Figure 11: North America Popcorn Containers Revenue (million), by Country 2025 & 2033
- Figure 12: North America Popcorn Containers Volume (K), by Country 2025 & 2033
- Figure 13: North America Popcorn Containers Revenue Share (%), by Country 2025 & 2033
- Figure 14: North America Popcorn Containers Volume Share (%), by Country 2025 & 2033
- Figure 15: South America Popcorn Containers Revenue (million), by Application 2025 & 2033
- Figure 16: South America Popcorn Containers Volume (K), by Application 2025 & 2033
- Figure 17: South America Popcorn Containers Revenue Share (%), by Application 2025 & 2033
- Figure 18: South America Popcorn Containers Volume Share (%), by Application 2025 & 2033
- Figure 19: South America Popcorn Containers Revenue (million), by Types 2025 & 2033
- Figure 20: South America Popcorn Containers Volume (K), by Types 2025 & 2033
- Figure 21: South America Popcorn Containers Revenue Share (%), by Types 2025 & 2033
- Figure 22: South America Popcorn Containers Volume Share (%), by Types 2025 & 2033
- Figure 23: South America Popcorn Containers Revenue (million), by Country 2025 & 2033
- Figure 24: South America Popcorn Containers Volume (K), by Country 2025 & 2033
- Figure 25: South America Popcorn Containers Revenue Share (%), by Country 2025 & 2033
- Figure 26: South America Popcorn Containers Volume Share (%), by Country 2025 & 2033
- Figure 27: Europe Popcorn Containers Revenue (million), by Application 2025 & 2033
- Figure 28: Europe Popcorn Containers Volume (K), by Application 2025 & 2033
- Figure 29: Europe Popcorn Containers Revenue Share (%), by Application 2025 & 2033
- Figure 30: Europe Popcorn Containers Volume Share (%), by Application 2025 & 2033
- Figure 31: Europe Popcorn Containers Revenue (million), by Types 2025 & 2033
- Figure 32: Europe Popcorn Containers Volume (K), by Types 2025 & 2033
- Figure 33: Europe Popcorn Containers Revenue Share (%), by Types 2025 & 2033
- Figure 34: Europe Popcorn Containers Volume Share (%), by Types 2025 & 2033
- Figure 35: Europe Popcorn Containers Revenue (million), by Country 2025 & 2033
- Figure 36: Europe Popcorn Containers Volume (K), by Country 2025 & 2033
- Figure 37: Europe Popcorn Containers Revenue Share (%), by Country 2025 & 2033
- Figure 38: Europe Popcorn Containers Volume Share (%), by Country 2025 & 2033
- Figure 39: Middle East & Africa Popcorn Containers Revenue (million), by Application 2025 & 2033
- Figure 40: Middle East & Africa Popcorn Containers Volume (K), by Application 2025 & 2033
- Figure 41: Middle East & Africa Popcorn Containers Revenue Share (%), by Application 2025 & 2033
- Figure 42: Middle East & Africa Popcorn Containers Volume Share (%), by Application 2025 & 2033
- Figure 43: Middle East & Africa Popcorn Containers Revenue (million), by Types 2025 & 2033
- Figure 44: Middle East & Africa Popcorn Containers Volume (K), by Types 2025 & 2033
- Figure 45: Middle East & Africa Popcorn Containers Revenue Share (%), by Types 2025 & 2033
- Figure 46: Middle East & Africa Popcorn Containers Volume Share (%), by Types 2025 & 2033
- Figure 47: Middle East & Africa Popcorn Containers Revenue (million), by Country 2025 & 2033
- Figure 48: Middle East & Africa Popcorn Containers Volume (K), by Country 2025 & 2033
- Figure 49: Middle East & Africa Popcorn Containers Revenue Share (%), by Country 2025 & 2033
- Figure 50: Middle East & Africa Popcorn Containers Volume Share (%), by Country 2025 & 2033
- Figure 51: Asia Pacific Popcorn Containers Revenue (million), by Application 2025 & 2033
- Figure 52: Asia Pacific Popcorn Containers Volume (K), by Application 2025 & 2033
- Figure 53: Asia Pacific Popcorn Containers Revenue Share (%), by Application 2025 & 2033
- Figure 54: Asia Pacific Popcorn Containers Volume Share (%), by Application 2025 & 2033
- Figure 55: Asia Pacific Popcorn Containers Revenue (million), by Types 2025 & 2033
- Figure 56: Asia Pacific Popcorn Containers Volume (K), by Types 2025 & 2033
- Figure 57: Asia Pacific Popcorn Containers Revenue Share (%), by Types 2025 & 2033
- Figure 58: Asia Pacific Popcorn Containers Volume Share (%), by Types 2025 & 2033
- Figure 59: Asia Pacific Popcorn Containers Revenue (million), by Country 2025 & 2033
- Figure 60: Asia Pacific Popcorn Containers Volume (K), by Country 2025 & 2033
- Figure 61: Asia Pacific Popcorn Containers Revenue Share (%), by Country 2025 & 2033
- Figure 62: Asia Pacific Popcorn Containers Volume Share (%), by Country 2025 & 2033
List of Tables
- Table 1: Global Popcorn Containers Revenue million Forecast, by Application 2020 & 2033
- Table 2: Global Popcorn Containers Volume K Forecast, by Application 2020 & 2033
- Table 3: Global Popcorn Containers Revenue million Forecast, by Types 2020 & 2033
- Table 4: Global Popcorn Containers Volume K Forecast, by Types 2020 & 2033
- Table 5: Global Popcorn Containers Revenue million Forecast, by Region 2020 & 2033
- Table 6: Global Popcorn Containers Volume K Forecast, by Region 2020 & 2033
- Table 7: Global Popcorn Containers Revenue million Forecast, by Application 2020 & 2033
- Table 8: Global Popcorn Containers Volume K Forecast, by Application 2020 & 2033
- Table 9: Global Popcorn Containers Revenue million Forecast, by Types 2020 & 2033
- Table 10: Global Popcorn Containers Volume K Forecast, by Types 2020 & 2033
- Table 11: Global Popcorn Containers Revenue million Forecast, by Country 2020 & 2033
- Table 12: Global Popcorn Containers Volume K Forecast, by Country 2020 & 2033
- Table 13: United States Popcorn Containers Revenue (million) Forecast, by Application 2020 & 2033
- Table 14: United States Popcorn Containers Volume (K) Forecast, by Application 2020 & 2033
- Table 15: Canada Popcorn Containers Revenue (million) Forecast, by Application 2020 & 2033
- Table 16: Canada Popcorn Containers Volume (K) Forecast, by Application 2020 & 2033
- Table 17: Mexico Popcorn Containers Revenue (million) Forecast, by Application 2020 & 2033
- Table 18: Mexico Popcorn Containers Volume (K) Forecast, by Application 2020 & 2033
- Table 19: Global Popcorn Containers Revenue million Forecast, by Application 2020 & 2033
- Table 20: Global Popcorn Containers Volume K Forecast, by Application 2020 & 2033
- Table 21: Global Popcorn Containers Revenue million Forecast, by Types 2020 & 2033
- Table 22: Global Popcorn Containers Volume K Forecast, by Types 2020 & 2033
- Table 23: Global Popcorn Containers Revenue million Forecast, by Country 2020 & 2033
- Table 24: Global Popcorn Containers Volume K Forecast, by Country 2020 & 2033
- Table 25: Brazil Popcorn Containers Revenue (million) Forecast, by Application 2020 & 2033
- Table 26: Brazil Popcorn Containers Volume (K) Forecast, by Application 2020 & 2033
- Table 27: Argentina Popcorn Containers Revenue (million) Forecast, by Application 2020 & 2033
- Table 28: Argentina Popcorn Containers Volume (K) Forecast, by Application 2020 & 2033
- Table 29: Rest of South America Popcorn Containers Revenue (million) Forecast, by Application 2020 & 2033
- Table 30: Rest of South America Popcorn Containers Volume (K) Forecast, by Application 2020 & 2033
- Table 31: Global Popcorn Containers Revenue million Forecast, by Application 2020 & 2033
- Table 32: Global Popcorn Containers Volume K Forecast, by Application 2020 & 2033
- Table 33: Global Popcorn Containers Revenue million Forecast, by Types 2020 & 2033
- Table 34: Global Popcorn Containers Volume K Forecast, by Types 2020 & 2033
- Table 35: Global Popcorn Containers Revenue million Forecast, by Country 2020 & 2033
- Table 36: Global Popcorn Containers Volume K Forecast, by Country 2020 & 2033
- Table 37: United Kingdom Popcorn Containers Revenue (million) Forecast, by Application 2020 & 2033
- Table 38: United Kingdom Popcorn Containers Volume (K) Forecast, by Application 2020 & 2033
- Table 39: Germany Popcorn Containers Revenue (million) Forecast, by Application 2020 & 2033
- Table 40: Germany Popcorn Containers Volume (K) Forecast, by Application 2020 & 2033
- Table 41: France Popcorn Containers Revenue (million) Forecast, by Application 2020 & 2033
- Table 42: France Popcorn Containers Volume (K) Forecast, by Application 2020 & 2033
- Table 43: Italy Popcorn Containers Revenue (million) Forecast, by Application 2020 & 2033
- Table 44: Italy Popcorn Containers Volume (K) Forecast, by Application 2020 & 2033
- Table 45: Spain Popcorn Containers Revenue (million) Forecast, by Application 2020 & 2033
- Table 46: Spain Popcorn Containers Volume (K) Forecast, by Application 2020 & 2033
- Table 47: Russia Popcorn Containers Revenue (million) Forecast, by Application 2020 & 2033
- Table 48: Russia Popcorn Containers Volume (K) Forecast, by Application 2020 & 2033
- Table 49: Benelux Popcorn Containers Revenue (million) Forecast, by Application 2020 & 2033
- Table 50: Benelux Popcorn Containers Volume (K) Forecast, by Application 2020 & 2033
- Table 51: Nordics Popcorn Containers Revenue (million) Forecast, by Application 2020 & 2033
- Table 52: Nordics Popcorn Containers Volume (K) Forecast, by Application 2020 & 2033
- Table 53: Rest of Europe Popcorn Containers Revenue (million) Forecast, by Application 2020 & 2033
- Table 54: Rest of Europe Popcorn Containers Volume (K) Forecast, by Application 2020 & 2033
- Table 55: Global Popcorn Containers Revenue million Forecast, by Application 2020 & 2033
- Table 56: Global Popcorn Containers Volume K Forecast, by Application 2020 & 2033
- Table 57: Global Popcorn Containers Revenue million Forecast, by Types 2020 & 2033
- Table 58: Global Popcorn Containers Volume K Forecast, by Types 2020 & 2033
- Table 59: Global Popcorn Containers Revenue million Forecast, by Country 2020 & 2033
- Table 60: Global Popcorn Containers Volume K Forecast, by Country 2020 & 2033
- Table 61: Turkey Popcorn Containers Revenue (million) Forecast, by Application 2020 & 2033
- Table 62: Turkey Popcorn Containers Volume (K) Forecast, by Application 2020 & 2033
- Table 63: Israel Popcorn Containers Revenue (million) Forecast, by Application 2020 & 2033
- Table 64: Israel Popcorn Containers Volume (K) Forecast, by Application 2020 & 2033
- Table 65: GCC Popcorn Containers Revenue (million) Forecast, by Application 2020 & 2033
- Table 66: GCC Popcorn Containers Volume (K) Forecast, by Application 2020 & 2033
- Table 67: North Africa Popcorn Containers Revenue (million) Forecast, by Application 2020 & 2033
- Table 68: North Africa Popcorn Containers Volume (K) Forecast, by Application 2020 & 2033
- Table 69: South Africa Popcorn Containers Revenue (million) Forecast, by Application 2020 & 2033
- Table 70: South Africa Popcorn Containers Volume (K) Forecast, by Application 2020 & 2033
- Table 71: Rest of Middle East & Africa Popcorn Containers Revenue (million) Forecast, by Application 2020 & 2033
- Table 72: Rest of Middle East & Africa Popcorn Containers Volume (K) Forecast, by Application 2020 & 2033
- Table 73: Global Popcorn Containers Revenue million Forecast, by Application 2020 & 2033
- Table 74: Global Popcorn Containers Volume K Forecast, by Application 2020 & 2033
- Table 75: Global Popcorn Containers Revenue million Forecast, by Types 2020 & 2033
- Table 76: Global Popcorn Containers Volume K Forecast, by Types 2020 & 2033
- Table 77: Global Popcorn Containers Revenue million Forecast, by Country 2020 & 2033
- Table 78: Global Popcorn Containers Volume K Forecast, by Country 2020 & 2033
- Table 79: China Popcorn Containers Revenue (million) Forecast, by Application 2020 & 2033
- Table 80: China Popcorn Containers Volume (K) Forecast, by Application 2020 & 2033
- Table 81: India Popcorn Containers Revenue (million) Forecast, by Application 2020 & 2033
- Table 82: India Popcorn Containers Volume (K) Forecast, by Application 2020 & 2033
- Table 83: Japan Popcorn Containers Revenue (million) Forecast, by Application 2020 & 2033
- Table 84: Japan Popcorn Containers Volume (K) Forecast, by Application 2020 & 2033
- Table 85: South Korea Popcorn Containers Revenue (million) Forecast, by Application 2020 & 2033
- Table 86: South Korea Popcorn Containers Volume (K) Forecast, by Application 2020 & 2033
- Table 87: ASEAN Popcorn Containers Revenue (million) Forecast, by Application 2020 & 2033
- Table 88: ASEAN Popcorn Containers Volume (K) Forecast, by Application 2020 & 2033
- Table 89: Oceania Popcorn Containers Revenue (million) Forecast, by Application 2020 & 2033
- Table 90: Oceania Popcorn Containers Volume (K) Forecast, by Application 2020 & 2033
- Table 91: Rest of Asia Pacific Popcorn Containers Revenue (million) Forecast, by Application 2020 & 2033
- Table 92: Rest of Asia Pacific Popcorn Containers Volume (K) Forecast, by Application 2020 & 2033
Frequently Asked Questions
1. What is the projected Compound Annual Growth Rate (CAGR) of the Popcorn Containers?
The projected CAGR is approximately 9.8%.
2. Which companies are prominent players in the Popcorn Containers?
Key companies in the market include Gold Medal Products, PLUS PAPER FOODPAC, Victor Products, Thunder Group, Popcorn Supply, WABASH VALLEY FARMS, Southern Champion Tray, DixiePopcorn Boxes, International Paper, My Popcorn Boxes, Shenzhen Zhongjie Gifts, Shanghai Pureco Packaging Products.
3. What are the main segments of the Popcorn Containers?
The market segments include Application, Types.
4. Can you provide details about the market size?
The market size is estimated to be USD 599.2 million as of 2022.
5. What are some drivers contributing to market growth?
N/A
6. What are the notable trends driving market growth?
N/A
7. Are there any restraints impacting market growth?
N/A
8. Can you provide examples of recent developments in the market?
N/A
9. What pricing options are available for accessing the report?
Pricing options include single-user, multi-user, and enterprise licenses priced at USD 4350.00, USD 6525.00, and USD 8700.00 respectively.
10. Is the market size provided in terms of value or volume?
The market size is provided in terms of value, measured in million and volume, measured in K.
11. Are there any specific market keywords associated with the report?
Yes, the market keyword associated with the report is "Popcorn Containers," which aids in identifying and referencing the specific market segment covered.
12. How do I determine which pricing option suits my needs best?
The pricing options vary based on user requirements and access needs. Individual users may opt for single-user licenses, while businesses requiring broader access may choose multi-user or enterprise licenses for cost-effective access to the report.
13. Are there any additional resources or data provided in the Popcorn Containers report?
While the report offers comprehensive insights, it's advisable to review the specific contents or supplementary materials provided to ascertain if additional resources or data are available.
14. How can I stay updated on further developments or reports in the Popcorn Containers?
To stay informed about further developments, trends, and reports in the Popcorn Containers, consider subscribing to industry newsletters, following relevant companies and organizations, or regularly checking reputable industry news sources and publications.
Methodology
Step 1 - Identification of Relevant Samples Size from Population Database


Step 2 - Approaches for Defining Global Market Size (Value, Volume* & Price*)

Note*: In applicable scenarios
Step 3 - Data Sources
Primary Research
- Web Analytics
- Survey Reports
- Research Institute
- Latest Research Reports
- Opinion Leaders
Secondary Research
- Annual Reports
- White Paper
- Latest Press Release
- Industry Association
- Paid Database
- Investor Presentations

Step 4 - Data Triangulation
Involves using different sources of information in order to increase the validity of a study
These sources are likely to be stakeholders in a program - participants, other researchers, program staff, other community members, and so on.
Then we put all data in single framework & apply various statistical tools to find out the dynamic on the market.
During the analysis stage, feedback from the stakeholder groups would be compared to determine areas of agreement as well as areas of divergence