

Key Insights
The global Pompe Disease Treatment market is poised for significant expansion, projected to reach an estimated $9.5 billion in 2025, and is expected to experience a robust Compound Annual Growth Rate (CAGR) of 7.66% during the forecast period of 2025-2033. This substantial growth is fueled by a confluence of critical drivers, including increasing awareness of rare genetic disorders, advancements in diagnostic technologies enabling earlier detection, and the development of novel therapeutic approaches. The introduction of enzyme replacement therapies (ERTs) and emerging substrate reduction therapies (SRTs) are revolutionizing patient care and expanding treatment options. Furthermore, a growing emphasis on personalized medicine and the increasing prevalence of genetic screening programs are contributing to a broader patient identification base, thereby propelling market demand. The integration of innovative treatment modalities and a heightened focus on improving patient outcomes are key to this upward trajectory.
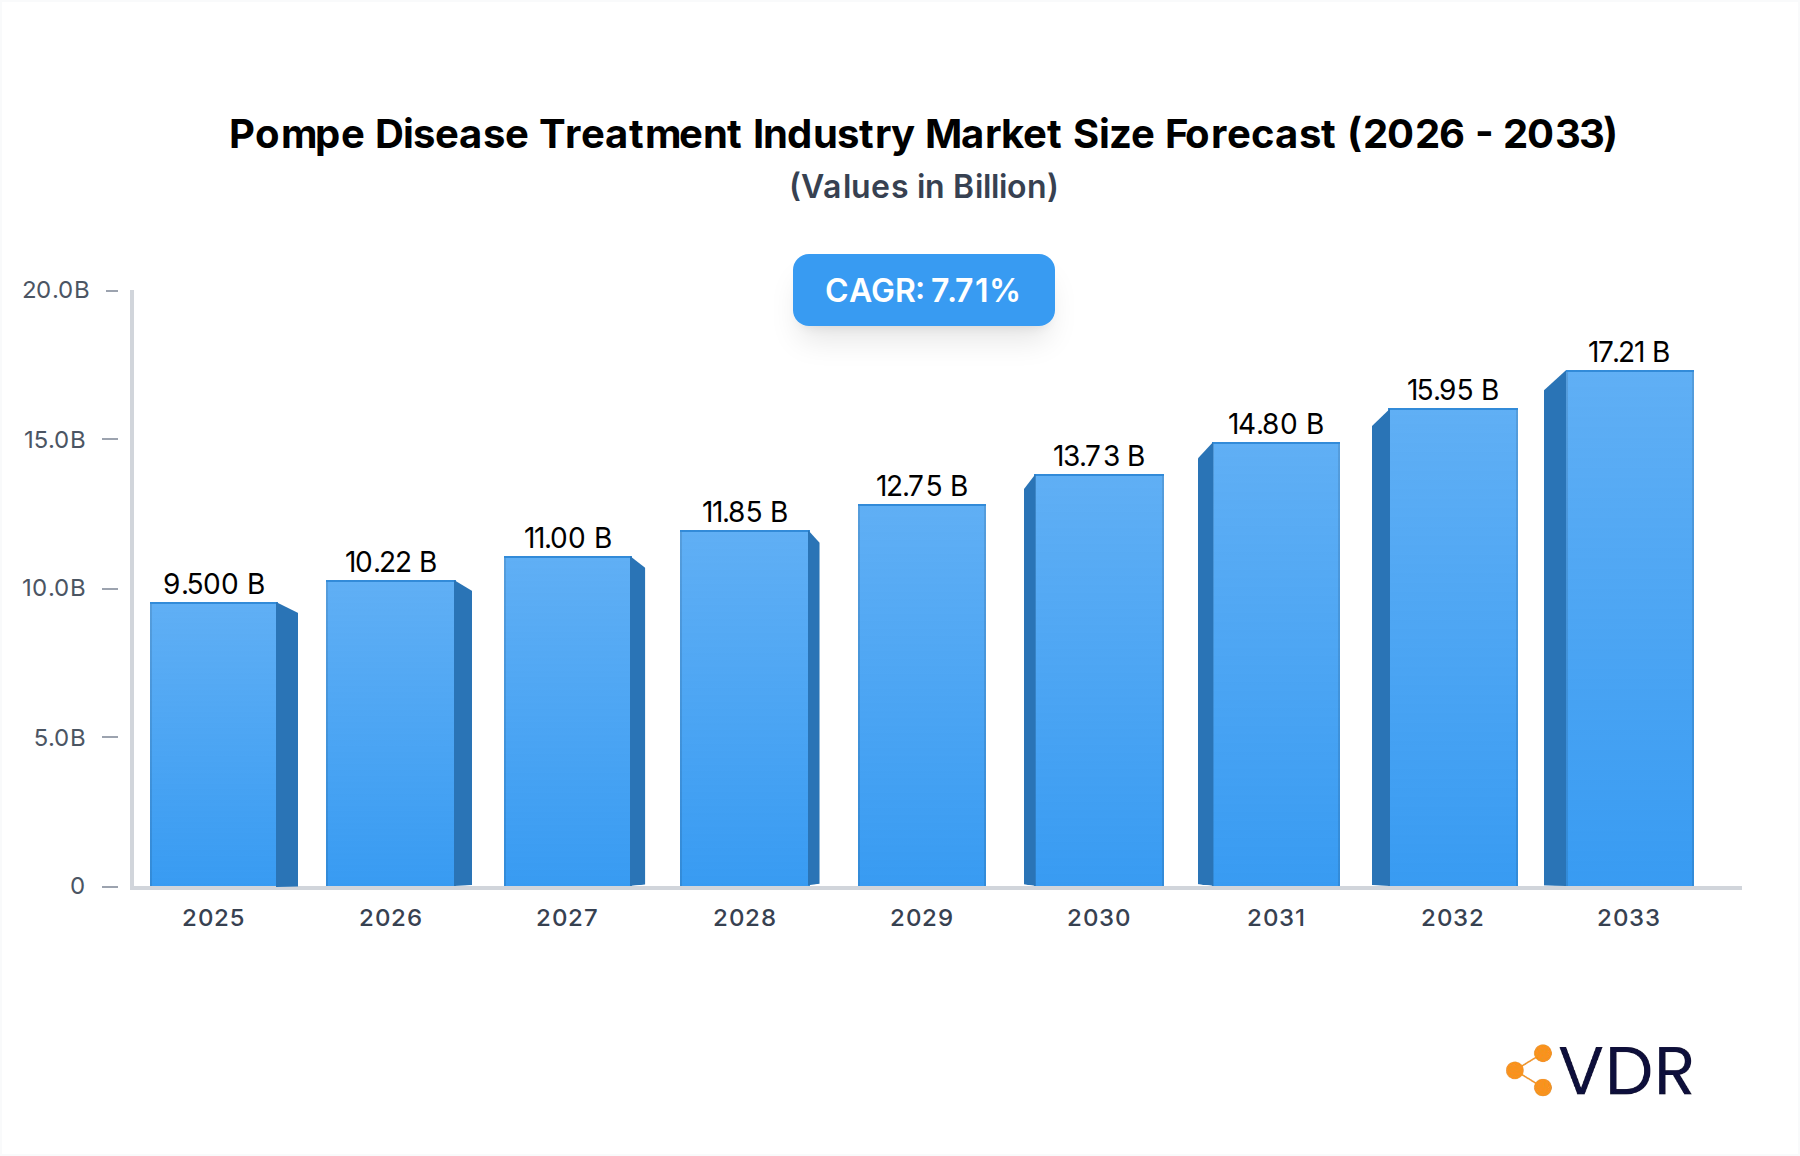
Pompe Disease Treatment Industry Market Size (In Billion)
The market's growth is further supported by significant investments in research and development by leading pharmaceutical and biotechnology companies such as Sanofi, Astellas Pharma, and Amicus Therapeutics. These efforts are focused on developing more effective and accessible treatments, including gene therapies and improved ERTs, which are expected to address unmet medical needs and broaden the patient population accessible to treatment. The market is segmented across various routes of administration, primarily oral and parenteral, with a strong focus on SRT and ERT as primary treatment types. Hospitals and ambulatory surgical centers represent the dominant end-user segments, reflecting the need for specialized medical infrastructure for Pompe disease management. Geographically, North America and Europe are expected to lead the market due to advanced healthcare systems and high R&D spending, with the Asia Pacific region showing promising growth potential driven by increasing healthcare investments and a rising incidence of rare diseases.

Pompe Disease Treatment Industry Company Market Share
This comprehensive report provides an in-depth analysis of the Pompe Disease Treatment Industry, meticulously examining market dynamics, growth trajectories, regional dominance, product landscape, key players, and emerging opportunities. With a study period spanning from 2019 to 2033, including a base year of 2025 and a forecast period of 2025-2033, this report offers critical insights for stakeholders seeking to navigate this evolving rare disease treatment market. The report integrates high-traffic keywords such as "Pompe disease treatment," "enzyme replacement therapy," "substrate reduction therapy," "gene therapy Pompe disease," "rare disease market," and "neuromuscular disorder treatment" to maximize SEO visibility and attract industry professionals. It also analyzes the parent and child market segments, providing a holistic view of the industry's structure and potential.
Pompe Disease Treatment Industry Market Dynamics & Structure
The Pompe Disease Treatment Industry is characterized by a moderate market concentration, driven by a few key players dominating the Enzyme Replacement Therapy (ERT) segment, while the emerging Substrate Reduction Therapy (SRT) and gene therapy sectors offer significant growth potential. Technological innovation is a primary driver, with ongoing research into novel therapeutic approaches and improved drug delivery methods. Regulatory frameworks, particularly those from the FDA and EMA, play a crucial role in market access and product approval. Competitive product substitutes are limited due to the rare nature of Pompe disease, but advancements in supportive care and alternative treatment modalities present indirect competition. End-user demographics are primarily comprised of hospitals and specialized treatment centers, with a growing interest in home-based infusion services for ERT. Mergers and acquisitions (M&A) are infrequent but significant, often aimed at consolidating market share or acquiring innovative technologies.
- Market Concentration: Dominated by established ERT providers, with a growing number of biotech companies entering the SRT and gene therapy spaces.
- Technological Innovation: Focus on developing more effective ERT, novel SRT pathways, and potentially curative gene therapies.
- Regulatory Landscape: Stringent approval processes for rare disease treatments, with orphan drug designations providing incentives.
- Competitive Substitutes: Limited direct substitutes, but advancements in supportive care and potential for disease modification through gene therapy.
- End-User Demographics: Hospitals and specialized clinics are primary treatment centers; increasing demand for homecare services.
- M&A Trends: Sporadic but impactful, driven by the acquisition of promising pipelines and market consolidation.
Pompe Disease Treatment Industry Growth Trends & Insights
The global Pompe disease treatment market is poised for significant expansion, driven by increasing disease awareness, improved diagnostic capabilities, and the continuous development of novel therapies. The market size, estimated to reach $5.8 billion in 2025, is projected to grow at a Compound Annual Growth Rate (CAGR) of approximately 12.5% from 2025 to 2033, reaching an estimated $14.3 billion by the end of the forecast period. This robust growth is fueled by a higher adoption rate of existing ERT treatments, particularly in developed regions, and the anticipated market entry of innovative SRT and gene therapies that promise enhanced efficacy and patient convenience. Technological disruptions, such as advancements in gene editing technologies and more targeted drug delivery systems, are expected to revolutionize treatment paradigms, shifting the focus towards potentially curative options. Consumer behavior shifts are also influencing the market, with patients and caregivers seeking more personalized treatment plans and greater involvement in therapeutic decision-making. The pediatric segment, while smaller, exhibits a higher growth rate due to the early onset of the disease in many cases and the potential for lifelong treatment. The increasing prevalence of late-onset Pompe disease, often diagnosed in adulthood, contributes significantly to the overall market volume.
Dominant Regions, Countries, or Segments in Pompe Disease Treatment Industry
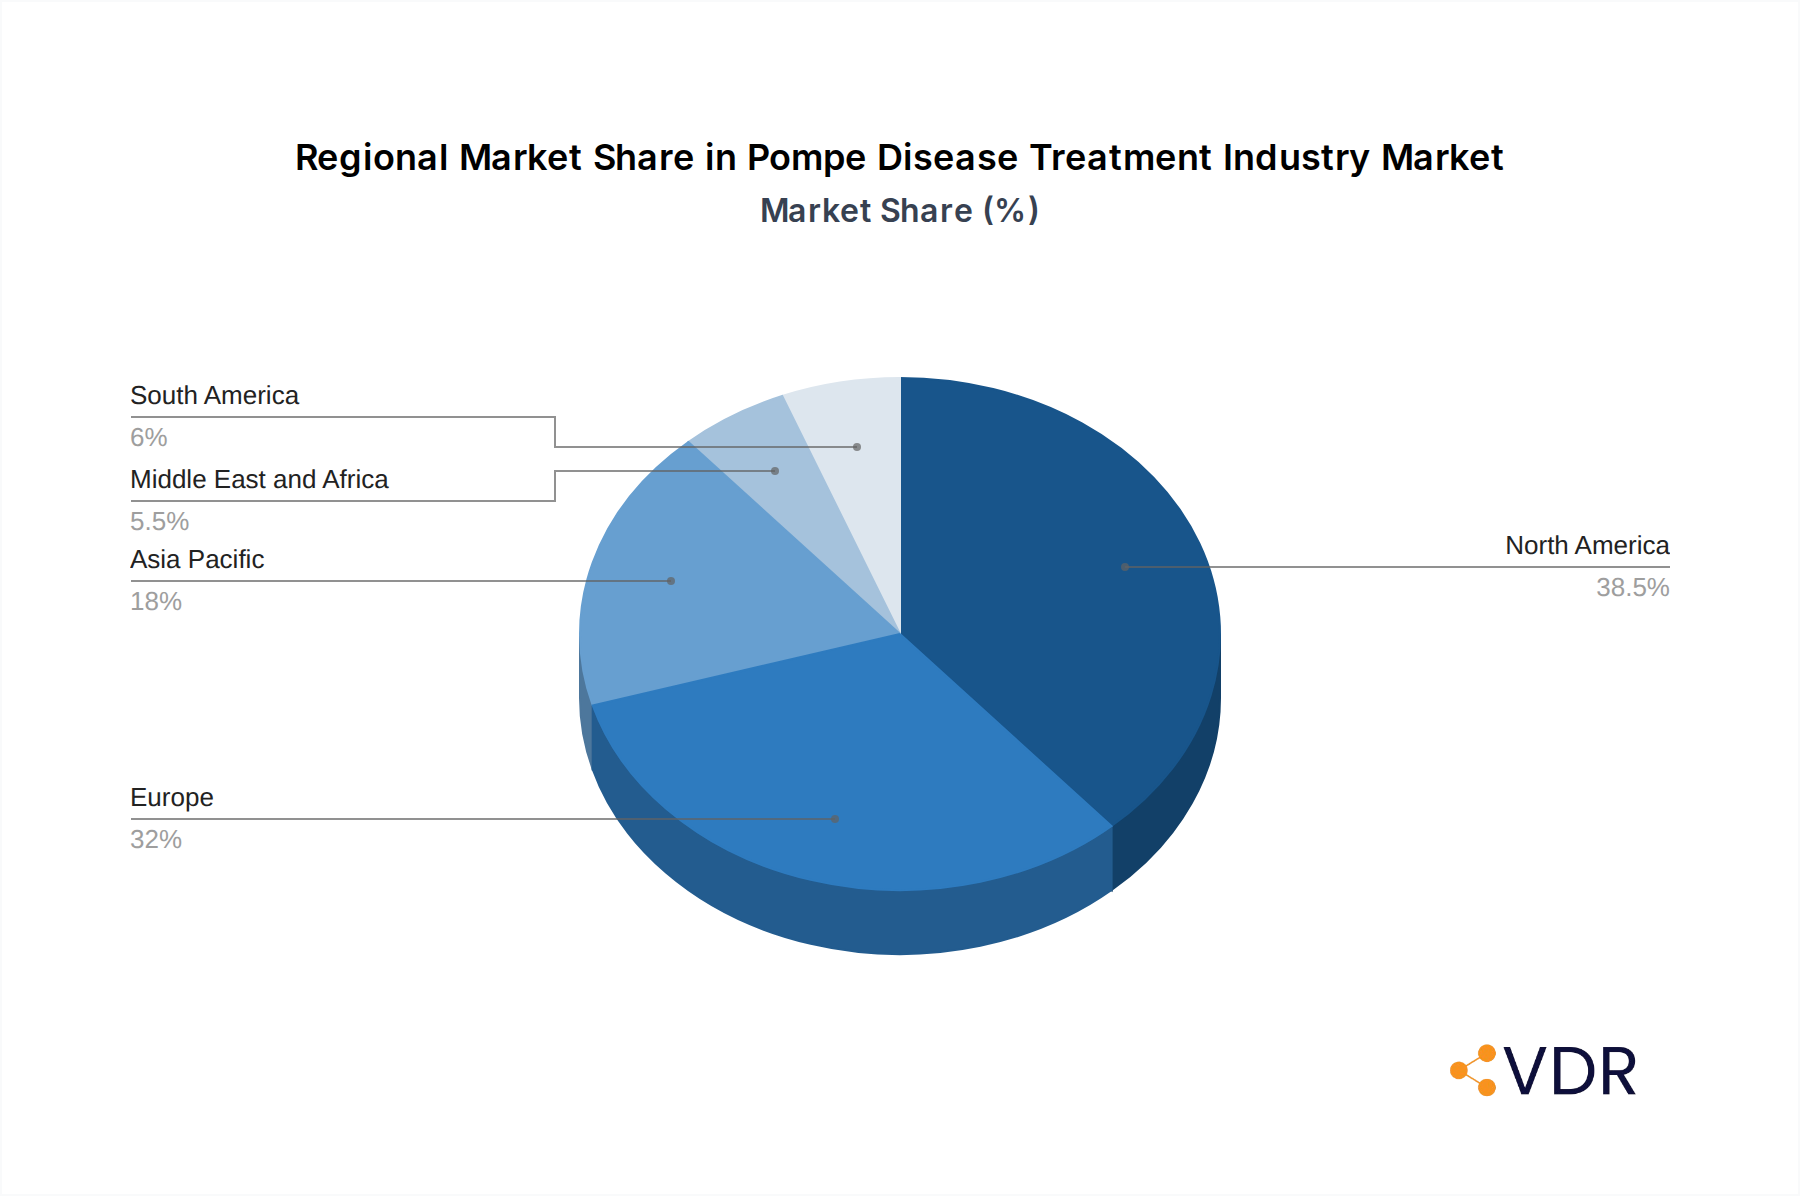
North America, particularly the United States, is currently the dominant region in the Pompe Disease Treatment Industry, accounting for an estimated 45% of the global market share in 2025. This dominance is attributed to several factors, including a well-established healthcare infrastructure, high per capita healthcare spending, robust reimbursement policies for rare diseases, and a significant patient population with access to advanced medical facilities. The presence of leading pharmaceutical companies and a strong focus on research and development further solidify North America's leading position.
- Route of Administration: Parenteral administration remains the dominant route for existing ERT, representing an estimated 85% market share in 2025 due to the nature of enzyme replacement. However, there is a growing interest and development in oral formulations for SRT, which is expected to gain traction.
- Treatment Type: Enzyme Replacement Therapy (ERT) currently holds the largest market share, estimated at 70% in 2025, owing to its established efficacy and availability. Substrate Reduction Therapy (SRT) is a rapidly growing segment, projected to capture 25% of the market share by 2033. Other treatment types, including gene therapy, are in their nascent stages but hold immense future potential.
- End-User: Hospitals are the primary end-users, accounting for approximately 60% of the market share in 2025, due to the need for specialized infusion centers and expert medical supervision. Ambulatory Surgical Centers and home healthcare providers are expected to see increased utilization as treatment protocols evolve and patient convenience becomes a greater focus.
Europe follows North America as the second-largest market, driven by a similar emphasis on rare disease treatment and supported by national health systems that often provide comprehensive coverage for chronic conditions. However, market access can vary across European countries, influencing overall growth. Asia Pacific is emerging as a significant growth region, propelled by increasing healthcare expenditure, a rising number of diagnosed cases, and government initiatives to improve access to advanced treatments for rare diseases.
Pompe Disease Treatment Industry Product Landscape
The product landscape of the Pompe Disease Treatment Industry is marked by significant therapeutic advancements. Enzyme Replacement Therapy (ERT) products, such as alglucosidase alfa, continue to be a cornerstone of treatment, delivering functional GAA enzyme to patients deficient in it. Innovations in this area focus on improving half-life and reducing infusion-related reactions. The development of Substrate Reduction Therapy (SRT) presents a new paradigm, aiming to reduce the accumulation of toxic glycogen by inhibiting its synthesis. Products in this category are designed for oral administration, offering a more convenient patient experience. Emerging gene therapies hold the promise of a potentially curative one-time treatment by delivering the functional GAA gene to cells, addressing the root cause of the disease. These therapies represent a significant technological leap with the potential to redefine Pompe disease management.
Key Drivers, Barriers & Challenges in Pompe Disease Treatment Industry
Key Drivers:
- Increasing Disease Awareness and Diagnosis: Improved diagnostic tools and heightened awareness among healthcare professionals and the public are leading to earlier and more accurate diagnoses.
- Advancements in Therapeutic Technologies: The development of novel ERTs with improved efficacy, oral SRTs, and promising gene therapies are major growth catalysts.
- Favorable Regulatory Environment for Rare Diseases: Orphan drug designations and expedited review pathways incentivize research and development.
- Growing Patient Advocacy Groups: Strong patient advocacy plays a crucial role in driving research funding, raising awareness, and influencing policy.
Barriers & Challenges:
- High Cost of Treatment: Orphan drugs and novel therapies are exceptionally expensive, posing significant financial burdens on healthcare systems and patients.
- Limited Patient Pool: The rarity of Pompe disease restricts the market size and can impact the economic viability of some treatments.
- Complex Manufacturing and Supply Chain: Specialized manufacturing processes for biologics and gene therapies can lead to supply chain vulnerabilities.
- Need for Long-Term Efficacy Data: Demonstrating long-term safety and efficacy, especially for newer modalities like gene therapy, is an ongoing challenge.
- Global Reimbursement Disparities: Access to advanced treatments varies significantly across different countries, creating treatment inequities.
Emerging Opportunities in Pompe Disease Treatment Industry
Emerging opportunities in the Pompe Disease Treatment Industry are abundant, driven by the unmet medical needs and the rapid pace of scientific innovation. The development of gene therapy offers a significant opportunity for a potentially curative treatment, attracting substantial investment. Furthermore, the exploration of novel oral small molecule therapies for substrate reduction is gaining momentum, promising improved patient adherence and quality of life. The expansion of diagnostic capabilities, particularly for infantile-onset Pompe disease, and the development of biomarkers for disease progression monitoring will create opportunities for more precise and personalized treatment approaches. Untapped markets in emerging economies, where awareness and access to rare disease treatments are growing, also present considerable potential for future growth.
Growth Accelerators in the Pompe Disease Treatment Industry Industry
Growth accelerators in the Pompe Disease Treatment Industry are multi-faceted, driven by ongoing technological breakthroughs and strategic market expansions. The relentless pursuit of gene therapy solutions, aiming for a one-time curative intervention, is a primary catalyst. Strategic partnerships between established pharmaceutical giants and agile biotech firms are accelerating the development and commercialization of novel therapies, leveraging combined expertise and resources. Market expansion strategies, focusing on increasing diagnosis rates in under-diagnosed populations and improving access to treatment in developing regions, will significantly contribute to long-term growth. The ongoing refinement of Enzyme Replacement Therapies (ERTs) with enhanced pharmacokinetic profiles and reduced immunogenicity further solidifies their role and drives sustained market demand.
Key Players Shaping the Pompe Disease Treatment Industry Market
- Astellas Pharma
- Amicus Therapeutics
- Sanofi
- EpiVax Inc
- AVROBIO Inc
- Genethon
- Oxyrane
Notable Milestones in Pompe Disease Treatment Industry Sector
- June 2022: The European Commission granted marketing authorization for Nexvia Dyme (alglucosidase alfa), an enzyme replacement therapy (ERT) for the long-term treatment of both late-onset and infantile-onset Pompe disease, a rare, progressive, and debilitating muscle disorder.
- February 2022: Maze Therapeutics, a company translating genetic insights into new precision medicines, reported new preclinical data supporting the advancement of MZE001, which aims to address Pompe disease by reducing pathologic glycogen accumulation through the inhibition of muscle glycogen synthase (GYS1).
In-Depth Pompe Disease Treatment Industry Market Outlook
The future outlook for the Pompe Disease Treatment Industry is exceptionally promising, characterized by sustained growth and transformative therapeutic advancements. The ongoing evolution of gene therapy technologies represents a significant growth frontier, with the potential to shift treatment paradigms towards curative solutions. Concurrently, the refinement and wider adoption of oral substrate reduction therapies will enhance patient convenience and adherence, contributing to market expansion. Strategic collaborations and increased investment in research and development are expected to accelerate the pipeline of innovative treatments. Furthermore, a concerted effort to improve diagnostic rates globally and expand access to therapy in underserved regions will unlock substantial market potential, ensuring that more patients benefit from the cutting-edge treatments available. The industry is poised to witness remarkable progress in improving the lives of individuals affected by Pompe disease.
Pompe Disease Treatment Industry Segmentation
-
1. Route of Administration
- 1.1. Oral
- 1.2. Parenteral
-
2. Treatment Type
- 2.1. Substrate Reduction Therapy (SRT)
- 2.2. Enzyme Replacement Therapy (ERT)
- 2.3. Other Treatment Types
-
3. End-User
- 3.1. Hospitals
- 3.2. Ambulatory Surgical Centers
- 3.3. Other End-Users
Pompe Disease Treatment Industry Segmentation By Geography
-
1. North America
- 1.1. United States
- 1.2. Canada
- 1.3. Mexico
-
2. Europe
- 2.1. Germany
- 2.2. United Kingdom
- 2.3. France
- 2.4. Italy
- 2.5. Spain
- 2.6. Rest of Europe
-
3. Asia Pacific
- 3.1. China
- 3.2. Japan
- 3.3. India
- 3.4. Australia
- 3.5. South Korea
- 3.6. Rest of Asia Pacific
-
4. Middle East and Africa
- 4.1. GCC
- 4.2. South Africa
- 4.3. Rest of Middle East and Africa
-
5. South America
- 5.1. Brazil
- 5.2. Argentina
- 5.3. Rest of South America
Pompe Disease Treatment Industry Regional Market Share
Geographic Coverage of Pompe Disease Treatment Industry
Pompe Disease Treatment Industry REPORT HIGHLIGHTS
| Aspects | Details |
|---|---|
| Study Period | 2020-2034 |
| Base Year | 2025 |
| Estimated Year | 2026 |
| Forecast Period | 2026-2034 |
| Historical Period | 2020-2025 |
| Growth Rate | CAGR of 4.4% from 2020-2034 |
| Segmentation |
|
Table of Contents
- 1. Introduction
- 1.1. Research Scope
- 1.2. Market Segmentation
- 1.3. Research Objective
- 1.4. Definitions and Assumptions
- 2. Executive Summary
- 2.1. Market Snapshot
- 3. Market Dynamics
- 3.1. Market Drivers
- 3.2. Market Restrains
- 3.3. Market Trends
- 3.4. Market Opportunities
- 4. Market Factor Analysis
- 4.1. Porters Five Forces
- 4.1.1. Bargaining Power of Suppliers
- 4.1.2. Bargaining Power of Buyers
- 4.1.3. Threat of New Entrants
- 4.1.4. Threat of Substitutes
- 4.1.5. Competitive Rivalry
- 4.2. PESTEL analysis
- 4.3. BCG Analysis
- 4.3.1. Stars (High Growth, High Market Share)
- 4.3.2. Cash Cows (Low Growth, High Market Share)
- 4.3.3. Question Mark (High Growth, Low Market Share)
- 4.3.4. Dogs (Low Growth, Low Market Share)
- 4.4. Ansoff Matrix Analysis
- 4.5. Supply Chain Analysis
- 4.6. Regulatory Landscape
- 4.7. Current Market Potential and Opportunity Assessment (TAM–SAM–SOM Framework)
- 4.8. VDR Analyst Note
- 4.1. Porters Five Forces
- 5. Market Analysis, Insights and Forecast 2021-2033
- 5.1. Market Analysis, Insights and Forecast - by Route of Administration
- 5.1.1. Oral
- 5.1.2. Parenteral
- 5.2. Market Analysis, Insights and Forecast - by Treatment Type
- 5.2.1. Substrate Reduction Therapy (SRT)
- 5.2.2. Enzyme Replacement Therapy (ERT)
- 5.2.3. Other Treatment Types
- 5.3. Market Analysis, Insights and Forecast - by End-User
- 5.3.1. Hospitals
- 5.3.2. Ambulatory Surgical Centers
- 5.3.3. Other End-Users
- 5.4. Market Analysis, Insights and Forecast - by Region
- 5.4.1. North America
- 5.4.2. Europe
- 5.4.3. Asia Pacific
- 5.4.4. Middle East and Africa
- 5.4.5. South America
- 5.1. Market Analysis, Insights and Forecast - by Route of Administration
- 6. Global Pompe Disease Treatment Industry Analysis, Insights and Forecast, 2021-2033
- 6.1. Market Analysis, Insights and Forecast - by Route of Administration
- 6.1.1. Oral
- 6.1.2. Parenteral
- 6.2. Market Analysis, Insights and Forecast - by Treatment Type
- 6.2.1. Substrate Reduction Therapy (SRT)
- 6.2.2. Enzyme Replacement Therapy (ERT)
- 6.2.3. Other Treatment Types
- 6.3. Market Analysis, Insights and Forecast - by End-User
- 6.3.1. Hospitals
- 6.3.2. Ambulatory Surgical Centers
- 6.3.3. Other End-Users
- 6.1. Market Analysis, Insights and Forecast - by Route of Administration
- 7. North America Pompe Disease Treatment Industry Analysis, Insights and Forecast, 2021-2033
- 7.1. Market Analysis, Insights and Forecast - by Route of Administration
- 7.1.1. Oral
- 7.1.2. Parenteral
- 7.2. Market Analysis, Insights and Forecast - by Treatment Type
- 7.2.1. Substrate Reduction Therapy (SRT)
- 7.2.2. Enzyme Replacement Therapy (ERT)
- 7.2.3. Other Treatment Types
- 7.3. Market Analysis, Insights and Forecast - by End-User
- 7.3.1. Hospitals
- 7.3.2. Ambulatory Surgical Centers
- 7.3.3. Other End-Users
- 7.1. Market Analysis, Insights and Forecast - by Route of Administration
- 8. Europe Pompe Disease Treatment Industry Analysis, Insights and Forecast, 2021-2033
- 8.1. Market Analysis, Insights and Forecast - by Route of Administration
- 8.1.1. Oral
- 8.1.2. Parenteral
- 8.2. Market Analysis, Insights and Forecast - by Treatment Type
- 8.2.1. Substrate Reduction Therapy (SRT)
- 8.2.2. Enzyme Replacement Therapy (ERT)
- 8.2.3. Other Treatment Types
- 8.3. Market Analysis, Insights and Forecast - by End-User
- 8.3.1. Hospitals
- 8.3.2. Ambulatory Surgical Centers
- 8.3.3. Other End-Users
- 8.1. Market Analysis, Insights and Forecast - by Route of Administration
- 9. Asia Pacific Pompe Disease Treatment Industry Analysis, Insights and Forecast, 2021-2033
- 9.1. Market Analysis, Insights and Forecast - by Route of Administration
- 9.1.1. Oral
- 9.1.2. Parenteral
- 9.2. Market Analysis, Insights and Forecast - by Treatment Type
- 9.2.1. Substrate Reduction Therapy (SRT)
- 9.2.2. Enzyme Replacement Therapy (ERT)
- 9.2.3. Other Treatment Types
- 9.3. Market Analysis, Insights and Forecast - by End-User
- 9.3.1. Hospitals
- 9.3.2. Ambulatory Surgical Centers
- 9.3.3. Other End-Users
- 9.1. Market Analysis, Insights and Forecast - by Route of Administration
- 10. Middle East and Africa Pompe Disease Treatment Industry Analysis, Insights and Forecast, 2021-2033
- 10.1. Market Analysis, Insights and Forecast - by Route of Administration
- 10.1.1. Oral
- 10.1.2. Parenteral
- 10.2. Market Analysis, Insights and Forecast - by Treatment Type
- 10.2.1. Substrate Reduction Therapy (SRT)
- 10.2.2. Enzyme Replacement Therapy (ERT)
- 10.2.3. Other Treatment Types
- 10.3. Market Analysis, Insights and Forecast - by End-User
- 10.3.1. Hospitals
- 10.3.2. Ambulatory Surgical Centers
- 10.3.3. Other End-Users
- 10.1. Market Analysis, Insights and Forecast - by Route of Administration
- 11. South America Pompe Disease Treatment Industry Analysis, Insights and Forecast, 2021-2033
- 11.1. Market Analysis, Insights and Forecast - by Route of Administration
- 11.1.1. Oral
- 11.1.2. Parenteral
- 11.2. Market Analysis, Insights and Forecast - by Treatment Type
- 11.2.1. Substrate Reduction Therapy (SRT)
- 11.2.2. Enzyme Replacement Therapy (ERT)
- 11.2.3. Other Treatment Types
- 11.3. Market Analysis, Insights and Forecast - by End-User
- 11.3.1. Hospitals
- 11.3.2. Ambulatory Surgical Centers
- 11.3.3. Other End-Users
- 11.1. Market Analysis, Insights and Forecast - by Route of Administration
- 12. Competitive Analysis
- 12.1. Company Profiles
- 12.1.1 Astellas Pharma
- 12.1.1.1. Company Overview
- 12.1.1.2. Products
- 12.1.1.3. Company Financials
- 12.1.1.4. SWOT Analysis
- 12.1.2 Amicus Therapeutics
- 12.1.2.1. Company Overview
- 12.1.2.2. Products
- 12.1.2.3. Company Financials
- 12.1.2.4. SWOT Analysis
- 12.1.3 Sanofi
- 12.1.3.1. Company Overview
- 12.1.3.2. Products
- 12.1.3.3. Company Financials
- 12.1.3.4. SWOT Analysis
- 12.1.4 EpiVax Inc
- 12.1.4.1. Company Overview
- 12.1.4.2. Products
- 12.1.4.3. Company Financials
- 12.1.4.4. SWOT Analysis
- 12.1.5 AVROBIO Inc
- 12.1.5.1. Company Overview
- 12.1.5.2. Products
- 12.1.5.3. Company Financials
- 12.1.5.4. SWOT Analysis
- 12.1.6 Genethon
- 12.1.6.1. Company Overview
- 12.1.6.2. Products
- 12.1.6.3. Company Financials
- 12.1.6.4. SWOT Analysis
- 12.1.7 Oxyrane
- 12.1.7.1. Company Overview
- 12.1.7.2. Products
- 12.1.7.3. Company Financials
- 12.1.7.4. SWOT Analysis
- 12.1.1 Astellas Pharma
- 12.2. Market Entropy
- 12.2.1 Company's Key Areas Served
- 12.2.2 Recent Developments
- 12.3. Company Market Share Analysis 2025
- 12.3.1 Top 5 Companies Market Share Analysis
- 12.3.2 Top 3 Companies Market Share Analysis
- 12.4. List of Potential Customers
- 13. Research Methodology
List of Figures
- Figure 1: Global Pompe Disease Treatment Industry Revenue Breakdown (billion, %) by Region 2025 & 2033
- Figure 2: Global Pompe Disease Treatment Industry Volume Breakdown (K Unit, %) by Region 2025 & 2033
- Figure 3: North America Pompe Disease Treatment Industry Revenue (billion), by Route of Administration 2025 & 2033
- Figure 4: North America Pompe Disease Treatment Industry Volume (K Unit), by Route of Administration 2025 & 2033
- Figure 5: North America Pompe Disease Treatment Industry Revenue Share (%), by Route of Administration 2025 & 2033
- Figure 6: North America Pompe Disease Treatment Industry Volume Share (%), by Route of Administration 2025 & 2033
- Figure 7: North America Pompe Disease Treatment Industry Revenue (billion), by Treatment Type 2025 & 2033
- Figure 8: North America Pompe Disease Treatment Industry Volume (K Unit), by Treatment Type 2025 & 2033
- Figure 9: North America Pompe Disease Treatment Industry Revenue Share (%), by Treatment Type 2025 & 2033
- Figure 10: North America Pompe Disease Treatment Industry Volume Share (%), by Treatment Type 2025 & 2033
- Figure 11: North America Pompe Disease Treatment Industry Revenue (billion), by End-User 2025 & 2033
- Figure 12: North America Pompe Disease Treatment Industry Volume (K Unit), by End-User 2025 & 2033
- Figure 13: North America Pompe Disease Treatment Industry Revenue Share (%), by End-User 2025 & 2033
- Figure 14: North America Pompe Disease Treatment Industry Volume Share (%), by End-User 2025 & 2033
- Figure 15: North America Pompe Disease Treatment Industry Revenue (billion), by Country 2025 & 2033
- Figure 16: North America Pompe Disease Treatment Industry Volume (K Unit), by Country 2025 & 2033
- Figure 17: North America Pompe Disease Treatment Industry Revenue Share (%), by Country 2025 & 2033
- Figure 18: North America Pompe Disease Treatment Industry Volume Share (%), by Country 2025 & 2033
- Figure 19: Europe Pompe Disease Treatment Industry Revenue (billion), by Route of Administration 2025 & 2033
- Figure 20: Europe Pompe Disease Treatment Industry Volume (K Unit), by Route of Administration 2025 & 2033
- Figure 21: Europe Pompe Disease Treatment Industry Revenue Share (%), by Route of Administration 2025 & 2033
- Figure 22: Europe Pompe Disease Treatment Industry Volume Share (%), by Route of Administration 2025 & 2033
- Figure 23: Europe Pompe Disease Treatment Industry Revenue (billion), by Treatment Type 2025 & 2033
- Figure 24: Europe Pompe Disease Treatment Industry Volume (K Unit), by Treatment Type 2025 & 2033
- Figure 25: Europe Pompe Disease Treatment Industry Revenue Share (%), by Treatment Type 2025 & 2033
- Figure 26: Europe Pompe Disease Treatment Industry Volume Share (%), by Treatment Type 2025 & 2033
- Figure 27: Europe Pompe Disease Treatment Industry Revenue (billion), by End-User 2025 & 2033
- Figure 28: Europe Pompe Disease Treatment Industry Volume (K Unit), by End-User 2025 & 2033
- Figure 29: Europe Pompe Disease Treatment Industry Revenue Share (%), by End-User 2025 & 2033
- Figure 30: Europe Pompe Disease Treatment Industry Volume Share (%), by End-User 2025 & 2033
- Figure 31: Europe Pompe Disease Treatment Industry Revenue (billion), by Country 2025 & 2033
- Figure 32: Europe Pompe Disease Treatment Industry Volume (K Unit), by Country 2025 & 2033
- Figure 33: Europe Pompe Disease Treatment Industry Revenue Share (%), by Country 2025 & 2033
- Figure 34: Europe Pompe Disease Treatment Industry Volume Share (%), by Country 2025 & 2033
- Figure 35: Asia Pacific Pompe Disease Treatment Industry Revenue (billion), by Route of Administration 2025 & 2033
- Figure 36: Asia Pacific Pompe Disease Treatment Industry Volume (K Unit), by Route of Administration 2025 & 2033
- Figure 37: Asia Pacific Pompe Disease Treatment Industry Revenue Share (%), by Route of Administration 2025 & 2033
- Figure 38: Asia Pacific Pompe Disease Treatment Industry Volume Share (%), by Route of Administration 2025 & 2033
- Figure 39: Asia Pacific Pompe Disease Treatment Industry Revenue (billion), by Treatment Type 2025 & 2033
- Figure 40: Asia Pacific Pompe Disease Treatment Industry Volume (K Unit), by Treatment Type 2025 & 2033
- Figure 41: Asia Pacific Pompe Disease Treatment Industry Revenue Share (%), by Treatment Type 2025 & 2033
- Figure 42: Asia Pacific Pompe Disease Treatment Industry Volume Share (%), by Treatment Type 2025 & 2033
- Figure 43: Asia Pacific Pompe Disease Treatment Industry Revenue (billion), by End-User 2025 & 2033
- Figure 44: Asia Pacific Pompe Disease Treatment Industry Volume (K Unit), by End-User 2025 & 2033
- Figure 45: Asia Pacific Pompe Disease Treatment Industry Revenue Share (%), by End-User 2025 & 2033
- Figure 46: Asia Pacific Pompe Disease Treatment Industry Volume Share (%), by End-User 2025 & 2033
- Figure 47: Asia Pacific Pompe Disease Treatment Industry Revenue (billion), by Country 2025 & 2033
- Figure 48: Asia Pacific Pompe Disease Treatment Industry Volume (K Unit), by Country 2025 & 2033
- Figure 49: Asia Pacific Pompe Disease Treatment Industry Revenue Share (%), by Country 2025 & 2033
- Figure 50: Asia Pacific Pompe Disease Treatment Industry Volume Share (%), by Country 2025 & 2033
- Figure 51: Middle East and Africa Pompe Disease Treatment Industry Revenue (billion), by Route of Administration 2025 & 2033
- Figure 52: Middle East and Africa Pompe Disease Treatment Industry Volume (K Unit), by Route of Administration 2025 & 2033
- Figure 53: Middle East and Africa Pompe Disease Treatment Industry Revenue Share (%), by Route of Administration 2025 & 2033
- Figure 54: Middle East and Africa Pompe Disease Treatment Industry Volume Share (%), by Route of Administration 2025 & 2033
- Figure 55: Middle East and Africa Pompe Disease Treatment Industry Revenue (billion), by Treatment Type 2025 & 2033
- Figure 56: Middle East and Africa Pompe Disease Treatment Industry Volume (K Unit), by Treatment Type 2025 & 2033
- Figure 57: Middle East and Africa Pompe Disease Treatment Industry Revenue Share (%), by Treatment Type 2025 & 2033
- Figure 58: Middle East and Africa Pompe Disease Treatment Industry Volume Share (%), by Treatment Type 2025 & 2033
- Figure 59: Middle East and Africa Pompe Disease Treatment Industry Revenue (billion), by End-User 2025 & 2033
- Figure 60: Middle East and Africa Pompe Disease Treatment Industry Volume (K Unit), by End-User 2025 & 2033
- Figure 61: Middle East and Africa Pompe Disease Treatment Industry Revenue Share (%), by End-User 2025 & 2033
- Figure 62: Middle East and Africa Pompe Disease Treatment Industry Volume Share (%), by End-User 2025 & 2033
- Figure 63: Middle East and Africa Pompe Disease Treatment Industry Revenue (billion), by Country 2025 & 2033
- Figure 64: Middle East and Africa Pompe Disease Treatment Industry Volume (K Unit), by Country 2025 & 2033
- Figure 65: Middle East and Africa Pompe Disease Treatment Industry Revenue Share (%), by Country 2025 & 2033
- Figure 66: Middle East and Africa Pompe Disease Treatment Industry Volume Share (%), by Country 2025 & 2033
- Figure 67: South America Pompe Disease Treatment Industry Revenue (billion), by Route of Administration 2025 & 2033
- Figure 68: South America Pompe Disease Treatment Industry Volume (K Unit), by Route of Administration 2025 & 2033
- Figure 69: South America Pompe Disease Treatment Industry Revenue Share (%), by Route of Administration 2025 & 2033
- Figure 70: South America Pompe Disease Treatment Industry Volume Share (%), by Route of Administration 2025 & 2033
- Figure 71: South America Pompe Disease Treatment Industry Revenue (billion), by Treatment Type 2025 & 2033
- Figure 72: South America Pompe Disease Treatment Industry Volume (K Unit), by Treatment Type 2025 & 2033
- Figure 73: South America Pompe Disease Treatment Industry Revenue Share (%), by Treatment Type 2025 & 2033
- Figure 74: South America Pompe Disease Treatment Industry Volume Share (%), by Treatment Type 2025 & 2033
- Figure 75: South America Pompe Disease Treatment Industry Revenue (billion), by End-User 2025 & 2033
- Figure 76: South America Pompe Disease Treatment Industry Volume (K Unit), by End-User 2025 & 2033
- Figure 77: South America Pompe Disease Treatment Industry Revenue Share (%), by End-User 2025 & 2033
- Figure 78: South America Pompe Disease Treatment Industry Volume Share (%), by End-User 2025 & 2033
- Figure 79: South America Pompe Disease Treatment Industry Revenue (billion), by Country 2025 & 2033
- Figure 80: South America Pompe Disease Treatment Industry Volume (K Unit), by Country 2025 & 2033
- Figure 81: South America Pompe Disease Treatment Industry Revenue Share (%), by Country 2025 & 2033
- Figure 82: South America Pompe Disease Treatment Industry Volume Share (%), by Country 2025 & 2033
List of Tables
- Table 1: Global Pompe Disease Treatment Industry Revenue billion Forecast, by Route of Administration 2020 & 2033
- Table 2: Global Pompe Disease Treatment Industry Volume K Unit Forecast, by Route of Administration 2020 & 2033
- Table 3: Global Pompe Disease Treatment Industry Revenue billion Forecast, by Treatment Type 2020 & 2033
- Table 4: Global Pompe Disease Treatment Industry Volume K Unit Forecast, by Treatment Type 2020 & 2033
- Table 5: Global Pompe Disease Treatment Industry Revenue billion Forecast, by End-User 2020 & 2033
- Table 6: Global Pompe Disease Treatment Industry Volume K Unit Forecast, by End-User 2020 & 2033
- Table 7: Global Pompe Disease Treatment Industry Revenue billion Forecast, by Region 2020 & 2033
- Table 8: Global Pompe Disease Treatment Industry Volume K Unit Forecast, by Region 2020 & 2033
- Table 9: Global Pompe Disease Treatment Industry Revenue billion Forecast, by Route of Administration 2020 & 2033
- Table 10: Global Pompe Disease Treatment Industry Volume K Unit Forecast, by Route of Administration 2020 & 2033
- Table 11: Global Pompe Disease Treatment Industry Revenue billion Forecast, by Treatment Type 2020 & 2033
- Table 12: Global Pompe Disease Treatment Industry Volume K Unit Forecast, by Treatment Type 2020 & 2033
- Table 13: Global Pompe Disease Treatment Industry Revenue billion Forecast, by End-User 2020 & 2033
- Table 14: Global Pompe Disease Treatment Industry Volume K Unit Forecast, by End-User 2020 & 2033
- Table 15: Global Pompe Disease Treatment Industry Revenue billion Forecast, by Country 2020 & 2033
- Table 16: Global Pompe Disease Treatment Industry Volume K Unit Forecast, by Country 2020 & 2033
- Table 17: United States Pompe Disease Treatment Industry Revenue (billion) Forecast, by Application 2020 & 2033
- Table 18: United States Pompe Disease Treatment Industry Volume (K Unit) Forecast, by Application 2020 & 2033
- Table 19: Canada Pompe Disease Treatment Industry Revenue (billion) Forecast, by Application 2020 & 2033
- Table 20: Canada Pompe Disease Treatment Industry Volume (K Unit) Forecast, by Application 2020 & 2033
- Table 21: Mexico Pompe Disease Treatment Industry Revenue (billion) Forecast, by Application 2020 & 2033
- Table 22: Mexico Pompe Disease Treatment Industry Volume (K Unit) Forecast, by Application 2020 & 2033
- Table 23: Global Pompe Disease Treatment Industry Revenue billion Forecast, by Route of Administration 2020 & 2033
- Table 24: Global Pompe Disease Treatment Industry Volume K Unit Forecast, by Route of Administration 2020 & 2033
- Table 25: Global Pompe Disease Treatment Industry Revenue billion Forecast, by Treatment Type 2020 & 2033
- Table 26: Global Pompe Disease Treatment Industry Volume K Unit Forecast, by Treatment Type 2020 & 2033
- Table 27: Global Pompe Disease Treatment Industry Revenue billion Forecast, by End-User 2020 & 2033
- Table 28: Global Pompe Disease Treatment Industry Volume K Unit Forecast, by End-User 2020 & 2033
- Table 29: Global Pompe Disease Treatment Industry Revenue billion Forecast, by Country 2020 & 2033
- Table 30: Global Pompe Disease Treatment Industry Volume K Unit Forecast, by Country 2020 & 2033
- Table 31: Germany Pompe Disease Treatment Industry Revenue (billion) Forecast, by Application 2020 & 2033
- Table 32: Germany Pompe Disease Treatment Industry Volume (K Unit) Forecast, by Application 2020 & 2033
- Table 33: United Kingdom Pompe Disease Treatment Industry Revenue (billion) Forecast, by Application 2020 & 2033
- Table 34: United Kingdom Pompe Disease Treatment Industry Volume (K Unit) Forecast, by Application 2020 & 2033
- Table 35: France Pompe Disease Treatment Industry Revenue (billion) Forecast, by Application 2020 & 2033
- Table 36: France Pompe Disease Treatment Industry Volume (K Unit) Forecast, by Application 2020 & 2033
- Table 37: Italy Pompe Disease Treatment Industry Revenue (billion) Forecast, by Application 2020 & 2033
- Table 38: Italy Pompe Disease Treatment Industry Volume (K Unit) Forecast, by Application 2020 & 2033
- Table 39: Spain Pompe Disease Treatment Industry Revenue (billion) Forecast, by Application 2020 & 2033
- Table 40: Spain Pompe Disease Treatment Industry Volume (K Unit) Forecast, by Application 2020 & 2033
- Table 41: Rest of Europe Pompe Disease Treatment Industry Revenue (billion) Forecast, by Application 2020 & 2033
- Table 42: Rest of Europe Pompe Disease Treatment Industry Volume (K Unit) Forecast, by Application 2020 & 2033
- Table 43: Global Pompe Disease Treatment Industry Revenue billion Forecast, by Route of Administration 2020 & 2033
- Table 44: Global Pompe Disease Treatment Industry Volume K Unit Forecast, by Route of Administration 2020 & 2033
- Table 45: Global Pompe Disease Treatment Industry Revenue billion Forecast, by Treatment Type 2020 & 2033
- Table 46: Global Pompe Disease Treatment Industry Volume K Unit Forecast, by Treatment Type 2020 & 2033
- Table 47: Global Pompe Disease Treatment Industry Revenue billion Forecast, by End-User 2020 & 2033
- Table 48: Global Pompe Disease Treatment Industry Volume K Unit Forecast, by End-User 2020 & 2033
- Table 49: Global Pompe Disease Treatment Industry Revenue billion Forecast, by Country 2020 & 2033
- Table 50: Global Pompe Disease Treatment Industry Volume K Unit Forecast, by Country 2020 & 2033
- Table 51: China Pompe Disease Treatment Industry Revenue (billion) Forecast, by Application 2020 & 2033
- Table 52: China Pompe Disease Treatment Industry Volume (K Unit) Forecast, by Application 2020 & 2033
- Table 53: Japan Pompe Disease Treatment Industry Revenue (billion) Forecast, by Application 2020 & 2033
- Table 54: Japan Pompe Disease Treatment Industry Volume (K Unit) Forecast, by Application 2020 & 2033
- Table 55: India Pompe Disease Treatment Industry Revenue (billion) Forecast, by Application 2020 & 2033
- Table 56: India Pompe Disease Treatment Industry Volume (K Unit) Forecast, by Application 2020 & 2033
- Table 57: Australia Pompe Disease Treatment Industry Revenue (billion) Forecast, by Application 2020 & 2033
- Table 58: Australia Pompe Disease Treatment Industry Volume (K Unit) Forecast, by Application 2020 & 2033
- Table 59: South Korea Pompe Disease Treatment Industry Revenue (billion) Forecast, by Application 2020 & 2033
- Table 60: South Korea Pompe Disease Treatment Industry Volume (K Unit) Forecast, by Application 2020 & 2033
- Table 61: Rest of Asia Pacific Pompe Disease Treatment Industry Revenue (billion) Forecast, by Application 2020 & 2033
- Table 62: Rest of Asia Pacific Pompe Disease Treatment Industry Volume (K Unit) Forecast, by Application 2020 & 2033
- Table 63: Global Pompe Disease Treatment Industry Revenue billion Forecast, by Route of Administration 2020 & 2033
- Table 64: Global Pompe Disease Treatment Industry Volume K Unit Forecast, by Route of Administration 2020 & 2033
- Table 65: Global Pompe Disease Treatment Industry Revenue billion Forecast, by Treatment Type 2020 & 2033
- Table 66: Global Pompe Disease Treatment Industry Volume K Unit Forecast, by Treatment Type 2020 & 2033
- Table 67: Global Pompe Disease Treatment Industry Revenue billion Forecast, by End-User 2020 & 2033
- Table 68: Global Pompe Disease Treatment Industry Volume K Unit Forecast, by End-User 2020 & 2033
- Table 69: Global Pompe Disease Treatment Industry Revenue billion Forecast, by Country 2020 & 2033
- Table 70: Global Pompe Disease Treatment Industry Volume K Unit Forecast, by Country 2020 & 2033
- Table 71: GCC Pompe Disease Treatment Industry Revenue (billion) Forecast, by Application 2020 & 2033
- Table 72: GCC Pompe Disease Treatment Industry Volume (K Unit) Forecast, by Application 2020 & 2033
- Table 73: South Africa Pompe Disease Treatment Industry Revenue (billion) Forecast, by Application 2020 & 2033
- Table 74: South Africa Pompe Disease Treatment Industry Volume (K Unit) Forecast, by Application 2020 & 2033
- Table 75: Rest of Middle East and Africa Pompe Disease Treatment Industry Revenue (billion) Forecast, by Application 2020 & 2033
- Table 76: Rest of Middle East and Africa Pompe Disease Treatment Industry Volume (K Unit) Forecast, by Application 2020 & 2033
- Table 77: Global Pompe Disease Treatment Industry Revenue billion Forecast, by Route of Administration 2020 & 2033
- Table 78: Global Pompe Disease Treatment Industry Volume K Unit Forecast, by Route of Administration 2020 & 2033
- Table 79: Global Pompe Disease Treatment Industry Revenue billion Forecast, by Treatment Type 2020 & 2033
- Table 80: Global Pompe Disease Treatment Industry Volume K Unit Forecast, by Treatment Type 2020 & 2033
- Table 81: Global Pompe Disease Treatment Industry Revenue billion Forecast, by End-User 2020 & 2033
- Table 82: Global Pompe Disease Treatment Industry Volume K Unit Forecast, by End-User 2020 & 2033
- Table 83: Global Pompe Disease Treatment Industry Revenue billion Forecast, by Country 2020 & 2033
- Table 84: Global Pompe Disease Treatment Industry Volume K Unit Forecast, by Country 2020 & 2033
- Table 85: Brazil Pompe Disease Treatment Industry Revenue (billion) Forecast, by Application 2020 & 2033
- Table 86: Brazil Pompe Disease Treatment Industry Volume (K Unit) Forecast, by Application 2020 & 2033
- Table 87: Argentina Pompe Disease Treatment Industry Revenue (billion) Forecast, by Application 2020 & 2033
- Table 88: Argentina Pompe Disease Treatment Industry Volume (K Unit) Forecast, by Application 2020 & 2033
- Table 89: Rest of South America Pompe Disease Treatment Industry Revenue (billion) Forecast, by Application 2020 & 2033
- Table 90: Rest of South America Pompe Disease Treatment Industry Volume (K Unit) Forecast, by Application 2020 & 2033
Frequently Asked Questions
1. What is the projected Compound Annual Growth Rate (CAGR) of the Pompe Disease Treatment Industry?
The projected CAGR is approximately 4.4%.
2. Which companies are prominent players in the Pompe Disease Treatment Industry?
Key companies in the market include Astellas Pharma, Amicus Therapeutics, Sanofi, EpiVax Inc, AVROBIO Inc , Genethon, Oxyrane.
3. What are the main segments of the Pompe Disease Treatment Industry?
The market segments include Route of Administration, Treatment Type, End-User.
4. Can you provide details about the market size?
The market size is estimated to be USD 1.6 billion as of 2022.
5. What are some drivers contributing to market growth?
Launch of Novel Drugs; Continued Uptake of Long Term Therapies.
6. What are the notable trends driving market growth?
Enzyme Replacement Therapy (ERT) Segment is Estimated to Witness a Considerable Growth Over the Forecast Period.
7. Are there any restraints impacting market growth?
High Treatment Cost.
8. Can you provide examples of recent developments in the market?
June 2022: The European Commission granted marketing authorization for Nexvia Dyme (alglucosidase alfa), an enzyme replacement therapy (ERT) for the long-term treatment of both late-onset and infantile-onset Pompe disease, a rare, progressive, and debilitating muscle disorder.
9. What pricing options are available for accessing the report?
Pricing options include single-user, multi-user, and enterprise licenses priced at USD 4750, USD 5250, and USD 8750 respectively.
10. Is the market size provided in terms of value or volume?
The market size is provided in terms of value, measured in billion and volume, measured in K Unit.
11. Are there any specific market keywords associated with the report?
Yes, the market keyword associated with the report is "Pompe Disease Treatment Industry," which aids in identifying and referencing the specific market segment covered.
12. How do I determine which pricing option suits my needs best?
The pricing options vary based on user requirements and access needs. Individual users may opt for single-user licenses, while businesses requiring broader access may choose multi-user or enterprise licenses for cost-effective access to the report.
13. Are there any additional resources or data provided in the Pompe Disease Treatment Industry report?
While the report offers comprehensive insights, it's advisable to review the specific contents or supplementary materials provided to ascertain if additional resources or data are available.
14. How can I stay updated on further developments or reports in the Pompe Disease Treatment Industry?
To stay informed about further developments, trends, and reports in the Pompe Disease Treatment Industry, consider subscribing to industry newsletters, following relevant companies and organizations, or regularly checking reputable industry news sources and publications.
Methodology
Step 1 - Identification of Relevant Samples Size from Population Database


Step 2 - Approaches for Defining Global Market Size (Value, Volume* & Price*)

Note*: In applicable scenarios
Step 3 - Data Sources
Primary Research
- Web Analytics
- Survey Reports
- Research Institute
- Latest Research Reports
- Opinion Leaders
Secondary Research
- Annual Reports
- White Paper
- Latest Press Release
- Industry Association
- Paid Database
- Investor Presentations

Step 4 - Data Triangulation
Involves using different sources of information in order to increase the validity of a study
These sources are likely to be stakeholders in a program - participants, other researchers, program staff, other community members, and so on.
Then we put all data in single framework & apply various statistical tools to find out the dynamic on the market.
During the analysis stage, feedback from the stakeholder groups would be compared to determine areas of agreement as well as areas of divergence