


Key Insights
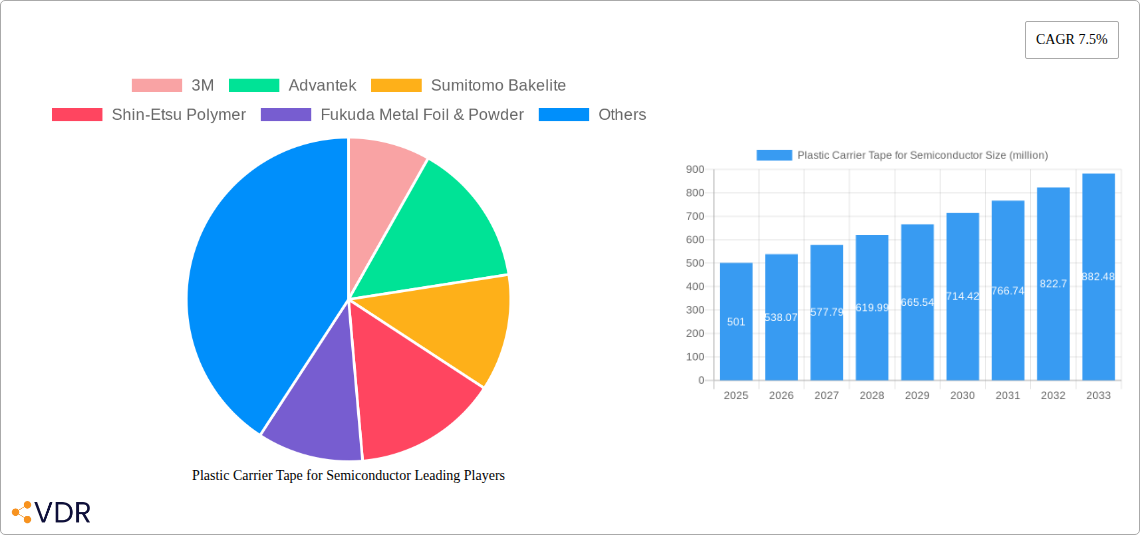
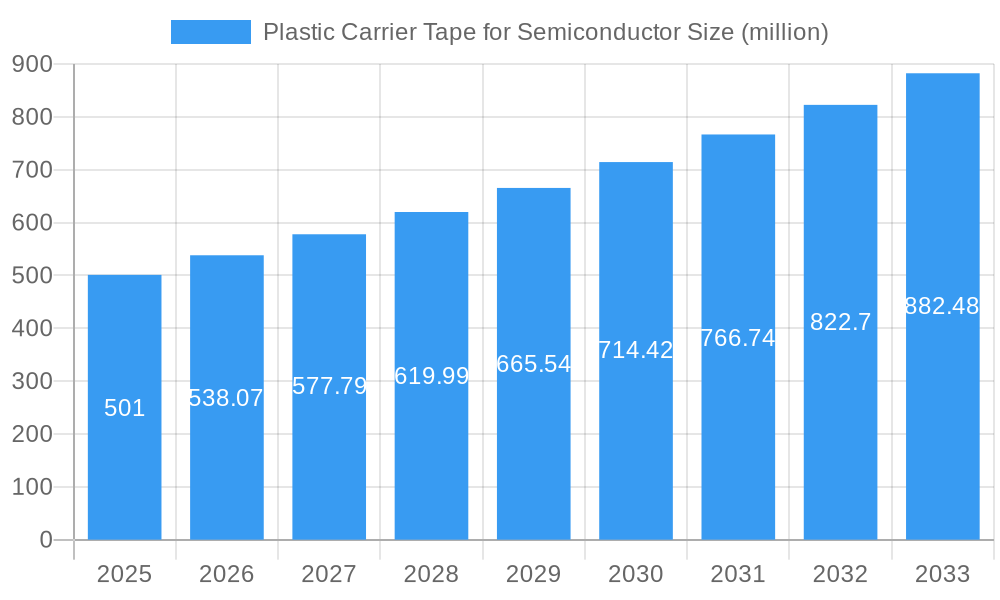
The global market for Plastic Carrier Tape (PCT) for semiconductors, valued at $501 million in 2025, is projected to experience robust growth, driven by the surging demand for advanced semiconductor packaging and the increasing adoption of automated assembly processes in the electronics industry. The 7.5% Compound Annual Growth Rate (CAGR) indicates a significant expansion through 2033, fueled by several key factors. The miniaturization of electronic components necessitates high-precision PCTs, stimulating innovation in material science and manufacturing techniques. Furthermore, the rising adoption of advanced packaging technologies like system-in-package (SiP) and 3D stacking directly increases the demand for PCTs, as these techniques require more sophisticated carrier tapes to handle the complexities of chip placement and protection. Increased automation in semiconductor manufacturing plants also contributes to higher PCT demand. While potential restraints like fluctuations in raw material prices and the emergence of alternative packaging solutions exist, the overall market outlook remains positive due to the long-term growth trajectory of the semiconductor industry itself.
Plastic Carrier Tape for Semiconductor Market Size (In Million)

The competitive landscape is characterized by a mix of established players and regional manufacturers. Companies like 3M, Sumitomo Bakelite, and Shin-Etsu Polymer hold significant market share due to their technological expertise and extensive distribution networks. However, regional players such as Zhejiang Jiemei Electronic Technology are gaining traction, particularly in emerging markets. The market is likely to witness increased consolidation and strategic partnerships in the coming years, driven by the need for technological advancements and global reach. Future growth will depend on factors such as the development of sustainable and environmentally friendly PCT materials, continuous improvements in tape performance (e.g., higher precision, enhanced ESD protection), and the overall health of the global electronics manufacturing sector. Further diversification into specialized PCTs for niche applications will also contribute to market expansion.
Plastic Carrier Tape for Semiconductor Company Market Share
Plastic Carrier Tape for Semiconductor Market Report: 2019-2033
This comprehensive report provides a detailed analysis of the Plastic Carrier Tape (PCT) for Semiconductor market, offering invaluable insights for industry professionals, investors, and strategic decision-makers. The study covers the period from 2019 to 2033, with a focus on the forecast period from 2025 to 2033, and utilizes 2025 as the base year. The report segments the market by key players, regions, and applications, providing a 360-degree view of this vital component in the semiconductor packaging supply chain. The global market size in 2025 is estimated at xx million units.
Plastic Carrier Tape for Semiconductor Market Dynamics & Structure
The Plastic Carrier Tape for Semiconductor market exhibits moderate concentration, with key players holding significant market share. Technological innovation, particularly in materials science and automation, is a primary growth driver. Stringent regulatory frameworks regarding material safety and environmental impact influence product development and manufacturing processes. Competitive substitutes, such as embossed tapes and other specialized packaging solutions, present challenges. The end-user demographic consists primarily of leading semiconductor manufacturers and integrated device manufacturers (IDMs) across various geographic regions. M&A activity has been relatively moderate, with xx major deals recorded between 2019 and 2024, primarily focused on expanding production capacity and technological capabilities.
- Market Concentration: Moderately concentrated, with top 5 players holding approximately xx% of the market share in 2025.
- Technological Innovation: Focus on high-precision tapes, improved material properties (e.g., reduced moisture absorption, increased temperature resistance), and automated handling systems.
- Regulatory Framework: Compliance with RoHS, REACH, and other environmental regulations is crucial.
- Competitive Substitutes: Embossed tapes and other specialized packaging solutions pose a competitive threat.
- End-User Demographics: Predominantly large-scale semiconductor manufacturers and IDMs.
- M&A Trends: xx major mergers and acquisitions observed during the historical period (2019-2024), primarily driven by capacity expansion and technological integration.
Plastic Carrier Tape for Semiconductor Growth Trends & Insights
The Plastic Carrier Tape for Semiconductor market has experienced steady growth over the historical period (2019-2024), driven by the increasing demand for advanced semiconductor devices. The market size has grown from xx million units in 2019 to an estimated xx million units in 2025, exhibiting a CAGR of xx%. This growth is primarily attributed to the increasing adoption of advanced packaging technologies, miniaturization trends in electronics, and the expansion of end-use applications across various industries (consumer electronics, automotive, and industrial automation). Technological disruptions, such as the development of new materials and manufacturing processes, are further accelerating market growth. Consumer behavior shifts toward smaller, more powerful devices contribute significantly to the market demand.
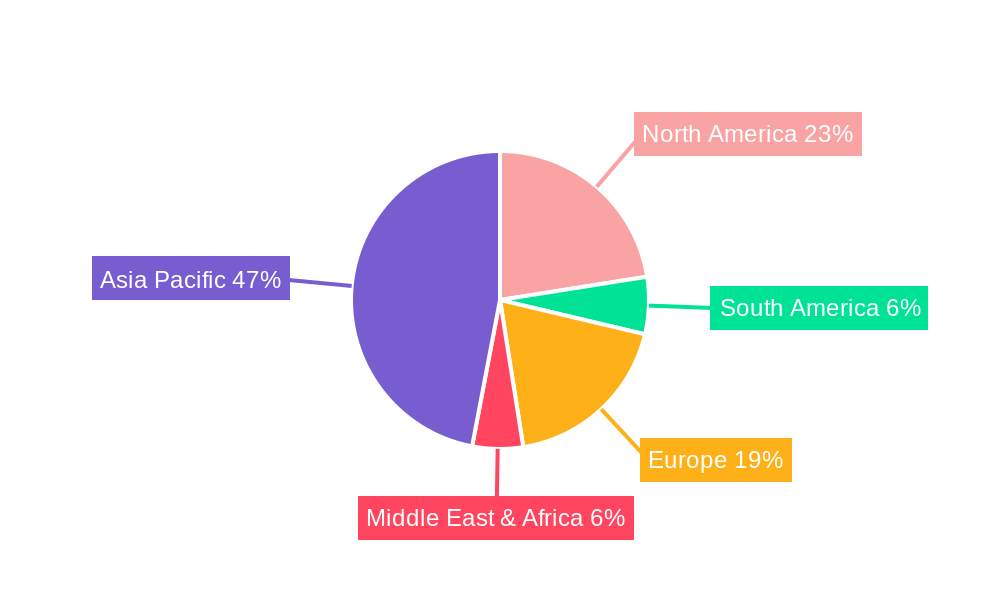
Dominant Regions, Countries, or Segments in Plastic Carrier Tape for Semiconductor
The Asia-Pacific region, particularly East Asia (China, Japan, South Korea, and Taiwan), dominates the Plastic Carrier Tape for Semiconductor market. This dominance is attributed to the high concentration of semiconductor manufacturing facilities in the region, robust economic growth, and supportive government policies promoting technological advancement. The strong presence of leading semiconductor manufacturers drives substantial demand for PCTs.
- Key Drivers: High semiconductor manufacturing concentration, robust economic growth, supportive government policies (e.g., subsidies, tax incentives), well-developed infrastructure, and skilled workforce.
- Dominance Factors: High market share (xx% in 2025), significant growth potential driven by ongoing investments in semiconductor manufacturing capacity.
Plastic Carrier Tape for Semiconductor Product Landscape
The product landscape encompasses a wide range of PCTs, varying in material composition, dimensions, and performance characteristics. Innovations focus on enhancing material properties to improve protection against moisture, electrostatic discharge (ESD), and thermal stress during transportation and handling. Advanced features like improved adhesion, higher tensile strength, and compatibility with automated handling systems are key selling points. Recent advancements include the development of environmentally friendly, recyclable PCTs, catering to the growing demand for sustainable packaging solutions.
Key Drivers, Barriers & Challenges in Plastic Carrier Tape for Semiconductor
Key Drivers: The increasing demand for semiconductor devices fuels market growth. Technological advancements in PCT manufacturing (e.g., higher precision, improved materials) enhance product performance and drive adoption. Government support for the semiconductor industry through various initiatives further accelerates market expansion.
Key Challenges: Fluctuations in raw material prices impact profitability. Intense competition from established and emerging players creates pricing pressure. Supply chain disruptions and geopolitical instability pose significant risks to production and delivery.
Emerging Opportunities in Plastic Carrier Tape for Semiconductor
Emerging opportunities include the growing demand for high-precision PCTs for advanced packaging technologies such as 3D stacking and system-in-package (SiP). The increasing adoption of automation in semiconductor manufacturing creates opportunities for innovative PCT designs compatible with automated handling systems. Expanding into new applications beyond traditional electronics packaging further presents growth potential. Sustainable and eco-friendly PCTs are gaining traction, creating new opportunities for manufacturers committed to environmental responsibility.
Growth Accelerators in the Plastic Carrier Tape for Semiconductor Industry
Technological advancements, particularly in material science and automation, are key growth accelerators. Strategic partnerships between PCT manufacturers and semiconductor companies facilitate the development of tailored solutions, enhancing product performance and reducing costs. Market expansion into emerging economies presents significant opportunities for growth.
Key Players Shaping the Plastic Carrier Tape for Semiconductor Market
- 3M
- Advantek
- Sumitomo Bakelite
- Shin-Etsu Polymer
- Fukuda Metal Foil & Powder
- Oji F-Tex
- Zhejiang Jiemei Electronic Technology
- Asahi Kasei
- YAC GARTER
- SHINGOSHU
- SEKISUI SEIKEI
- Kanazu Giken
- NIPPO CO.,LTD
- Yes One Co.,Ltd
- JSK Co.,Ltd
- C-Pak
- LaserTek Taiwan
- ADY Co.,Ltd
Notable Milestones in Plastic Carrier Tape for Semiconductor Sector
- 2020: Introduction of a new eco-friendly PCT by 3M.
- 2021: Partnership between Advantek and a major semiconductor manufacturer for customized PCT solutions.
- 2022: Launch of a high-precision PCT by Sumitomo Bakelite for advanced packaging applications.
- 2023: Acquisition of a smaller PCT manufacturer by Shin-Etsu Polymer, expanding its production capacity.
- 2024: Significant increase in investment in R&D of high-performance PCTs.
In-Depth Plastic Carrier Tape for Semiconductor Market Outlook
The Plastic Carrier Tape for Semiconductor market is poised for continued growth, driven by technological advancements, rising demand for advanced semiconductor devices, and strategic expansion into new markets. Focusing on innovation, sustainability, and strategic partnerships will be crucial for companies to capture market share and achieve long-term success. The market is expected to reach xx million units by 2033, representing significant growth potential for industry participants.
Plastic Carrier Tape for Semiconductor Segmentation
-
1. Application
- 1.1. Discrete Device
- 1.2. IC Packaging
-
2. Types
- 2.1. PC Carrier Tape
- 2.2. PS Carrier Tape
Plastic Carrier Tape for Semiconductor Segmentation By Geography
-
1. North America
- 1.1. United States
- 1.2. Canada
- 1.3. Mexico
-
2. South America
- 2.1. Brazil
- 2.2. Argentina
- 2.3. Rest of South America
-
3. Europe
- 3.1. United Kingdom
- 3.2. Germany
- 3.3. France
- 3.4. Italy
- 3.5. Spain
- 3.6. Russia
- 3.7. Benelux
- 3.8. Nordics
- 3.9. Rest of Europe
-
4. Middle East & Africa
- 4.1. Turkey
- 4.2. Israel
- 4.3. GCC
- 4.4. North Africa
- 4.5. South Africa
- 4.6. Rest of Middle East & Africa
-
5. Asia Pacific
- 5.1. China
- 5.2. India
- 5.3. Japan
- 5.4. South Korea
- 5.5. ASEAN
- 5.6. Oceania
- 5.7. Rest of Asia Pacific
Plastic Carrier Tape for Semiconductor Regional Market Share
Geographic Coverage of Plastic Carrier Tape for Semiconductor
Plastic Carrier Tape for Semiconductor REPORT HIGHLIGHTS
| Aspects | Details |
|---|---|
| Study Period | 2020-2034 |
| Base Year | 2025 |
| Estimated Year | 2026 |
| Forecast Period | 2026-2034 |
| Historical Period | 2020-2025 |
| Growth Rate | CAGR of 7.5% from 2020-2034 |
| Segmentation |
|
Table of Contents
- 1. Introduction
- 1.1. Research Scope
- 1.2. Market Segmentation
- 1.3. Research Methodology
- 1.4. Definitions and Assumptions
- 2. Executive Summary
- 2.1. Introduction
- 3. Market Dynamics
- 3.1. Introduction
- 3.2. Market Drivers
- 3.3. Market Restrains
- 3.4. Market Trends
- 4. Market Factor Analysis
- 4.1. Porters Five Forces
- 4.2. Supply/Value Chain
- 4.3. PESTEL analysis
- 4.4. Market Entropy
- 4.5. Patent/Trademark Analysis
- 5. Global Plastic Carrier Tape for Semiconductor Analysis, Insights and Forecast, 2020-2032
- 5.1. Market Analysis, Insights and Forecast - by Application
- 5.1.1. Discrete Device
- 5.1.2. IC Packaging
- 5.2. Market Analysis, Insights and Forecast - by Types
- 5.2.1. PC Carrier Tape
- 5.2.2. PS Carrier Tape
- 5.3. Market Analysis, Insights and Forecast - by Region
- 5.3.1. North America
- 5.3.2. South America
- 5.3.3. Europe
- 5.3.4. Middle East & Africa
- 5.3.5. Asia Pacific
- 5.1. Market Analysis, Insights and Forecast - by Application
- 6. North America Plastic Carrier Tape for Semiconductor Analysis, Insights and Forecast, 2020-2032
- 6.1. Market Analysis, Insights and Forecast - by Application
- 6.1.1. Discrete Device
- 6.1.2. IC Packaging
- 6.2. Market Analysis, Insights and Forecast - by Types
- 6.2.1. PC Carrier Tape
- 6.2.2. PS Carrier Tape
- 6.1. Market Analysis, Insights and Forecast - by Application
- 7. South America Plastic Carrier Tape for Semiconductor Analysis, Insights and Forecast, 2020-2032
- 7.1. Market Analysis, Insights and Forecast - by Application
- 7.1.1. Discrete Device
- 7.1.2. IC Packaging
- 7.2. Market Analysis, Insights and Forecast - by Types
- 7.2.1. PC Carrier Tape
- 7.2.2. PS Carrier Tape
- 7.1. Market Analysis, Insights and Forecast - by Application
- 8. Europe Plastic Carrier Tape for Semiconductor Analysis, Insights and Forecast, 2020-2032
- 8.1. Market Analysis, Insights and Forecast - by Application
- 8.1.1. Discrete Device
- 8.1.2. IC Packaging
- 8.2. Market Analysis, Insights and Forecast - by Types
- 8.2.1. PC Carrier Tape
- 8.2.2. PS Carrier Tape
- 8.1. Market Analysis, Insights and Forecast - by Application
- 9. Middle East & Africa Plastic Carrier Tape for Semiconductor Analysis, Insights and Forecast, 2020-2032
- 9.1. Market Analysis, Insights and Forecast - by Application
- 9.1.1. Discrete Device
- 9.1.2. IC Packaging
- 9.2. Market Analysis, Insights and Forecast - by Types
- 9.2.1. PC Carrier Tape
- 9.2.2. PS Carrier Tape
- 9.1. Market Analysis, Insights and Forecast - by Application
- 10. Asia Pacific Plastic Carrier Tape for Semiconductor Analysis, Insights and Forecast, 2020-2032
- 10.1. Market Analysis, Insights and Forecast - by Application
- 10.1.1. Discrete Device
- 10.1.2. IC Packaging
- 10.2. Market Analysis, Insights and Forecast - by Types
- 10.2.1. PC Carrier Tape
- 10.2.2. PS Carrier Tape
- 10.1. Market Analysis, Insights and Forecast - by Application
- 11. Competitive Analysis
- 11.1. Global Market Share Analysis 2025
- 11.2. Company Profiles
- 11.2.1 3M
- 11.2.1.1. Overview
- 11.2.1.2. Products
- 11.2.1.3. SWOT Analysis
- 11.2.1.4. Recent Developments
- 11.2.1.5. Financials (Based on Availability)
- 11.2.2 Advantek
- 11.2.2.1. Overview
- 11.2.2.2. Products
- 11.2.2.3. SWOT Analysis
- 11.2.2.4. Recent Developments
- 11.2.2.5. Financials (Based on Availability)
- 11.2.3 Sumitomo Bakelite
- 11.2.3.1. Overview
- 11.2.3.2. Products
- 11.2.3.3. SWOT Analysis
- 11.2.3.4. Recent Developments
- 11.2.3.5. Financials (Based on Availability)
- 11.2.4 Shin-Etsu Polymer
- 11.2.4.1. Overview
- 11.2.4.2. Products
- 11.2.4.3. SWOT Analysis
- 11.2.4.4. Recent Developments
- 11.2.4.5. Financials (Based on Availability)
- 11.2.5 Fukuda Metal Foil & Powder
- 11.2.5.1. Overview
- 11.2.5.2. Products
- 11.2.5.3. SWOT Analysis
- 11.2.5.4. Recent Developments
- 11.2.5.5. Financials (Based on Availability)
- 11.2.6 Oji F-Tex
- 11.2.6.1. Overview
- 11.2.6.2. Products
- 11.2.6.3. SWOT Analysis
- 11.2.6.4. Recent Developments
- 11.2.6.5. Financials (Based on Availability)
- 11.2.7 Zhejiang Jiemei Electronic Technology
- 11.2.7.1. Overview
- 11.2.7.2. Products
- 11.2.7.3. SWOT Analysis
- 11.2.7.4. Recent Developments
- 11.2.7.5. Financials (Based on Availability)
- 11.2.8 Asahi Kasei
- 11.2.8.1. Overview
- 11.2.8.2. Products
- 11.2.8.3. SWOT Analysis
- 11.2.8.4. Recent Developments
- 11.2.8.5. Financials (Based on Availability)
- 11.2.9 YAC GARTER
- 11.2.9.1. Overview
- 11.2.9.2. Products
- 11.2.9.3. SWOT Analysis
- 11.2.9.4. Recent Developments
- 11.2.9.5. Financials (Based on Availability)
- 11.2.10 SHINGOSHU
- 11.2.10.1. Overview
- 11.2.10.2. Products
- 11.2.10.3. SWOT Analysis
- 11.2.10.4. Recent Developments
- 11.2.10.5. Financials (Based on Availability)
- 11.2.11 SEKISUI SEIKEI
- 11.2.11.1. Overview
- 11.2.11.2. Products
- 11.2.11.3. SWOT Analysis
- 11.2.11.4. Recent Developments
- 11.2.11.5. Financials (Based on Availability)
- 11.2.12 Kanazu Giken
- 11.2.12.1. Overview
- 11.2.12.2. Products
- 11.2.12.3. SWOT Analysis
- 11.2.12.4. Recent Developments
- 11.2.12.5. Financials (Based on Availability)
- 11.2.13 NIPPO CO.
- 11.2.13.1. Overview
- 11.2.13.2. Products
- 11.2.13.3. SWOT Analysis
- 11.2.13.4. Recent Developments
- 11.2.13.5. Financials (Based on Availability)
- 11.2.14 LTD
- 11.2.14.1. Overview
- 11.2.14.2. Products
- 11.2.14.3. SWOT Analysis
- 11.2.14.4. Recent Developments
- 11.2.14.5. Financials (Based on Availability)
- 11.2.15 Yes One Co.
- 11.2.15.1. Overview
- 11.2.15.2. Products
- 11.2.15.3. SWOT Analysis
- 11.2.15.4. Recent Developments
- 11.2.15.5. Financials (Based on Availability)
- 11.2.16 Ltd
- 11.2.16.1. Overview
- 11.2.16.2. Products
- 11.2.16.3. SWOT Analysis
- 11.2.16.4. Recent Developments
- 11.2.16.5. Financials (Based on Availability)
- 11.2.17 JSK Co.
- 11.2.17.1. Overview
- 11.2.17.2. Products
- 11.2.17.3. SWOT Analysis
- 11.2.17.4. Recent Developments
- 11.2.17.5. Financials (Based on Availability)
- 11.2.18 Ltd
- 11.2.18.1. Overview
- 11.2.18.2. Products
- 11.2.18.3. SWOT Analysis
- 11.2.18.4. Recent Developments
- 11.2.18.5. Financials (Based on Availability)
- 11.2.19 C-Pak
- 11.2.19.1. Overview
- 11.2.19.2. Products
- 11.2.19.3. SWOT Analysis
- 11.2.19.4. Recent Developments
- 11.2.19.5. Financials (Based on Availability)
- 11.2.20 LaserTek Taiwan
- 11.2.20.1. Overview
- 11.2.20.2. Products
- 11.2.20.3. SWOT Analysis
- 11.2.20.4. Recent Developments
- 11.2.20.5. Financials (Based on Availability)
- 11.2.21 ADY Co.
- 11.2.21.1. Overview
- 11.2.21.2. Products
- 11.2.21.3. SWOT Analysis
- 11.2.21.4. Recent Developments
- 11.2.21.5. Financials (Based on Availability)
- 11.2.22 Ltd
- 11.2.22.1. Overview
- 11.2.22.2. Products
- 11.2.22.3. SWOT Analysis
- 11.2.22.4. Recent Developments
- 11.2.22.5. Financials (Based on Availability)
- 11.2.1 3M
List of Figures
- Figure 1: Global Plastic Carrier Tape for Semiconductor Revenue Breakdown (million, %) by Region 2025 & 2033
- Figure 2: Global Plastic Carrier Tape for Semiconductor Volume Breakdown (K, %) by Region 2025 & 2033
- Figure 3: North America Plastic Carrier Tape for Semiconductor Revenue (million), by Application 2025 & 2033
- Figure 4: North America Plastic Carrier Tape for Semiconductor Volume (K), by Application 2025 & 2033
- Figure 5: North America Plastic Carrier Tape for Semiconductor Revenue Share (%), by Application 2025 & 2033
- Figure 6: North America Plastic Carrier Tape for Semiconductor Volume Share (%), by Application 2025 & 2033
- Figure 7: North America Plastic Carrier Tape for Semiconductor Revenue (million), by Types 2025 & 2033
- Figure 8: North America Plastic Carrier Tape for Semiconductor Volume (K), by Types 2025 & 2033
- Figure 9: North America Plastic Carrier Tape for Semiconductor Revenue Share (%), by Types 2025 & 2033
- Figure 10: North America Plastic Carrier Tape for Semiconductor Volume Share (%), by Types 2025 & 2033
- Figure 11: North America Plastic Carrier Tape for Semiconductor Revenue (million), by Country 2025 & 2033
- Figure 12: North America Plastic Carrier Tape for Semiconductor Volume (K), by Country 2025 & 2033
- Figure 13: North America Plastic Carrier Tape for Semiconductor Revenue Share (%), by Country 2025 & 2033
- Figure 14: North America Plastic Carrier Tape for Semiconductor Volume Share (%), by Country 2025 & 2033
- Figure 15: South America Plastic Carrier Tape for Semiconductor Revenue (million), by Application 2025 & 2033
- Figure 16: South America Plastic Carrier Tape for Semiconductor Volume (K), by Application 2025 & 2033
- Figure 17: South America Plastic Carrier Tape for Semiconductor Revenue Share (%), by Application 2025 & 2033
- Figure 18: South America Plastic Carrier Tape for Semiconductor Volume Share (%), by Application 2025 & 2033
- Figure 19: South America Plastic Carrier Tape for Semiconductor Revenue (million), by Types 2025 & 2033
- Figure 20: South America Plastic Carrier Tape for Semiconductor Volume (K), by Types 2025 & 2033
- Figure 21: South America Plastic Carrier Tape for Semiconductor Revenue Share (%), by Types 2025 & 2033
- Figure 22: South America Plastic Carrier Tape for Semiconductor Volume Share (%), by Types 2025 & 2033
- Figure 23: South America Plastic Carrier Tape for Semiconductor Revenue (million), by Country 2025 & 2033
- Figure 24: South America Plastic Carrier Tape for Semiconductor Volume (K), by Country 2025 & 2033
- Figure 25: South America Plastic Carrier Tape for Semiconductor Revenue Share (%), by Country 2025 & 2033
- Figure 26: South America Plastic Carrier Tape for Semiconductor Volume Share (%), by Country 2025 & 2033
- Figure 27: Europe Plastic Carrier Tape for Semiconductor Revenue (million), by Application 2025 & 2033
- Figure 28: Europe Plastic Carrier Tape for Semiconductor Volume (K), by Application 2025 & 2033
- Figure 29: Europe Plastic Carrier Tape for Semiconductor Revenue Share (%), by Application 2025 & 2033
- Figure 30: Europe Plastic Carrier Tape for Semiconductor Volume Share (%), by Application 2025 & 2033
- Figure 31: Europe Plastic Carrier Tape for Semiconductor Revenue (million), by Types 2025 & 2033
- Figure 32: Europe Plastic Carrier Tape for Semiconductor Volume (K), by Types 2025 & 2033
- Figure 33: Europe Plastic Carrier Tape for Semiconductor Revenue Share (%), by Types 2025 & 2033
- Figure 34: Europe Plastic Carrier Tape for Semiconductor Volume Share (%), by Types 2025 & 2033
- Figure 35: Europe Plastic Carrier Tape for Semiconductor Revenue (million), by Country 2025 & 2033
- Figure 36: Europe Plastic Carrier Tape for Semiconductor Volume (K), by Country 2025 & 2033
- Figure 37: Europe Plastic Carrier Tape for Semiconductor Revenue Share (%), by Country 2025 & 2033
- Figure 38: Europe Plastic Carrier Tape for Semiconductor Volume Share (%), by Country 2025 & 2033
- Figure 39: Middle East & Africa Plastic Carrier Tape for Semiconductor Revenue (million), by Application 2025 & 2033
- Figure 40: Middle East & Africa Plastic Carrier Tape for Semiconductor Volume (K), by Application 2025 & 2033
- Figure 41: Middle East & Africa Plastic Carrier Tape for Semiconductor Revenue Share (%), by Application 2025 & 2033
- Figure 42: Middle East & Africa Plastic Carrier Tape for Semiconductor Volume Share (%), by Application 2025 & 2033
- Figure 43: Middle East & Africa Plastic Carrier Tape for Semiconductor Revenue (million), by Types 2025 & 2033
- Figure 44: Middle East & Africa Plastic Carrier Tape for Semiconductor Volume (K), by Types 2025 & 2033
- Figure 45: Middle East & Africa Plastic Carrier Tape for Semiconductor Revenue Share (%), by Types 2025 & 2033
- Figure 46: Middle East & Africa Plastic Carrier Tape for Semiconductor Volume Share (%), by Types 2025 & 2033
- Figure 47: Middle East & Africa Plastic Carrier Tape for Semiconductor Revenue (million), by Country 2025 & 2033
- Figure 48: Middle East & Africa Plastic Carrier Tape for Semiconductor Volume (K), by Country 2025 & 2033
- Figure 49: Middle East & Africa Plastic Carrier Tape for Semiconductor Revenue Share (%), by Country 2025 & 2033
- Figure 50: Middle East & Africa Plastic Carrier Tape for Semiconductor Volume Share (%), by Country 2025 & 2033
- Figure 51: Asia Pacific Plastic Carrier Tape for Semiconductor Revenue (million), by Application 2025 & 2033
- Figure 52: Asia Pacific Plastic Carrier Tape for Semiconductor Volume (K), by Application 2025 & 2033
- Figure 53: Asia Pacific Plastic Carrier Tape for Semiconductor Revenue Share (%), by Application 2025 & 2033
- Figure 54: Asia Pacific Plastic Carrier Tape for Semiconductor Volume Share (%), by Application 2025 & 2033
- Figure 55: Asia Pacific Plastic Carrier Tape for Semiconductor Revenue (million), by Types 2025 & 2033
- Figure 56: Asia Pacific Plastic Carrier Tape for Semiconductor Volume (K), by Types 2025 & 2033
- Figure 57: Asia Pacific Plastic Carrier Tape for Semiconductor Revenue Share (%), by Types 2025 & 2033
- Figure 58: Asia Pacific Plastic Carrier Tape for Semiconductor Volume Share (%), by Types 2025 & 2033
- Figure 59: Asia Pacific Plastic Carrier Tape for Semiconductor Revenue (million), by Country 2025 & 2033
- Figure 60: Asia Pacific Plastic Carrier Tape for Semiconductor Volume (K), by Country 2025 & 2033
- Figure 61: Asia Pacific Plastic Carrier Tape for Semiconductor Revenue Share (%), by Country 2025 & 2033
- Figure 62: Asia Pacific Plastic Carrier Tape for Semiconductor Volume Share (%), by Country 2025 & 2033
List of Tables
- Table 1: Global Plastic Carrier Tape for Semiconductor Revenue million Forecast, by Application 2020 & 2033
- Table 2: Global Plastic Carrier Tape for Semiconductor Volume K Forecast, by Application 2020 & 2033
- Table 3: Global Plastic Carrier Tape for Semiconductor Revenue million Forecast, by Types 2020 & 2033
- Table 4: Global Plastic Carrier Tape for Semiconductor Volume K Forecast, by Types 2020 & 2033
- Table 5: Global Plastic Carrier Tape for Semiconductor Revenue million Forecast, by Region 2020 & 2033
- Table 6: Global Plastic Carrier Tape for Semiconductor Volume K Forecast, by Region 2020 & 2033
- Table 7: Global Plastic Carrier Tape for Semiconductor Revenue million Forecast, by Application 2020 & 2033
- Table 8: Global Plastic Carrier Tape for Semiconductor Volume K Forecast, by Application 2020 & 2033
- Table 9: Global Plastic Carrier Tape for Semiconductor Revenue million Forecast, by Types 2020 & 2033
- Table 10: Global Plastic Carrier Tape for Semiconductor Volume K Forecast, by Types 2020 & 2033
- Table 11: Global Plastic Carrier Tape for Semiconductor Revenue million Forecast, by Country 2020 & 2033
- Table 12: Global Plastic Carrier Tape for Semiconductor Volume K Forecast, by Country 2020 & 2033
- Table 13: United States Plastic Carrier Tape for Semiconductor Revenue (million) Forecast, by Application 2020 & 2033
- Table 14: United States Plastic Carrier Tape for Semiconductor Volume (K) Forecast, by Application 2020 & 2033
- Table 15: Canada Plastic Carrier Tape for Semiconductor Revenue (million) Forecast, by Application 2020 & 2033
- Table 16: Canada Plastic Carrier Tape for Semiconductor Volume (K) Forecast, by Application 2020 & 2033
- Table 17: Mexico Plastic Carrier Tape for Semiconductor Revenue (million) Forecast, by Application 2020 & 2033
- Table 18: Mexico Plastic Carrier Tape for Semiconductor Volume (K) Forecast, by Application 2020 & 2033
- Table 19: Global Plastic Carrier Tape for Semiconductor Revenue million Forecast, by Application 2020 & 2033
- Table 20: Global Plastic Carrier Tape for Semiconductor Volume K Forecast, by Application 2020 & 2033
- Table 21: Global Plastic Carrier Tape for Semiconductor Revenue million Forecast, by Types 2020 & 2033
- Table 22: Global Plastic Carrier Tape for Semiconductor Volume K Forecast, by Types 2020 & 2033
- Table 23: Global Plastic Carrier Tape for Semiconductor Revenue million Forecast, by Country 2020 & 2033
- Table 24: Global Plastic Carrier Tape for Semiconductor Volume K Forecast, by Country 2020 & 2033
- Table 25: Brazil Plastic Carrier Tape for Semiconductor Revenue (million) Forecast, by Application 2020 & 2033
- Table 26: Brazil Plastic Carrier Tape for Semiconductor Volume (K) Forecast, by Application 2020 & 2033
- Table 27: Argentina Plastic Carrier Tape for Semiconductor Revenue (million) Forecast, by Application 2020 & 2033
- Table 28: Argentina Plastic Carrier Tape for Semiconductor Volume (K) Forecast, by Application 2020 & 2033
- Table 29: Rest of South America Plastic Carrier Tape for Semiconductor Revenue (million) Forecast, by Application 2020 & 2033
- Table 30: Rest of South America Plastic Carrier Tape for Semiconductor Volume (K) Forecast, by Application 2020 & 2033
- Table 31: Global Plastic Carrier Tape for Semiconductor Revenue million Forecast, by Application 2020 & 2033
- Table 32: Global Plastic Carrier Tape for Semiconductor Volume K Forecast, by Application 2020 & 2033
- Table 33: Global Plastic Carrier Tape for Semiconductor Revenue million Forecast, by Types 2020 & 2033
- Table 34: Global Plastic Carrier Tape for Semiconductor Volume K Forecast, by Types 2020 & 2033
- Table 35: Global Plastic Carrier Tape for Semiconductor Revenue million Forecast, by Country 2020 & 2033
- Table 36: Global Plastic Carrier Tape for Semiconductor Volume K Forecast, by Country 2020 & 2033
- Table 37: United Kingdom Plastic Carrier Tape for Semiconductor Revenue (million) Forecast, by Application 2020 & 2033
- Table 38: United Kingdom Plastic Carrier Tape for Semiconductor Volume (K) Forecast, by Application 2020 & 2033
- Table 39: Germany Plastic Carrier Tape for Semiconductor Revenue (million) Forecast, by Application 2020 & 2033
- Table 40: Germany Plastic Carrier Tape for Semiconductor Volume (K) Forecast, by Application 2020 & 2033
- Table 41: France Plastic Carrier Tape for Semiconductor Revenue (million) Forecast, by Application 2020 & 2033
- Table 42: France Plastic Carrier Tape for Semiconductor Volume (K) Forecast, by Application 2020 & 2033
- Table 43: Italy Plastic Carrier Tape for Semiconductor Revenue (million) Forecast, by Application 2020 & 2033
- Table 44: Italy Plastic Carrier Tape for Semiconductor Volume (K) Forecast, by Application 2020 & 2033
- Table 45: Spain Plastic Carrier Tape for Semiconductor Revenue (million) Forecast, by Application 2020 & 2033
- Table 46: Spain Plastic Carrier Tape for Semiconductor Volume (K) Forecast, by Application 2020 & 2033
- Table 47: Russia Plastic Carrier Tape for Semiconductor Revenue (million) Forecast, by Application 2020 & 2033
- Table 48: Russia Plastic Carrier Tape for Semiconductor Volume (K) Forecast, by Application 2020 & 2033
- Table 49: Benelux Plastic Carrier Tape for Semiconductor Revenue (million) Forecast, by Application 2020 & 2033
- Table 50: Benelux Plastic Carrier Tape for Semiconductor Volume (K) Forecast, by Application 2020 & 2033
- Table 51: Nordics Plastic Carrier Tape for Semiconductor Revenue (million) Forecast, by Application 2020 & 2033
- Table 52: Nordics Plastic Carrier Tape for Semiconductor Volume (K) Forecast, by Application 2020 & 2033
- Table 53: Rest of Europe Plastic Carrier Tape for Semiconductor Revenue (million) Forecast, by Application 2020 & 2033
- Table 54: Rest of Europe Plastic Carrier Tape for Semiconductor Volume (K) Forecast, by Application 2020 & 2033
- Table 55: Global Plastic Carrier Tape for Semiconductor Revenue million Forecast, by Application 2020 & 2033
- Table 56: Global Plastic Carrier Tape for Semiconductor Volume K Forecast, by Application 2020 & 2033
- Table 57: Global Plastic Carrier Tape for Semiconductor Revenue million Forecast, by Types 2020 & 2033
- Table 58: Global Plastic Carrier Tape for Semiconductor Volume K Forecast, by Types 2020 & 2033
- Table 59: Global Plastic Carrier Tape for Semiconductor Revenue million Forecast, by Country 2020 & 2033
- Table 60: Global Plastic Carrier Tape for Semiconductor Volume K Forecast, by Country 2020 & 2033
- Table 61: Turkey Plastic Carrier Tape for Semiconductor Revenue (million) Forecast, by Application 2020 & 2033
- Table 62: Turkey Plastic Carrier Tape for Semiconductor Volume (K) Forecast, by Application 2020 & 2033
- Table 63: Israel Plastic Carrier Tape for Semiconductor Revenue (million) Forecast, by Application 2020 & 2033
- Table 64: Israel Plastic Carrier Tape for Semiconductor Volume (K) Forecast, by Application 2020 & 2033
- Table 65: GCC Plastic Carrier Tape for Semiconductor Revenue (million) Forecast, by Application 2020 & 2033
- Table 66: GCC Plastic Carrier Tape for Semiconductor Volume (K) Forecast, by Application 2020 & 2033
- Table 67: North Africa Plastic Carrier Tape for Semiconductor Revenue (million) Forecast, by Application 2020 & 2033
- Table 68: North Africa Plastic Carrier Tape for Semiconductor Volume (K) Forecast, by Application 2020 & 2033
- Table 69: South Africa Plastic Carrier Tape for Semiconductor Revenue (million) Forecast, by Application 2020 & 2033
- Table 70: South Africa Plastic Carrier Tape for Semiconductor Volume (K) Forecast, by Application 2020 & 2033
- Table 71: Rest of Middle East & Africa Plastic Carrier Tape for Semiconductor Revenue (million) Forecast, by Application 2020 & 2033
- Table 72: Rest of Middle East & Africa Plastic Carrier Tape for Semiconductor Volume (K) Forecast, by Application 2020 & 2033
- Table 73: Global Plastic Carrier Tape for Semiconductor Revenue million Forecast, by Application 2020 & 2033
- Table 74: Global Plastic Carrier Tape for Semiconductor Volume K Forecast, by Application 2020 & 2033
- Table 75: Global Plastic Carrier Tape for Semiconductor Revenue million Forecast, by Types 2020 & 2033
- Table 76: Global Plastic Carrier Tape for Semiconductor Volume K Forecast, by Types 2020 & 2033
- Table 77: Global Plastic Carrier Tape for Semiconductor Revenue million Forecast, by Country 2020 & 2033
- Table 78: Global Plastic Carrier Tape for Semiconductor Volume K Forecast, by Country 2020 & 2033
- Table 79: China Plastic Carrier Tape for Semiconductor Revenue (million) Forecast, by Application 2020 & 2033
- Table 80: China Plastic Carrier Tape for Semiconductor Volume (K) Forecast, by Application 2020 & 2033
- Table 81: India Plastic Carrier Tape for Semiconductor Revenue (million) Forecast, by Application 2020 & 2033
- Table 82: India Plastic Carrier Tape for Semiconductor Volume (K) Forecast, by Application 2020 & 2033
- Table 83: Japan Plastic Carrier Tape for Semiconductor Revenue (million) Forecast, by Application 2020 & 2033
- Table 84: Japan Plastic Carrier Tape for Semiconductor Volume (K) Forecast, by Application 2020 & 2033
- Table 85: South Korea Plastic Carrier Tape for Semiconductor Revenue (million) Forecast, by Application 2020 & 2033
- Table 86: South Korea Plastic Carrier Tape for Semiconductor Volume (K) Forecast, by Application 2020 & 2033
- Table 87: ASEAN Plastic Carrier Tape for Semiconductor Revenue (million) Forecast, by Application 2020 & 2033
- Table 88: ASEAN Plastic Carrier Tape for Semiconductor Volume (K) Forecast, by Application 2020 & 2033
- Table 89: Oceania Plastic Carrier Tape for Semiconductor Revenue (million) Forecast, by Application 2020 & 2033
- Table 90: Oceania Plastic Carrier Tape for Semiconductor Volume (K) Forecast, by Application 2020 & 2033
- Table 91: Rest of Asia Pacific Plastic Carrier Tape for Semiconductor Revenue (million) Forecast, by Application 2020 & 2033
- Table 92: Rest of Asia Pacific Plastic Carrier Tape for Semiconductor Volume (K) Forecast, by Application 2020 & 2033
Frequently Asked Questions
1. What is the projected Compound Annual Growth Rate (CAGR) of the Plastic Carrier Tape for Semiconductor?
The projected CAGR is approximately 7.5%.
2. Which companies are prominent players in the Plastic Carrier Tape for Semiconductor?
Key companies in the market include 3M, Advantek, Sumitomo Bakelite, Shin-Etsu Polymer, Fukuda Metal Foil & Powder, Oji F-Tex, Zhejiang Jiemei Electronic Technology, Asahi Kasei, YAC GARTER, SHINGOSHU, SEKISUI SEIKEI, Kanazu Giken, NIPPO CO., LTD, Yes One Co., Ltd, JSK Co., Ltd, C-Pak, LaserTek Taiwan, ADY Co., Ltd.
3. What are the main segments of the Plastic Carrier Tape for Semiconductor?
The market segments include Application, Types.
4. Can you provide details about the market size?
The market size is estimated to be USD 501 million as of 2022.
5. What are some drivers contributing to market growth?
N/A
6. What are the notable trends driving market growth?
N/A
7. Are there any restraints impacting market growth?
N/A
8. Can you provide examples of recent developments in the market?
N/A
9. What pricing options are available for accessing the report?
Pricing options include single-user, multi-user, and enterprise licenses priced at USD 3950.00, USD 5925.00, and USD 7900.00 respectively.
10. Is the market size provided in terms of value or volume?
The market size is provided in terms of value, measured in million and volume, measured in K.
11. Are there any specific market keywords associated with the report?
Yes, the market keyword associated with the report is "Plastic Carrier Tape for Semiconductor," which aids in identifying and referencing the specific market segment covered.
12. How do I determine which pricing option suits my needs best?
The pricing options vary based on user requirements and access needs. Individual users may opt for single-user licenses, while businesses requiring broader access may choose multi-user or enterprise licenses for cost-effective access to the report.
13. Are there any additional resources or data provided in the Plastic Carrier Tape for Semiconductor report?
While the report offers comprehensive insights, it's advisable to review the specific contents or supplementary materials provided to ascertain if additional resources or data are available.
14. How can I stay updated on further developments or reports in the Plastic Carrier Tape for Semiconductor?
To stay informed about further developments, trends, and reports in the Plastic Carrier Tape for Semiconductor, consider subscribing to industry newsletters, following relevant companies and organizations, or regularly checking reputable industry news sources and publications.
Methodology
Step 1 - Identification of Relevant Samples Size from Population Database


Step 2 - Approaches for Defining Global Market Size (Value, Volume* & Price*)

Note*: In applicable scenarios
Step 3 - Data Sources
Primary Research
- Web Analytics
- Survey Reports
- Research Institute
- Latest Research Reports
- Opinion Leaders
Secondary Research
- Annual Reports
- White Paper
- Latest Press Release
- Industry Association
- Paid Database
- Investor Presentations

Step 4 - Data Triangulation
Involves using different sources of information in order to increase the validity of a study
These sources are likely to be stakeholders in a program - participants, other researchers, program staff, other community members, and so on.
Then we put all data in single framework & apply various statistical tools to find out the dynamic on the market.
During the analysis stage, feedback from the stakeholder groups would be compared to determine areas of agreement as well as areas of divergence