

Key Insights
The global plastic caps and closures market is projected for substantial growth, with an estimated size of 53.73 billion in 2025 and a Compound Annual Growth Rate (CAGR) of 3.2% from 2025 to 2033. This expansion is driven by the increasing demand from the food and beverage industry, coupled with the need for convenient packaging. The pharmaceutical sector's requirement for tamper-evident and child-resistant closures, alongside growing consumer preference for single-serve products in cosmetics and toiletries, further fuels this growth. Innovations in closure design, emphasizing enhanced functionality, sustainability, and recyclability, are also key market drivers. The market is segmented by application (food, pharmaceutical, beverage, cosmetics & toiletries, others) and raw material (PP, HDPE, LDPE, others). North America and Europe currently lead market share, while Asia-Pacific is expected to experience rapid growth due to its expanding consumer base and industrialization.
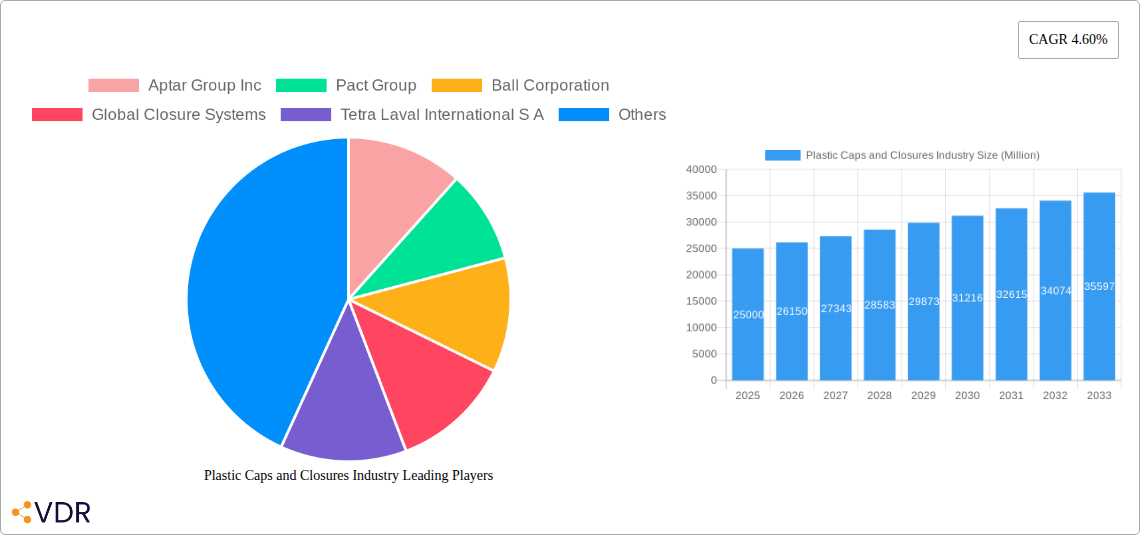
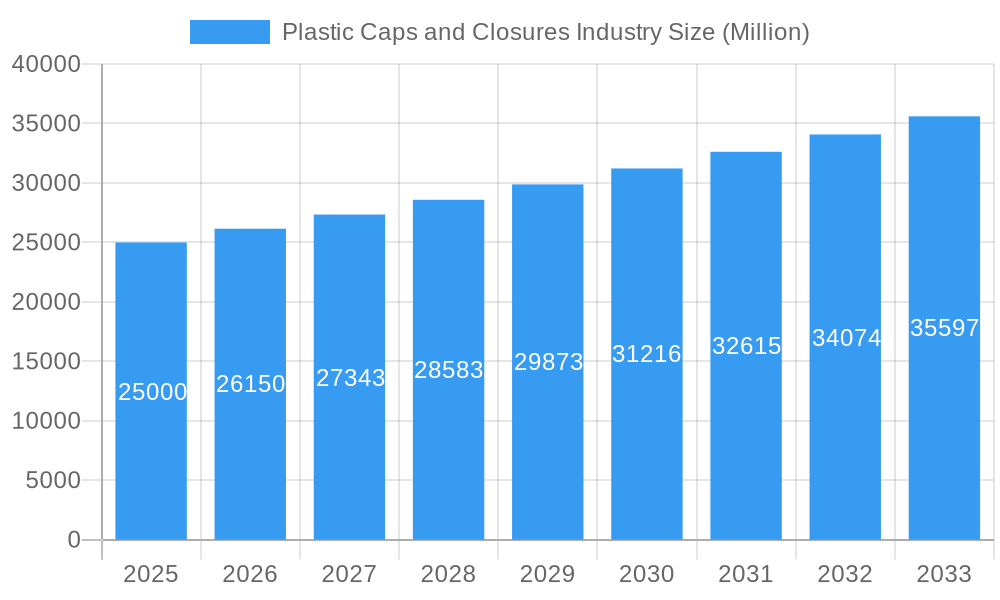
Plastic Caps and Closures Industry Market Size (In Billion)
Despite challenges such as environmental concerns related to plastic waste and increasing regulatory pressure for sustainable packaging, the market is adapting. The industry is focusing on biodegradable and recyclable materials, alongside alternative closure technologies. Competitive pressures and fluctuating raw material prices also influence market dynamics. Leading companies are investing in research and development for innovative materials and designs to meet evolving demands. The forecast period (2025-2033) anticipates continued market expansion, driven by the persistent reliance on plastic packaging across various industries. This robust growth presents significant opportunities for both established and new market entrants in sustainable and innovative packaging solutions.
Plastic Caps and Closures Industry Company Market Share
Plastic Caps and Closures Industry Market Report: 2019-2033
This comprehensive report provides a detailed analysis of the global plastic caps and closures industry, encompassing market dynamics, growth trends, regional performance, and key player activities from 2019 to 2033. The report covers the parent market of packaging and the child market of plastic caps and closures, offering a granular view of this vital sector. With a focus on key segments like food, beverage, pharmaceutical, and cosmetic applications, and raw materials such as PP, HDPE, and LDPE, this report is an invaluable resource for industry professionals, investors, and strategic decision-makers. The base year is 2025, with an estimated and forecast period from 2025 to 2033, and a historical period covering 2019-2024. All values are presented in million units.
Plastic Caps and Closures Industry Market Dynamics & Structure
The plastic caps and closures market is characterized by a moderately consolidated structure, with several major players holding significant market share. Technological innovation, driven by increasing demand for tamper-evident closures and sustainable solutions, is a key growth driver. Stringent regulatory frameworks concerning material safety and recyclability influence product development and manufacturing processes. The industry faces competition from alternative closure materials, such as metal and glass, and the market is experiencing continuous M&A activity.
- Market Concentration: xx% of the market is held by the top 5 players (estimated).
- Technological Innovation: Focus on lightweighting, recyclability, and improved tamper-evidence.
- Regulatory Landscape: Increasingly stringent regulations regarding plastic usage and recyclability.
- Competitive Substitutes: Metal, glass, and bio-based closures.
- End-User Demographics: Growth driven by increasing consumption in developing economies.
- M&A Trends: xx M&A deals recorded between 2019 and 2024 (estimated). Consolidation expected to continue.
- Innovation Barriers: High R&D costs and complex regulatory requirements.
Plastic Caps and Closures Industry Growth Trends & Insights
The global plastic caps and closures market experienced significant growth during the historical period (2019-2024), driven by factors such as rising consumer demand, particularly in emerging markets, and the expanding food and beverage industries. The market size is expected to continue its upward trajectory, exhibiting a Compound Annual Growth Rate (CAGR) of xx% during the forecast period (2025-2033). Technological disruptions, such as the increasing adoption of lightweight closures and the development of sustainable and recyclable materials, are further driving growth. Consumer behavior shifts towards convenience and product safety also play a significant role in market expansion. Market penetration for innovative closure technologies is projected to reach xx% by 2033.
Dominant Regions, Countries, or Segments in Plastic Caps and Closures Industry
The Asia-Pacific region is currently the dominant market for plastic caps and closures, driven by rapid economic growth, increasing population, and rising demand for packaged food and beverages. Within this region, China and India are leading national markets. Among applications, the beverage segment currently holds the largest market share, followed by the food sector. In terms of raw materials, polypropylene (PP) and high-density polyethylene (HDPE) dominate due to their cost-effectiveness and suitability for various applications.
- Key Drivers (Asia-Pacific): Rapid economic growth, increasing urbanization, and expanding middle class.
- Dominance Factors (Beverage Segment): High demand for carbonated soft drinks, bottled water, and juices.
- Growth Potential (Pharmaceutical Segment): Increasing demand for tamper-evident closures in the pharmaceutical industry.
- Raw Material Trends: Shift towards sustainable and recycled materials, including bio-based polymers.
Plastic Caps and Closures Industry Product Landscape
The plastic caps and closures market showcases a wide range of products, including screw caps, flip-top closures, dispensing closures, and tamper-evident seals. Recent innovations focus on enhanced functionality, improved sustainability, and enhanced consumer experience. These advancements include the integration of smart technologies, such as RFID tags, for improved track and trace capabilities, and the use of sustainable materials to reduce environmental impact. Unique selling propositions often center on ease of use, product protection, and eco-friendly features.
Key Drivers, Barriers & Challenges in Plastic Caps and Closures Industry
Key Drivers:
- Increasing demand from the food and beverage industry.
- Growing consumer preference for convenience and safety.
- Technological advancements in closure designs and materials.
- Expanding e-commerce and online retail.
Challenges & Restraints:
- Fluctuations in raw material prices, particularly petroleum-based plastics.
- Stringent environmental regulations and concerns about plastic waste.
- Intense competition from existing and emerging players.
- Supply chain disruptions impacting availability and costs.
Emerging Opportunities in Plastic Caps and Closures Industry
- Growing demand for sustainable and eco-friendly closures made from recycled or bio-based materials.
- Increasing adoption of smart closures incorporating technology for authentication and traceability.
- Expanding applications in the healthcare, personal care, and industrial sectors.
- Opportunities in emerging markets with growing consumer populations and disposable incomes.
Growth Accelerators in the Plastic Caps and Closures Industry Industry
Technological breakthroughs in material science are paving the way for lighter, stronger, and more sustainable closures. Strategic partnerships between closure manufacturers and packaging companies are driving innovation and expanding market reach. Market expansion strategies focusing on emerging economies and untapped market segments further accelerate growth. The development of novel closure designs tailored to specific product needs and consumer preferences fuels continued growth.
Key Players Shaping the Plastic Caps and Closures Industry Market
- Aptar Group Inc
- Pact Group
- Ball Corporation
- Global Closure Systems
- Tetra Laval International S A
- Guala Closures Group
- Crown Holdings Inc
- BERICAP GmbH & Co K
- Evergreen Packaging Inc
- Albéa S A
- Berry Global Inc
- Silgan Holdings Inc
- Amcor Ltd
Notable Milestones in Plastic Caps and Closures Industry Sector
- December 2022: Rieke, a TriMas Packaging Brand, launched the IMF-5 In-Mold Flexspout tamper-evident closure for plastic pails, enhancing brand and product security.
- February 2022: BERICAP, a leading closure producer, won the TOP 100 award for innovation in Germany.
In-Depth Plastic Caps and Closures Industry Market Outlook
The future of the plastic caps and closures market is bright, fueled by ongoing technological advancements, increasing demand for sustainable solutions, and the continued expansion of the global packaging industry. Strategic opportunities exist in developing innovative closures for emerging applications, expanding into new geographical markets, and establishing strategic partnerships to accelerate growth. The market is poised for robust growth, driven by both incremental improvements and disruptive innovations in materials and manufacturing.
Plastic Caps and Closures Industry Segmentation
-
1. Application
- 1.1. Food
- 1.2. Pharmaceutical
- 1.3. Beverage
- 1.4. Cosmetics and Toiletries
- 1.5. Other Applications
-
2. Raw Material
- 2.1. PP
- 2.2. HDPE
- 2.3. LDPE
- 2.4. Other Raw Materials
Plastic Caps and Closures Industry Segmentation By Geography
-
1. North America
- 1.1. United States
- 1.2. Canada
-
2. Europe
- 2.1. United Kingdom
- 2.2. Germany
- 2.3. France
- 2.4. Italy
- 2.5. Rest of Europe
-
3. Asia Pacific
- 3.1. China
- 3.2. Japan
- 3.3. India
- 3.4. South Korea
- 3.5. Australia
- 3.6. Rest of Asia Pacific
-
4. Latin America
- 4.1. Brazil
- 4.2. Argentina
- 4.3. Rest of Latin America
- 5. Middle East
-
6. United Arab Emirates
- 6.1. Saudi Arabia
- 6.2. South Africa
- 6.3. Rest of Middle East
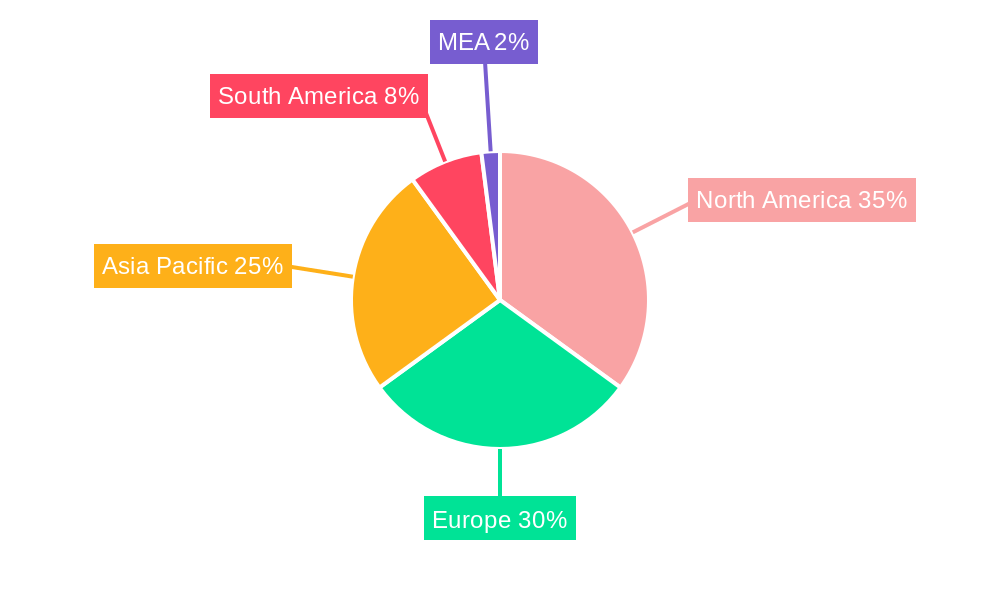
Plastic Caps and Closures Industry Regional Market Share
Geographic Coverage of Plastic Caps and Closures Industry
Plastic Caps and Closures Industry REPORT HIGHLIGHTS
| Aspects | Details |
|---|---|
| Study Period | 2020-2034 |
| Base Year | 2025 |
| Estimated Year | 2026 |
| Forecast Period | 2026-2034 |
| Historical Period | 2020-2025 |
| Growth Rate | CAGR of 3.2% from 2020-2034 |
| Segmentation |
|
Table of Contents
- 1. Introduction
- 1.1. Research Scope
- 1.2. Market Segmentation
- 1.3. Research Objective
- 1.4. Definitions and Assumptions
- 2. Executive Summary
- 2.1. Market Snapshot
- 3. Market Dynamics
- 3.1. Market Drivers
- 3.2. Market Restrains
- 3.3. Market Trends
- 3.4. Market Opportunities
- 4. Market Factor Analysis
- 4.1. Porters Five Forces
- 4.1.1. Bargaining Power of Suppliers
- 4.1.2. Bargaining Power of Buyers
- 4.1.3. Threat of New Entrants
- 4.1.4. Threat of Substitutes
- 4.1.5. Competitive Rivalry
- 4.2. PESTEL analysis
- 4.3. BCG Analysis
- 4.3.1. Stars (High Growth, High Market Share)
- 4.3.2. Cash Cows (Low Growth, High Market Share)
- 4.3.3. Question Mark (High Growth, Low Market Share)
- 4.3.4. Dogs (Low Growth, Low Market Share)
- 4.4. Ansoff Matrix Analysis
- 4.5. Supply Chain Analysis
- 4.6. Regulatory Landscape
- 4.7. Current Market Potential and Opportunity Assessment (TAM–SAM–SOM Framework)
- 4.8. VDR Analyst Note
- 4.1. Porters Five Forces
- 5. Market Analysis, Insights and Forecast 2021-2033
- 5.1. Market Analysis, Insights and Forecast - by Application
- 5.1.1. Food
- 5.1.2. Pharmaceutical
- 5.1.3. Beverage
- 5.1.4. Cosmetics and Toiletries
- 5.1.5. Other Applications
- 5.2. Market Analysis, Insights and Forecast - by Raw Material
- 5.2.1. PP
- 5.2.2. HDPE
- 5.2.3. LDPE
- 5.2.4. Other Raw Materials
- 5.3. Market Analysis, Insights and Forecast - by Region
- 5.3.1. North America
- 5.3.2. Europe
- 5.3.3. Asia Pacific
- 5.3.4. Latin America
- 5.3.5. Middle East
- 5.3.6. United Arab Emirates
- 5.1. Market Analysis, Insights and Forecast - by Application
- 6. Global Plastic Caps and Closures Industry Analysis, Insights and Forecast, 2021-2033
- 6.1. Market Analysis, Insights and Forecast - by Application
- 6.1.1. Food
- 6.1.2. Pharmaceutical
- 6.1.3. Beverage
- 6.1.4. Cosmetics and Toiletries
- 6.1.5. Other Applications
- 6.2. Market Analysis, Insights and Forecast - by Raw Material
- 6.2.1. PP
- 6.2.2. HDPE
- 6.2.3. LDPE
- 6.2.4. Other Raw Materials
- 6.1. Market Analysis, Insights and Forecast - by Application
- 7. North America Plastic Caps and Closures Industry Analysis, Insights and Forecast, 2021-2033
- 7.1. Market Analysis, Insights and Forecast - by Application
- 7.1.1. Food
- 7.1.2. Pharmaceutical
- 7.1.3. Beverage
- 7.1.4. Cosmetics and Toiletries
- 7.1.5. Other Applications
- 7.2. Market Analysis, Insights and Forecast - by Raw Material
- 7.2.1. PP
- 7.2.2. HDPE
- 7.2.3. LDPE
- 7.2.4. Other Raw Materials
- 7.1. Market Analysis, Insights and Forecast - by Application
- 8. Europe Plastic Caps and Closures Industry Analysis, Insights and Forecast, 2021-2033
- 8.1. Market Analysis, Insights and Forecast - by Application
- 8.1.1. Food
- 8.1.2. Pharmaceutical
- 8.1.3. Beverage
- 8.1.4. Cosmetics and Toiletries
- 8.1.5. Other Applications
- 8.2. Market Analysis, Insights and Forecast - by Raw Material
- 8.2.1. PP
- 8.2.2. HDPE
- 8.2.3. LDPE
- 8.2.4. Other Raw Materials
- 8.1. Market Analysis, Insights and Forecast - by Application
- 9. Asia Pacific Plastic Caps and Closures Industry Analysis, Insights and Forecast, 2021-2033
- 9.1. Market Analysis, Insights and Forecast - by Application
- 9.1.1. Food
- 9.1.2. Pharmaceutical
- 9.1.3. Beverage
- 9.1.4. Cosmetics and Toiletries
- 9.1.5. Other Applications
- 9.2. Market Analysis, Insights and Forecast - by Raw Material
- 9.2.1. PP
- 9.2.2. HDPE
- 9.2.3. LDPE
- 9.2.4. Other Raw Materials
- 9.1. Market Analysis, Insights and Forecast - by Application
- 10. Latin America Plastic Caps and Closures Industry Analysis, Insights and Forecast, 2021-2033
- 10.1. Market Analysis, Insights and Forecast - by Application
- 10.1.1. Food
- 10.1.2. Pharmaceutical
- 10.1.3. Beverage
- 10.1.4. Cosmetics and Toiletries
- 10.1.5. Other Applications
- 10.2. Market Analysis, Insights and Forecast - by Raw Material
- 10.2.1. PP
- 10.2.2. HDPE
- 10.2.3. LDPE
- 10.2.4. Other Raw Materials
- 10.1. Market Analysis, Insights and Forecast - by Application
- 11. Middle East Plastic Caps and Closures Industry Analysis, Insights and Forecast, 2021-2033
- 11.1. Market Analysis, Insights and Forecast - by Application
- 11.1.1. Food
- 11.1.2. Pharmaceutical
- 11.1.3. Beverage
- 11.1.4. Cosmetics and Toiletries
- 11.1.5. Other Applications
- 11.2. Market Analysis, Insights and Forecast - by Raw Material
- 11.2.1. PP
- 11.2.2. HDPE
- 11.2.3. LDPE
- 11.2.4. Other Raw Materials
- 11.1. Market Analysis, Insights and Forecast - by Application
- 12. United Arab Emirates Plastic Caps and Closures Industry Analysis, Insights and Forecast, 2021-2033
- 12.1. Market Analysis, Insights and Forecast - by Application
- 12.1.1. Food
- 12.1.2. Pharmaceutical
- 12.1.3. Beverage
- 12.1.4. Cosmetics and Toiletries
- 12.1.5. Other Applications
- 12.2. Market Analysis, Insights and Forecast - by Raw Material
- 12.2.1. PP
- 12.2.2. HDPE
- 12.2.3. LDPE
- 12.2.4. Other Raw Materials
- 12.1. Market Analysis, Insights and Forecast - by Application
- 13. Competitive Analysis
- 13.1. Company Profiles
- 13.1.1 Aptar Group Inc
- 13.1.1.1. Company Overview
- 13.1.1.2. Products
- 13.1.1.3. Company Financials
- 13.1.1.4. SWOT Analysis
- 13.1.2 Pact Group
- 13.1.2.1. Company Overview
- 13.1.2.2. Products
- 13.1.2.3. Company Financials
- 13.1.2.4. SWOT Analysis
- 13.1.3 Ball Corporation
- 13.1.3.1. Company Overview
- 13.1.3.2. Products
- 13.1.3.3. Company Financials
- 13.1.3.4. SWOT Analysis
- 13.1.4 Global Closure Systems
- 13.1.4.1. Company Overview
- 13.1.4.2. Products
- 13.1.4.3. Company Financials
- 13.1.4.4. SWOT Analysis
- 13.1.5 Tetra Laval International S A
- 13.1.5.1. Company Overview
- 13.1.5.2. Products
- 13.1.5.3. Company Financials
- 13.1.5.4. SWOT Analysis
- 13.1.6 Guala Closures Group
- 13.1.6.1. Company Overview
- 13.1.6.2. Products
- 13.1.6.3. Company Financials
- 13.1.6.4. SWOT Analysis
- 13.1.7 Crown Holdings Inc
- 13.1.7.1. Company Overview
- 13.1.7.2. Products
- 13.1.7.3. Company Financials
- 13.1.7.4. SWOT Analysis
- 13.1.8 BERICAP GmbH & Co K
- 13.1.8.1. Company Overview
- 13.1.8.2. Products
- 13.1.8.3. Company Financials
- 13.1.8.4. SWOT Analysis
- 13.1.9 Evergreen Packaging Inc
- 13.1.9.1. Company Overview
- 13.1.9.2. Products
- 13.1.9.3. Company Financials
- 13.1.9.4. SWOT Analysis
- 13.1.10 Albéa S A
- 13.1.10.1. Company Overview
- 13.1.10.2. Products
- 13.1.10.3. Company Financials
- 13.1.10.4. SWOT Analysis
- 13.1.11 Berry Global Inc
- 13.1.11.1. Company Overview
- 13.1.11.2. Products
- 13.1.11.3. Company Financials
- 13.1.11.4. SWOT Analysis
- 13.1.12 Silgan Holdings Inc
- 13.1.12.1. Company Overview
- 13.1.12.2. Products
- 13.1.12.3. Company Financials
- 13.1.12.4. SWOT Analysis
- 13.1.13 Amcor Ltd
- 13.1.13.1. Company Overview
- 13.1.13.2. Products
- 13.1.13.3. Company Financials
- 13.1.13.4. SWOT Analysis
- 13.1.1 Aptar Group Inc
- 13.2. Market Entropy
- 13.2.1 Company's Key Areas Served
- 13.2.2 Recent Developments
- 13.3. Company Market Share Analysis 2025
- 13.3.1 Top 5 Companies Market Share Analysis
- 13.3.2 Top 3 Companies Market Share Analysis
- 13.4. List of Potential Customers
- 14. Research Methodology
List of Figures
- Figure 1: Global Plastic Caps and Closures Industry Revenue Breakdown (billion, %) by Region 2025 & 2033
- Figure 2: North America Plastic Caps and Closures Industry Revenue (billion), by Application 2025 & 2033
- Figure 3: North America Plastic Caps and Closures Industry Revenue Share (%), by Application 2025 & 2033
- Figure 4: North America Plastic Caps and Closures Industry Revenue (billion), by Raw Material 2025 & 2033
- Figure 5: North America Plastic Caps and Closures Industry Revenue Share (%), by Raw Material 2025 & 2033
- Figure 6: North America Plastic Caps and Closures Industry Revenue (billion), by Country 2025 & 2033
- Figure 7: North America Plastic Caps and Closures Industry Revenue Share (%), by Country 2025 & 2033
- Figure 8: Europe Plastic Caps and Closures Industry Revenue (billion), by Application 2025 & 2033
- Figure 9: Europe Plastic Caps and Closures Industry Revenue Share (%), by Application 2025 & 2033
- Figure 10: Europe Plastic Caps and Closures Industry Revenue (billion), by Raw Material 2025 & 2033
- Figure 11: Europe Plastic Caps and Closures Industry Revenue Share (%), by Raw Material 2025 & 2033
- Figure 12: Europe Plastic Caps and Closures Industry Revenue (billion), by Country 2025 & 2033
- Figure 13: Europe Plastic Caps and Closures Industry Revenue Share (%), by Country 2025 & 2033
- Figure 14: Asia Pacific Plastic Caps and Closures Industry Revenue (billion), by Application 2025 & 2033
- Figure 15: Asia Pacific Plastic Caps and Closures Industry Revenue Share (%), by Application 2025 & 2033
- Figure 16: Asia Pacific Plastic Caps and Closures Industry Revenue (billion), by Raw Material 2025 & 2033
- Figure 17: Asia Pacific Plastic Caps and Closures Industry Revenue Share (%), by Raw Material 2025 & 2033
- Figure 18: Asia Pacific Plastic Caps and Closures Industry Revenue (billion), by Country 2025 & 2033
- Figure 19: Asia Pacific Plastic Caps and Closures Industry Revenue Share (%), by Country 2025 & 2033
- Figure 20: Latin America Plastic Caps and Closures Industry Revenue (billion), by Application 2025 & 2033
- Figure 21: Latin America Plastic Caps and Closures Industry Revenue Share (%), by Application 2025 & 2033
- Figure 22: Latin America Plastic Caps and Closures Industry Revenue (billion), by Raw Material 2025 & 2033
- Figure 23: Latin America Plastic Caps and Closures Industry Revenue Share (%), by Raw Material 2025 & 2033
- Figure 24: Latin America Plastic Caps and Closures Industry Revenue (billion), by Country 2025 & 2033
- Figure 25: Latin America Plastic Caps and Closures Industry Revenue Share (%), by Country 2025 & 2033
- Figure 26: Middle East Plastic Caps and Closures Industry Revenue (billion), by Application 2025 & 2033
- Figure 27: Middle East Plastic Caps and Closures Industry Revenue Share (%), by Application 2025 & 2033
- Figure 28: Middle East Plastic Caps and Closures Industry Revenue (billion), by Raw Material 2025 & 2033
- Figure 29: Middle East Plastic Caps and Closures Industry Revenue Share (%), by Raw Material 2025 & 2033
- Figure 30: Middle East Plastic Caps and Closures Industry Revenue (billion), by Country 2025 & 2033
- Figure 31: Middle East Plastic Caps and Closures Industry Revenue Share (%), by Country 2025 & 2033
- Figure 32: United Arab Emirates Plastic Caps and Closures Industry Revenue (billion), by Application 2025 & 2033
- Figure 33: United Arab Emirates Plastic Caps and Closures Industry Revenue Share (%), by Application 2025 & 2033
- Figure 34: United Arab Emirates Plastic Caps and Closures Industry Revenue (billion), by Raw Material 2025 & 2033
- Figure 35: United Arab Emirates Plastic Caps and Closures Industry Revenue Share (%), by Raw Material 2025 & 2033
- Figure 36: United Arab Emirates Plastic Caps and Closures Industry Revenue (billion), by Country 2025 & 2033
- Figure 37: United Arab Emirates Plastic Caps and Closures Industry Revenue Share (%), by Country 2025 & 2033
List of Tables
- Table 1: Global Plastic Caps and Closures Industry Revenue billion Forecast, by Application 2020 & 2033
- Table 2: Global Plastic Caps and Closures Industry Revenue billion Forecast, by Raw Material 2020 & 2033
- Table 3: Global Plastic Caps and Closures Industry Revenue billion Forecast, by Region 2020 & 2033
- Table 4: Global Plastic Caps and Closures Industry Revenue billion Forecast, by Application 2020 & 2033
- Table 5: Global Plastic Caps and Closures Industry Revenue billion Forecast, by Raw Material 2020 & 2033
- Table 6: Global Plastic Caps and Closures Industry Revenue billion Forecast, by Country 2020 & 2033
- Table 7: United States Plastic Caps and Closures Industry Revenue (billion) Forecast, by Application 2020 & 2033
- Table 8: Canada Plastic Caps and Closures Industry Revenue (billion) Forecast, by Application 2020 & 2033
- Table 9: Global Plastic Caps and Closures Industry Revenue billion Forecast, by Application 2020 & 2033
- Table 10: Global Plastic Caps and Closures Industry Revenue billion Forecast, by Raw Material 2020 & 2033
- Table 11: Global Plastic Caps and Closures Industry Revenue billion Forecast, by Country 2020 & 2033
- Table 12: United Kingdom Plastic Caps and Closures Industry Revenue (billion) Forecast, by Application 2020 & 2033
- Table 13: Germany Plastic Caps and Closures Industry Revenue (billion) Forecast, by Application 2020 & 2033
- Table 14: France Plastic Caps and Closures Industry Revenue (billion) Forecast, by Application 2020 & 2033
- Table 15: Italy Plastic Caps and Closures Industry Revenue (billion) Forecast, by Application 2020 & 2033
- Table 16: Rest of Europe Plastic Caps and Closures Industry Revenue (billion) Forecast, by Application 2020 & 2033
- Table 17: Global Plastic Caps and Closures Industry Revenue billion Forecast, by Application 2020 & 2033
- Table 18: Global Plastic Caps and Closures Industry Revenue billion Forecast, by Raw Material 2020 & 2033
- Table 19: Global Plastic Caps and Closures Industry Revenue billion Forecast, by Country 2020 & 2033
- Table 20: China Plastic Caps and Closures Industry Revenue (billion) Forecast, by Application 2020 & 2033
- Table 21: Japan Plastic Caps and Closures Industry Revenue (billion) Forecast, by Application 2020 & 2033
- Table 22: India Plastic Caps and Closures Industry Revenue (billion) Forecast, by Application 2020 & 2033
- Table 23: South Korea Plastic Caps and Closures Industry Revenue (billion) Forecast, by Application 2020 & 2033
- Table 24: Australia Plastic Caps and Closures Industry Revenue (billion) Forecast, by Application 2020 & 2033
- Table 25: Rest of Asia Pacific Plastic Caps and Closures Industry Revenue (billion) Forecast, by Application 2020 & 2033
- Table 26: Global Plastic Caps and Closures Industry Revenue billion Forecast, by Application 2020 & 2033
- Table 27: Global Plastic Caps and Closures Industry Revenue billion Forecast, by Raw Material 2020 & 2033
- Table 28: Global Plastic Caps and Closures Industry Revenue billion Forecast, by Country 2020 & 2033
- Table 29: Brazil Plastic Caps and Closures Industry Revenue (billion) Forecast, by Application 2020 & 2033
- Table 30: Argentina Plastic Caps and Closures Industry Revenue (billion) Forecast, by Application 2020 & 2033
- Table 31: Rest of Latin America Plastic Caps and Closures Industry Revenue (billion) Forecast, by Application 2020 & 2033
- Table 32: Global Plastic Caps and Closures Industry Revenue billion Forecast, by Application 2020 & 2033
- Table 33: Global Plastic Caps and Closures Industry Revenue billion Forecast, by Raw Material 2020 & 2033
- Table 34: Global Plastic Caps and Closures Industry Revenue billion Forecast, by Country 2020 & 2033
- Table 35: Global Plastic Caps and Closures Industry Revenue billion Forecast, by Application 2020 & 2033
- Table 36: Global Plastic Caps and Closures Industry Revenue billion Forecast, by Raw Material 2020 & 2033
- Table 37: Global Plastic Caps and Closures Industry Revenue billion Forecast, by Country 2020 & 2033
- Table 38: Saudi Arabia Plastic Caps and Closures Industry Revenue (billion) Forecast, by Application 2020 & 2033
- Table 39: South Africa Plastic Caps and Closures Industry Revenue (billion) Forecast, by Application 2020 & 2033
- Table 40: Rest of Middle East Plastic Caps and Closures Industry Revenue (billion) Forecast, by Application 2020 & 2033
Frequently Asked Questions
1. What is the projected Compound Annual Growth Rate (CAGR) of the Plastic Caps and Closures Industry?
The projected CAGR is approximately 3.2%.
2. Which companies are prominent players in the Plastic Caps and Closures Industry?
Key companies in the market include Aptar Group Inc, Pact Group, Ball Corporation, Global Closure Systems, Tetra Laval International S A, Guala Closures Group, Crown Holdings Inc, BERICAP GmbH & Co K, Evergreen Packaging Inc, Albéa S A, Berry Global Inc, Silgan Holdings Inc, Amcor Ltd.
3. What are the main segments of the Plastic Caps and Closures Industry?
The market segments include Application, Raw Material.
4. Can you provide details about the market size?
The market size is estimated to be USD 53.73 billion as of 2022.
5. What are some drivers contributing to market growth?
Demand for Packaged Food and Pharmaceutical Drugs; Increasing Demand from Small and Medium Scale End-user Industries.
6. What are the notable trends driving market growth?
Polypropylene Material to Account for a Significant Share.
7. Are there any restraints impacting market growth?
Lightweight and Cost-effective Stand-up Pouch Packaging Alternatives.
8. Can you provide examples of recent developments in the market?
December 2022 - The IMF-5 In-Mold Flexspout tamper-evident closure for plastic pails was just introduced by Rieke, a TriMas Packaging Brand, to give its customers better brand and product security. Product piracy and counterfeiting are the main issues facing the increasingly interconnected global economy.
9. What pricing options are available for accessing the report?
Pricing options include single-user, multi-user, and enterprise licenses priced at USD 4750, USD 5250, and USD 8750 respectively.
10. Is the market size provided in terms of value or volume?
The market size is provided in terms of value, measured in billion.
11. Are there any specific market keywords associated with the report?
Yes, the market keyword associated with the report is "Plastic Caps and Closures Industry," which aids in identifying and referencing the specific market segment covered.
12. How do I determine which pricing option suits my needs best?
The pricing options vary based on user requirements and access needs. Individual users may opt for single-user licenses, while businesses requiring broader access may choose multi-user or enterprise licenses for cost-effective access to the report.
13. Are there any additional resources or data provided in the Plastic Caps and Closures Industry report?
While the report offers comprehensive insights, it's advisable to review the specific contents or supplementary materials provided to ascertain if additional resources or data are available.
14. How can I stay updated on further developments or reports in the Plastic Caps and Closures Industry?
To stay informed about further developments, trends, and reports in the Plastic Caps and Closures Industry, consider subscribing to industry newsletters, following relevant companies and organizations, or regularly checking reputable industry news sources and publications.
Methodology
Step 1 - Identification of Relevant Samples Size from Population Database


Step 2 - Approaches for Defining Global Market Size (Value, Volume* & Price*)

Note*: In applicable scenarios
Step 3 - Data Sources
Primary Research
- Web Analytics
- Survey Reports
- Research Institute
- Latest Research Reports
- Opinion Leaders
Secondary Research
- Annual Reports
- White Paper
- Latest Press Release
- Industry Association
- Paid Database
- Investor Presentations

Step 4 - Data Triangulation
Involves using different sources of information in order to increase the validity of a study
These sources are likely to be stakeholders in a program - participants, other researchers, program staff, other community members, and so on.
Then we put all data in single framework & apply various statistical tools to find out the dynamic on the market.
During the analysis stage, feedback from the stakeholder groups would be compared to determine areas of agreement as well as areas of divergence