

Key Insights
The global photographic equipment market is projected for substantial growth, forecast to reach $6.5 billion by 2025, with a Compound Annual Growth Rate (CAGR) of 7.1% from 2025 to 2033. This expansion is propelled by the rising popularity of photography as both a hobby and profession. Increased accessibility to advanced smartphone cameras paradoxically fuels demand for professional-grade equipment as consumers seek superior image quality, creative control, and specialized functionalities. Key drivers include technological advancements in sensor technology, autofocus systems, and image stabilization. The market is segmented by distribution channels (online and offline retail) and product type (cameras, lenses, and accessories). Online retail channels are expanding rapidly due to convenience, while offline stores offer vital hands-on experience. Evolving consumer preferences, including a growing interest in mirrorless cameras and innovative accessories, also contribute to market dynamics.
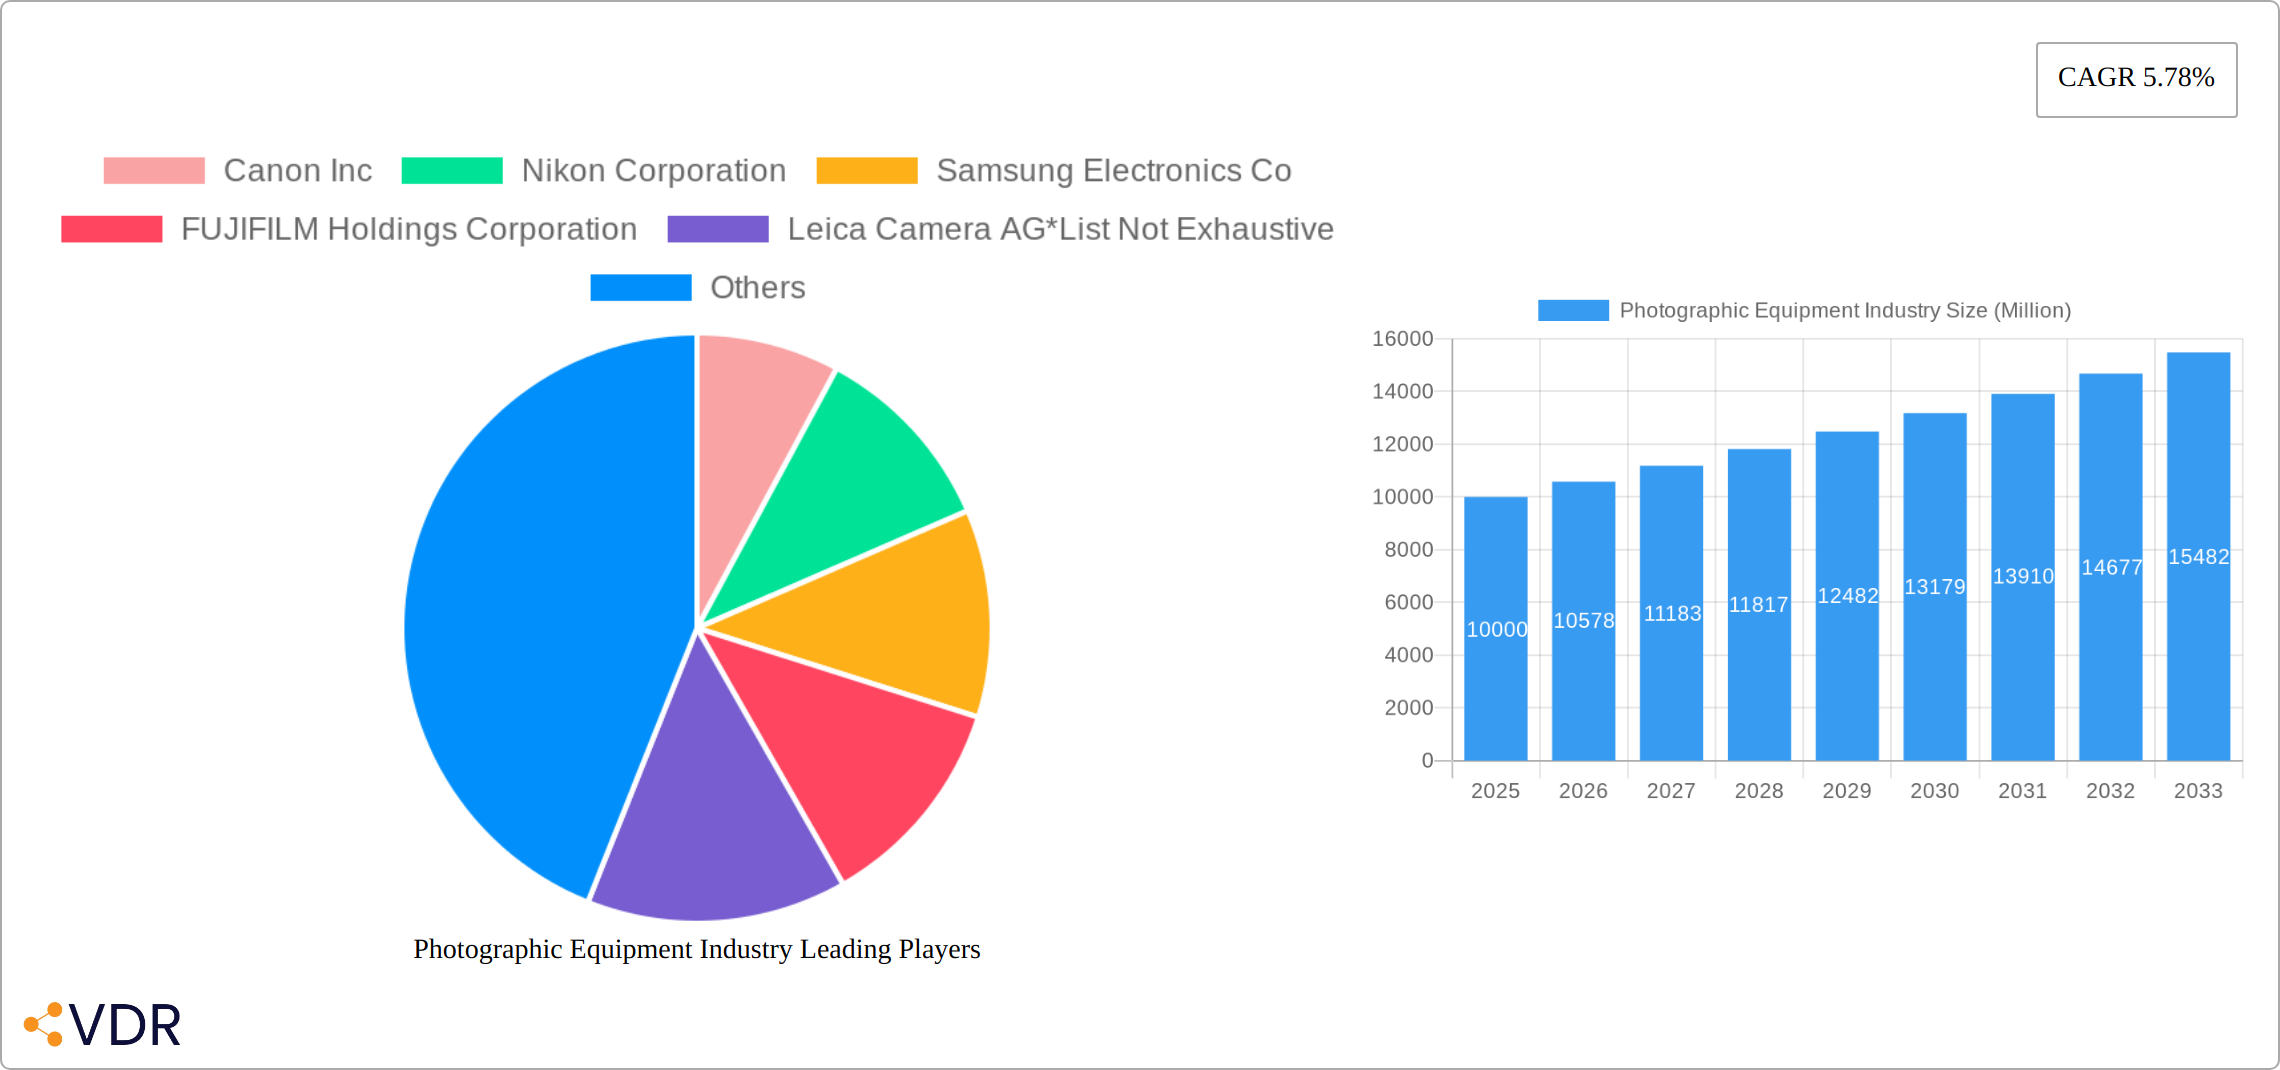
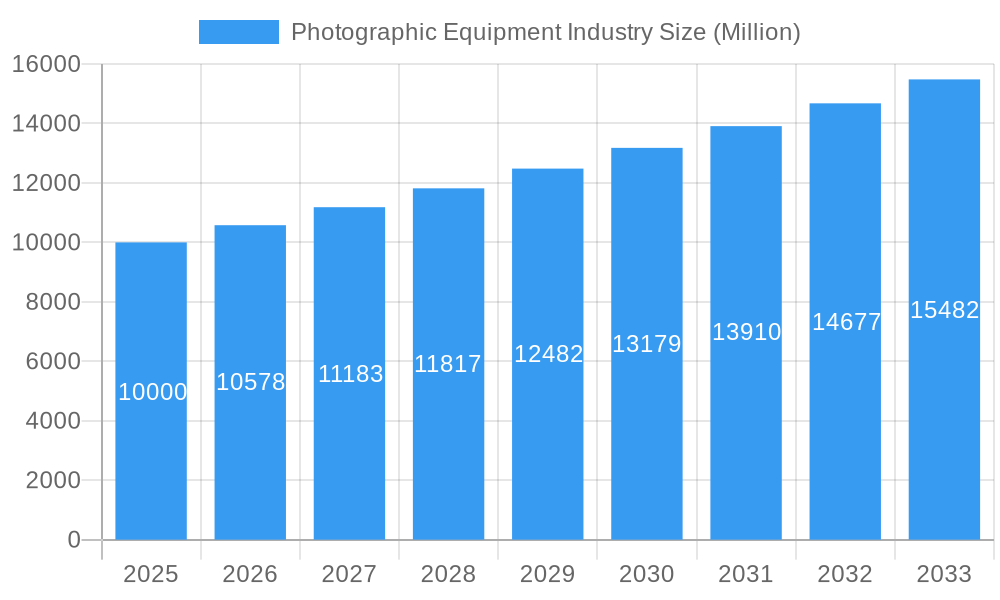
Photographic Equipment Industry Market Size (In Billion)
Market growth is tempered by the high cost of professional equipment, impacting accessibility, particularly in developing economies. The increasing capabilities of smartphone cameras present a challenge to the entry-level camera segment. Nevertheless, consistent market growth is anticipated, driven by the demand for professional image quality, ongoing technological innovation, and the flourishing professional photography industry. North America and Asia Pacific are expected to lead market expansion, supported by higher disposable incomes and established photography cultures. Diversification of product offerings, such as specialized lenses for niche applications, will further stimulate future growth.
Photographic Equipment Industry Company Market Share
Photographic Equipment Industry Market Report: 2019-2033
This comprehensive report provides a detailed analysis of the photographic equipment industry, encompassing market dynamics, growth trends, key players, and future outlook. With a study period spanning 2019-2033, a base year of 2025, and a forecast period of 2025-2033, this report offers invaluable insights for industry professionals, investors, and strategic decision-makers. The report analyzes the parent market (Consumer Electronics) and child market (Photography Equipment) to provide a holistic view. The market size is estimated in million units.
Photographic Equipment Industry Market Dynamics & Structure
The photographic equipment market is characterized by moderate concentration, with a few major players holding significant market share. Technological innovation, particularly in sensor technology, image processing, and lens design, is a key driver. Regulatory frameworks concerning product safety and environmental impact also play a role. The market faces competition from smartphone cameras, which offer convenience and accessibility. End-user demographics are diverse, ranging from professional photographers to amateur enthusiasts. Mergers and acquisitions (M&A) activity has been moderate, with strategic acquisitions aimed at expanding product portfolios or technological capabilities.
- Market Concentration: Canon, Nikon, and Sony collectively hold approximately xx% of the global market share in 2025 (estimated).
- Technological Innovation: Significant advancements in sensor resolution, autofocus systems, and image stabilization are driving market growth.
- Regulatory Landscape: Compliance with safety and environmental regulations impacts production costs and market entry.
- Competitive Substitutes: Smartphone cameras pose a significant challenge due to their convenience and integration with other functionalities.
- End-User Demographics: The market caters to professionals, amateurs, and hobbyists, each with distinct needs and purchasing power.
- M&A Activity: The number of M&A deals in the industry averaged xx per year during the historical period (2019-2024).
Photographic Equipment Industry Growth Trends & Insights
The photographic equipment market demonstrated moderate growth from 2019 to 2024, but is poised for a significant resurgence. This revitalization is fueled by several key factors: the burgeoning popularity of photography as a hobby, continuous advancements in mirrorless camera technology, and the escalating demand for high-quality images across diverse professional and personal applications. The market is witnessing a dramatic shift, with mirrorless cameras experiencing rapid adoption rates while the DSLR market shows a gradual decline. This trend is significantly driven by evolving consumer behavior, particularly the desire to capture and share high-quality images and videos on social media platforms.
- Market Size Evolution: The global market, valued at approximately $XX billion in 2024, is projected to reach $YY billion by 2033. (Replace XX and YY with actual figures)
- CAGR (2025-2033): The market is anticipated to exhibit a compound annual growth rate (CAGR) of XX% during the forecast period. (Replace XX with actual figure)
- Market Penetration: Mirrorless cameras are expected to achieve an XX% market share of the overall camera market by 2033. (Replace XX with actual figure). This represents a substantial increase from the current market share.
Dominant Regions, Countries, or Segments in Photographic Equipment Industry
North America and Asia-Pacific are the dominant regions in the photographic equipment market. Within these regions, specific countries such as the United States, Japan, and China stand out due to high consumer demand, strong manufacturing bases, and significant investments in the photographic industry. The Online Retail channel is exhibiting faster growth compared to Offline Retail, fueled by increasing e-commerce penetration and convenience. Within Product Types, cameras still represent the largest segment, followed by lenses and other accessories.
- Key Drivers (North America): High disposable incomes, a strong photography enthusiast community, and robust e-commerce infrastructure.
- Key Drivers (Asia-Pacific): Rapid economic growth, increasing middle class, and rising demand for high-quality imagery in various applications.
- Dominant Segment (Distribution Channel): Online retail is experiencing faster growth due to wider reach and competitive pricing.
- Dominant Segment (Product Type): Cameras hold the largest market share, driven by both professional and consumer demand.
Photographic Equipment Industry Product Landscape
The photographic equipment market offers a diverse range of products, including DSLRs, mirrorless cameras, lenses (prime and zoom), tripods, flashes, and other accessories. Recent innovations focus on improved autofocus systems, enhanced sensor technology, and more compact and lightweight designs. Unique selling propositions often center around image quality, ease of use, and specialized features catering to specific photographic genres. The market is witnessing a shift toward mirrorless cameras due to their advanced features and compact size.
Key Drivers, Barriers & Challenges in Photographic Equipment Industry
Key Drivers: The industry is propelled forward by several key factors: rapid technological advancements in sensor technology and AI-powered features, the growing adoption of photography as a leisure activity and creative outlet, the ever-expanding reach of social media, and the persistent need for superior image quality across a wide spectrum of professional applications, including journalism, advertising, and scientific research.
Challenges: Despite the positive outlook, the industry faces significant headwinds. Intense competition from the increasingly sophisticated camera capabilities of smartphones poses a major challenge. Furthermore, rising production costs, supply chain disruptions (with the 2022 disruptions estimated to reduce market growth by approximately XX%), and the constant pressure to innovate and remain competitive represent ongoing obstacles.
Emerging Opportunities in Photographic Equipment Industry
Significant growth opportunities exist within specialized camera segments, such as drone cameras and action cameras, catering to niche markets and specific applications. The integration of AI and machine learning capabilities for advanced image processing and automated features offers a pathway for enhanced user experience and higher quality outputs. Expansion into untapped markets within developing economies, where increasing disposable incomes are fueling demand for consumer electronics, presents another significant avenue for growth. Finally, the demand for cameras with superior video capabilities is a major driver of innovation and market expansion.
Growth Accelerators in the Photographic Equipment Industry
Strategic collaborations between camera manufacturers and software developers are proving crucial in driving innovation and expanding functionalities. Significant technological leaps, such as advancements in in-body image stabilization and the development of increasingly high-resolution sensors, are further accelerating market growth. The expanding middle class in several emerging markets represents a large pool of potential consumers, presenting substantial growth potential for manufacturers.
Key Players Shaping the Photographic Equipment Industry Market
- Canon Inc
- Nikon Corporation
- Samsung Electronics Co
- FUJIFILM Holdings Corporation
- Leica Camera AG
- Panasonic Corporation
- Sony Corporation
Notable Milestones in Photographic Equipment Industry Sector
- 2020: Canon's launch of the EOS R5, a groundbreaking high-resolution mirrorless camera with advanced video capabilities, marked a significant step forward in camera technology.
- 2021: Nikon's introduction of the Z9, a high-speed professional mirrorless camera designed for demanding professional applications, further solidified the shift towards mirrorless technology.
- 2022: Sony's announcement of new high-resolution lenses optimized for its mirrorless system expanded the capabilities and appeal of its mirrorless camera ecosystem.
- [Add more recent milestones here] Include any significant product launches, technological breakthroughs, or market-shifting events from 2023 and beyond.
In-Depth Photographic Equipment Industry Market Outlook
The photographic equipment market is poised for continued growth, driven by ongoing technological advancements and the increasing popularity of photography. Strategic partnerships, focus on innovative features, and expansion into new markets will be crucial for success in this dynamic sector. The future potential rests in the integration of AI, VR and AR technologies to create immersive photography experiences.
Photographic Equipment Industry Segmentation
-
1. Product Type
- 1.1. Camera
- 1.2. Lens
- 1.3. Others
-
2. Distribution Channel
- 2.1. Online Retail
- 2.2. Offline Retail
Photographic Equipment Industry Segmentation By Geography
-
1. North America
- 1.1. United States
- 1.2. Canada
- 1.3. Mexico
- 1.4. Rest of North America
-
2. Europe
- 2.1. United Kingdom
- 2.2. Germany
- 2.3. France
- 2.4. Italy
- 2.5. Russia
- 2.6. Rest of Europe
-
3. Asia Pacific
- 3.1. China
- 3.2. Japan
- 3.3. India
- 3.4. Australia
- 3.5. Rest of Asia Pacific
-
4. South America
- 4.1. Brazil
- 4.2. Argentina
- 4.3. Rest of South America
-
5. Middle East and Africa
- 5.1. South Africa
- 5.2. Saudi Arabia
- 5.3. Rest of Middle East and Africa
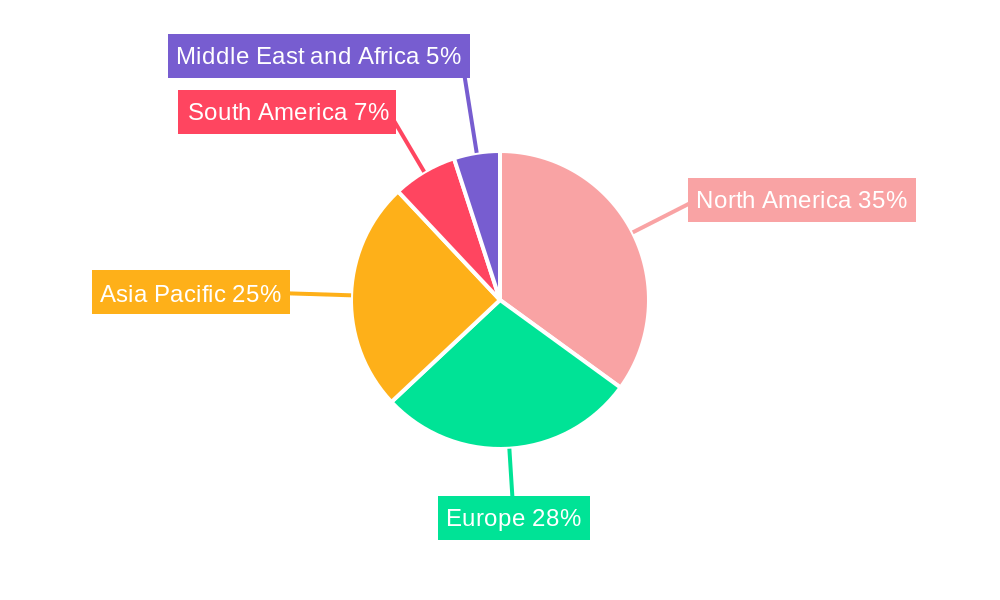
Photographic Equipment Industry Regional Market Share
Geographic Coverage of Photographic Equipment Industry
Photographic Equipment Industry REPORT HIGHLIGHTS
| Aspects | Details |
|---|---|
| Study Period | 2020-2034 |
| Base Year | 2025 |
| Estimated Year | 2026 |
| Forecast Period | 2026-2034 |
| Historical Period | 2020-2025 |
| Growth Rate | CAGR of 7.1% from 2020-2034 |
| Segmentation |
|
Table of Contents
- 1. Introduction
- 1.1. Research Scope
- 1.2. Market Segmentation
- 1.3. Research Objective
- 1.4. Definitions and Assumptions
- 2. Executive Summary
- 2.1. Market Snapshot
- 3. Market Dynamics
- 3.1. Market Drivers
- 3.2. Market Restrains
- 3.3. Market Trends
- 3.4. Market Opportunities
- 4. Market Factor Analysis
- 4.1. Porters Five Forces
- 4.1.1. Bargaining Power of Suppliers
- 4.1.2. Bargaining Power of Buyers
- 4.1.3. Threat of New Entrants
- 4.1.4. Threat of Substitutes
- 4.1.5. Competitive Rivalry
- 4.2. PESTEL analysis
- 4.3. BCG Analysis
- 4.3.1. Stars (High Growth, High Market Share)
- 4.3.2. Cash Cows (Low Growth, High Market Share)
- 4.3.3. Question Mark (High Growth, Low Market Share)
- 4.3.4. Dogs (Low Growth, Low Market Share)
- 4.4. Ansoff Matrix Analysis
- 4.5. Supply Chain Analysis
- 4.6. Regulatory Landscape
- 4.7. Current Market Potential and Opportunity Assessment (TAM–SAM–SOM Framework)
- 4.8. VDR Analyst Note
- 4.1. Porters Five Forces
- 5. Market Analysis, Insights and Forecast 2021-2033
- 5.1. Market Analysis, Insights and Forecast - by Product Type
- 5.1.1. Camera
- 5.1.2. Lens
- 5.1.3. Others
- 5.2. Market Analysis, Insights and Forecast - by Distribution Channel
- 5.2.1. Online Retail
- 5.2.2. Offline Retail
- 5.3. Market Analysis, Insights and Forecast - by Region
- 5.3.1. North America
- 5.3.2. Europe
- 5.3.3. Asia Pacific
- 5.3.4. South America
- 5.3.5. Middle East and Africa
- 5.1. Market Analysis, Insights and Forecast - by Product Type
- 6. Global Photographic Equipment Industry Analysis, Insights and Forecast, 2021-2033
- 6.1. Market Analysis, Insights and Forecast - by Product Type
- 6.1.1. Camera
- 6.1.2. Lens
- 6.1.3. Others
- 6.2. Market Analysis, Insights and Forecast - by Distribution Channel
- 6.2.1. Online Retail
- 6.2.2. Offline Retail
- 6.1. Market Analysis, Insights and Forecast - by Product Type
- 7. North America Photographic Equipment Industry Analysis, Insights and Forecast, 2021-2033
- 7.1. Market Analysis, Insights and Forecast - by Product Type
- 7.1.1. Camera
- 7.1.2. Lens
- 7.1.3. Others
- 7.2. Market Analysis, Insights and Forecast - by Distribution Channel
- 7.2.1. Online Retail
- 7.2.2. Offline Retail
- 7.1. Market Analysis, Insights and Forecast - by Product Type
- 8. Europe Photographic Equipment Industry Analysis, Insights and Forecast, 2021-2033
- 8.1. Market Analysis, Insights and Forecast - by Product Type
- 8.1.1. Camera
- 8.1.2. Lens
- 8.1.3. Others
- 8.2. Market Analysis, Insights and Forecast - by Distribution Channel
- 8.2.1. Online Retail
- 8.2.2. Offline Retail
- 8.1. Market Analysis, Insights and Forecast - by Product Type
- 9. Asia Pacific Photographic Equipment Industry Analysis, Insights and Forecast, 2021-2033
- 9.1. Market Analysis, Insights and Forecast - by Product Type
- 9.1.1. Camera
- 9.1.2. Lens
- 9.1.3. Others
- 9.2. Market Analysis, Insights and Forecast - by Distribution Channel
- 9.2.1. Online Retail
- 9.2.2. Offline Retail
- 9.1. Market Analysis, Insights and Forecast - by Product Type
- 10. South America Photographic Equipment Industry Analysis, Insights and Forecast, 2021-2033
- 10.1. Market Analysis, Insights and Forecast - by Product Type
- 10.1.1. Camera
- 10.1.2. Lens
- 10.1.3. Others
- 10.2. Market Analysis, Insights and Forecast - by Distribution Channel
- 10.2.1. Online Retail
- 10.2.2. Offline Retail
- 10.1. Market Analysis, Insights and Forecast - by Product Type
- 11. Middle East and Africa Photographic Equipment Industry Analysis, Insights and Forecast, 2021-2033
- 11.1. Market Analysis, Insights and Forecast - by Product Type
- 11.1.1. Camera
- 11.1.2. Lens
- 11.1.3. Others
- 11.2. Market Analysis, Insights and Forecast - by Distribution Channel
- 11.2.1. Online Retail
- 11.2.2. Offline Retail
- 11.1. Market Analysis, Insights and Forecast - by Product Type
- 12. Competitive Analysis
- 12.1. Company Profiles
- 12.1.1 Canon Inc
- 12.1.1.1. Company Overview
- 12.1.1.2. Products
- 12.1.1.3. Company Financials
- 12.1.1.4. SWOT Analysis
- 12.1.2 Nikon Corporation
- 12.1.2.1. Company Overview
- 12.1.2.2. Products
- 12.1.2.3. Company Financials
- 12.1.2.4. SWOT Analysis
- 12.1.3 Samsung Electronics Co
- 12.1.3.1. Company Overview
- 12.1.3.2. Products
- 12.1.3.3. Company Financials
- 12.1.3.4. SWOT Analysis
- 12.1.4 FUJIFILM Holdings Corporation
- 12.1.4.1. Company Overview
- 12.1.4.2. Products
- 12.1.4.3. Company Financials
- 12.1.4.4. SWOT Analysis
- 12.1.5 Leica Camera AG*List Not Exhaustive
- 12.1.5.1. Company Overview
- 12.1.5.2. Products
- 12.1.5.3. Company Financials
- 12.1.5.4. SWOT Analysis
- 12.1.6 Panasonic Corporation
- 12.1.6.1. Company Overview
- 12.1.6.2. Products
- 12.1.6.3. Company Financials
- 12.1.6.4. SWOT Analysis
- 12.1.7 Sony Corporation
- 12.1.7.1. Company Overview
- 12.1.7.2. Products
- 12.1.7.3. Company Financials
- 12.1.7.4. SWOT Analysis
- 12.1.1 Canon Inc
- 12.2. Market Entropy
- 12.2.1 Company's Key Areas Served
- 12.2.2 Recent Developments
- 12.3. Company Market Share Analysis 2025
- 12.3.1 Top 5 Companies Market Share Analysis
- 12.3.2 Top 3 Companies Market Share Analysis
- 12.4. List of Potential Customers
- 13. Research Methodology
List of Figures
- Figure 1: Global Photographic Equipment Industry Revenue Breakdown (billion, %) by Region 2025 & 2033
- Figure 2: Global Photographic Equipment Industry Volume Breakdown (K Units, %) by Region 2025 & 2033
- Figure 3: North America Photographic Equipment Industry Revenue (billion), by Product Type 2025 & 2033
- Figure 4: North America Photographic Equipment Industry Volume (K Units), by Product Type 2025 & 2033
- Figure 5: North America Photographic Equipment Industry Revenue Share (%), by Product Type 2025 & 2033
- Figure 6: North America Photographic Equipment Industry Volume Share (%), by Product Type 2025 & 2033
- Figure 7: North America Photographic Equipment Industry Revenue (billion), by Distribution Channel 2025 & 2033
- Figure 8: North America Photographic Equipment Industry Volume (K Units), by Distribution Channel 2025 & 2033
- Figure 9: North America Photographic Equipment Industry Revenue Share (%), by Distribution Channel 2025 & 2033
- Figure 10: North America Photographic Equipment Industry Volume Share (%), by Distribution Channel 2025 & 2033
- Figure 11: North America Photographic Equipment Industry Revenue (billion), by Country 2025 & 2033
- Figure 12: North America Photographic Equipment Industry Volume (K Units), by Country 2025 & 2033
- Figure 13: North America Photographic Equipment Industry Revenue Share (%), by Country 2025 & 2033
- Figure 14: North America Photographic Equipment Industry Volume Share (%), by Country 2025 & 2033
- Figure 15: Europe Photographic Equipment Industry Revenue (billion), by Product Type 2025 & 2033
- Figure 16: Europe Photographic Equipment Industry Volume (K Units), by Product Type 2025 & 2033
- Figure 17: Europe Photographic Equipment Industry Revenue Share (%), by Product Type 2025 & 2033
- Figure 18: Europe Photographic Equipment Industry Volume Share (%), by Product Type 2025 & 2033
- Figure 19: Europe Photographic Equipment Industry Revenue (billion), by Distribution Channel 2025 & 2033
- Figure 20: Europe Photographic Equipment Industry Volume (K Units), by Distribution Channel 2025 & 2033
- Figure 21: Europe Photographic Equipment Industry Revenue Share (%), by Distribution Channel 2025 & 2033
- Figure 22: Europe Photographic Equipment Industry Volume Share (%), by Distribution Channel 2025 & 2033
- Figure 23: Europe Photographic Equipment Industry Revenue (billion), by Country 2025 & 2033
- Figure 24: Europe Photographic Equipment Industry Volume (K Units), by Country 2025 & 2033
- Figure 25: Europe Photographic Equipment Industry Revenue Share (%), by Country 2025 & 2033
- Figure 26: Europe Photographic Equipment Industry Volume Share (%), by Country 2025 & 2033
- Figure 27: Asia Pacific Photographic Equipment Industry Revenue (billion), by Product Type 2025 & 2033
- Figure 28: Asia Pacific Photographic Equipment Industry Volume (K Units), by Product Type 2025 & 2033
- Figure 29: Asia Pacific Photographic Equipment Industry Revenue Share (%), by Product Type 2025 & 2033
- Figure 30: Asia Pacific Photographic Equipment Industry Volume Share (%), by Product Type 2025 & 2033
- Figure 31: Asia Pacific Photographic Equipment Industry Revenue (billion), by Distribution Channel 2025 & 2033
- Figure 32: Asia Pacific Photographic Equipment Industry Volume (K Units), by Distribution Channel 2025 & 2033
- Figure 33: Asia Pacific Photographic Equipment Industry Revenue Share (%), by Distribution Channel 2025 & 2033
- Figure 34: Asia Pacific Photographic Equipment Industry Volume Share (%), by Distribution Channel 2025 & 2033
- Figure 35: Asia Pacific Photographic Equipment Industry Revenue (billion), by Country 2025 & 2033
- Figure 36: Asia Pacific Photographic Equipment Industry Volume (K Units), by Country 2025 & 2033
- Figure 37: Asia Pacific Photographic Equipment Industry Revenue Share (%), by Country 2025 & 2033
- Figure 38: Asia Pacific Photographic Equipment Industry Volume Share (%), by Country 2025 & 2033
- Figure 39: South America Photographic Equipment Industry Revenue (billion), by Product Type 2025 & 2033
- Figure 40: South America Photographic Equipment Industry Volume (K Units), by Product Type 2025 & 2033
- Figure 41: South America Photographic Equipment Industry Revenue Share (%), by Product Type 2025 & 2033
- Figure 42: South America Photographic Equipment Industry Volume Share (%), by Product Type 2025 & 2033
- Figure 43: South America Photographic Equipment Industry Revenue (billion), by Distribution Channel 2025 & 2033
- Figure 44: South America Photographic Equipment Industry Volume (K Units), by Distribution Channel 2025 & 2033
- Figure 45: South America Photographic Equipment Industry Revenue Share (%), by Distribution Channel 2025 & 2033
- Figure 46: South America Photographic Equipment Industry Volume Share (%), by Distribution Channel 2025 & 2033
- Figure 47: South America Photographic Equipment Industry Revenue (billion), by Country 2025 & 2033
- Figure 48: South America Photographic Equipment Industry Volume (K Units), by Country 2025 & 2033
- Figure 49: South America Photographic Equipment Industry Revenue Share (%), by Country 2025 & 2033
- Figure 50: South America Photographic Equipment Industry Volume Share (%), by Country 2025 & 2033
- Figure 51: Middle East and Africa Photographic Equipment Industry Revenue (billion), by Product Type 2025 & 2033
- Figure 52: Middle East and Africa Photographic Equipment Industry Volume (K Units), by Product Type 2025 & 2033
- Figure 53: Middle East and Africa Photographic Equipment Industry Revenue Share (%), by Product Type 2025 & 2033
- Figure 54: Middle East and Africa Photographic Equipment Industry Volume Share (%), by Product Type 2025 & 2033
- Figure 55: Middle East and Africa Photographic Equipment Industry Revenue (billion), by Distribution Channel 2025 & 2033
- Figure 56: Middle East and Africa Photographic Equipment Industry Volume (K Units), by Distribution Channel 2025 & 2033
- Figure 57: Middle East and Africa Photographic Equipment Industry Revenue Share (%), by Distribution Channel 2025 & 2033
- Figure 58: Middle East and Africa Photographic Equipment Industry Volume Share (%), by Distribution Channel 2025 & 2033
- Figure 59: Middle East and Africa Photographic Equipment Industry Revenue (billion), by Country 2025 & 2033
- Figure 60: Middle East and Africa Photographic Equipment Industry Volume (K Units), by Country 2025 & 2033
- Figure 61: Middle East and Africa Photographic Equipment Industry Revenue Share (%), by Country 2025 & 2033
- Figure 62: Middle East and Africa Photographic Equipment Industry Volume Share (%), by Country 2025 & 2033
List of Tables
- Table 1: Global Photographic Equipment Industry Revenue billion Forecast, by Product Type 2020 & 2033
- Table 2: Global Photographic Equipment Industry Volume K Units Forecast, by Product Type 2020 & 2033
- Table 3: Global Photographic Equipment Industry Revenue billion Forecast, by Distribution Channel 2020 & 2033
- Table 4: Global Photographic Equipment Industry Volume K Units Forecast, by Distribution Channel 2020 & 2033
- Table 5: Global Photographic Equipment Industry Revenue billion Forecast, by Region 2020 & 2033
- Table 6: Global Photographic Equipment Industry Volume K Units Forecast, by Region 2020 & 2033
- Table 7: Global Photographic Equipment Industry Revenue billion Forecast, by Product Type 2020 & 2033
- Table 8: Global Photographic Equipment Industry Volume K Units Forecast, by Product Type 2020 & 2033
- Table 9: Global Photographic Equipment Industry Revenue billion Forecast, by Distribution Channel 2020 & 2033
- Table 10: Global Photographic Equipment Industry Volume K Units Forecast, by Distribution Channel 2020 & 2033
- Table 11: Global Photographic Equipment Industry Revenue billion Forecast, by Country 2020 & 2033
- Table 12: Global Photographic Equipment Industry Volume K Units Forecast, by Country 2020 & 2033
- Table 13: United States Photographic Equipment Industry Revenue (billion) Forecast, by Application 2020 & 2033
- Table 14: United States Photographic Equipment Industry Volume (K Units) Forecast, by Application 2020 & 2033
- Table 15: Canada Photographic Equipment Industry Revenue (billion) Forecast, by Application 2020 & 2033
- Table 16: Canada Photographic Equipment Industry Volume (K Units) Forecast, by Application 2020 & 2033
- Table 17: Mexico Photographic Equipment Industry Revenue (billion) Forecast, by Application 2020 & 2033
- Table 18: Mexico Photographic Equipment Industry Volume (K Units) Forecast, by Application 2020 & 2033
- Table 19: Rest of North America Photographic Equipment Industry Revenue (billion) Forecast, by Application 2020 & 2033
- Table 20: Rest of North America Photographic Equipment Industry Volume (K Units) Forecast, by Application 2020 & 2033
- Table 21: Global Photographic Equipment Industry Revenue billion Forecast, by Product Type 2020 & 2033
- Table 22: Global Photographic Equipment Industry Volume K Units Forecast, by Product Type 2020 & 2033
- Table 23: Global Photographic Equipment Industry Revenue billion Forecast, by Distribution Channel 2020 & 2033
- Table 24: Global Photographic Equipment Industry Volume K Units Forecast, by Distribution Channel 2020 & 2033
- Table 25: Global Photographic Equipment Industry Revenue billion Forecast, by Country 2020 & 2033
- Table 26: Global Photographic Equipment Industry Volume K Units Forecast, by Country 2020 & 2033
- Table 27: United Kingdom Photographic Equipment Industry Revenue (billion) Forecast, by Application 2020 & 2033
- Table 28: United Kingdom Photographic Equipment Industry Volume (K Units) Forecast, by Application 2020 & 2033
- Table 29: Germany Photographic Equipment Industry Revenue (billion) Forecast, by Application 2020 & 2033
- Table 30: Germany Photographic Equipment Industry Volume (K Units) Forecast, by Application 2020 & 2033
- Table 31: France Photographic Equipment Industry Revenue (billion) Forecast, by Application 2020 & 2033
- Table 32: France Photographic Equipment Industry Volume (K Units) Forecast, by Application 2020 & 2033
- Table 33: Italy Photographic Equipment Industry Revenue (billion) Forecast, by Application 2020 & 2033
- Table 34: Italy Photographic Equipment Industry Volume (K Units) Forecast, by Application 2020 & 2033
- Table 35: Russia Photographic Equipment Industry Revenue (billion) Forecast, by Application 2020 & 2033
- Table 36: Russia Photographic Equipment Industry Volume (K Units) Forecast, by Application 2020 & 2033
- Table 37: Rest of Europe Photographic Equipment Industry Revenue (billion) Forecast, by Application 2020 & 2033
- Table 38: Rest of Europe Photographic Equipment Industry Volume (K Units) Forecast, by Application 2020 & 2033
- Table 39: Global Photographic Equipment Industry Revenue billion Forecast, by Product Type 2020 & 2033
- Table 40: Global Photographic Equipment Industry Volume K Units Forecast, by Product Type 2020 & 2033
- Table 41: Global Photographic Equipment Industry Revenue billion Forecast, by Distribution Channel 2020 & 2033
- Table 42: Global Photographic Equipment Industry Volume K Units Forecast, by Distribution Channel 2020 & 2033
- Table 43: Global Photographic Equipment Industry Revenue billion Forecast, by Country 2020 & 2033
- Table 44: Global Photographic Equipment Industry Volume K Units Forecast, by Country 2020 & 2033
- Table 45: China Photographic Equipment Industry Revenue (billion) Forecast, by Application 2020 & 2033
- Table 46: China Photographic Equipment Industry Volume (K Units) Forecast, by Application 2020 & 2033
- Table 47: Japan Photographic Equipment Industry Revenue (billion) Forecast, by Application 2020 & 2033
- Table 48: Japan Photographic Equipment Industry Volume (K Units) Forecast, by Application 2020 & 2033
- Table 49: India Photographic Equipment Industry Revenue (billion) Forecast, by Application 2020 & 2033
- Table 50: India Photographic Equipment Industry Volume (K Units) Forecast, by Application 2020 & 2033
- Table 51: Australia Photographic Equipment Industry Revenue (billion) Forecast, by Application 2020 & 2033
- Table 52: Australia Photographic Equipment Industry Volume (K Units) Forecast, by Application 2020 & 2033
- Table 53: Rest of Asia Pacific Photographic Equipment Industry Revenue (billion) Forecast, by Application 2020 & 2033
- Table 54: Rest of Asia Pacific Photographic Equipment Industry Volume (K Units) Forecast, by Application 2020 & 2033
- Table 55: Global Photographic Equipment Industry Revenue billion Forecast, by Product Type 2020 & 2033
- Table 56: Global Photographic Equipment Industry Volume K Units Forecast, by Product Type 2020 & 2033
- Table 57: Global Photographic Equipment Industry Revenue billion Forecast, by Distribution Channel 2020 & 2033
- Table 58: Global Photographic Equipment Industry Volume K Units Forecast, by Distribution Channel 2020 & 2033
- Table 59: Global Photographic Equipment Industry Revenue billion Forecast, by Country 2020 & 2033
- Table 60: Global Photographic Equipment Industry Volume K Units Forecast, by Country 2020 & 2033
- Table 61: Brazil Photographic Equipment Industry Revenue (billion) Forecast, by Application 2020 & 2033
- Table 62: Brazil Photographic Equipment Industry Volume (K Units) Forecast, by Application 2020 & 2033
- Table 63: Argentina Photographic Equipment Industry Revenue (billion) Forecast, by Application 2020 & 2033
- Table 64: Argentina Photographic Equipment Industry Volume (K Units) Forecast, by Application 2020 & 2033
- Table 65: Rest of South America Photographic Equipment Industry Revenue (billion) Forecast, by Application 2020 & 2033
- Table 66: Rest of South America Photographic Equipment Industry Volume (K Units) Forecast, by Application 2020 & 2033
- Table 67: Global Photographic Equipment Industry Revenue billion Forecast, by Product Type 2020 & 2033
- Table 68: Global Photographic Equipment Industry Volume K Units Forecast, by Product Type 2020 & 2033
- Table 69: Global Photographic Equipment Industry Revenue billion Forecast, by Distribution Channel 2020 & 2033
- Table 70: Global Photographic Equipment Industry Volume K Units Forecast, by Distribution Channel 2020 & 2033
- Table 71: Global Photographic Equipment Industry Revenue billion Forecast, by Country 2020 & 2033
- Table 72: Global Photographic Equipment Industry Volume K Units Forecast, by Country 2020 & 2033
- Table 73: South Africa Photographic Equipment Industry Revenue (billion) Forecast, by Application 2020 & 2033
- Table 74: South Africa Photographic Equipment Industry Volume (K Units) Forecast, by Application 2020 & 2033
- Table 75: Saudi Arabia Photographic Equipment Industry Revenue (billion) Forecast, by Application 2020 & 2033
- Table 76: Saudi Arabia Photographic Equipment Industry Volume (K Units) Forecast, by Application 2020 & 2033
- Table 77: Rest of Middle East and Africa Photographic Equipment Industry Revenue (billion) Forecast, by Application 2020 & 2033
- Table 78: Rest of Middle East and Africa Photographic Equipment Industry Volume (K Units) Forecast, by Application 2020 & 2033
Frequently Asked Questions
1. What is the projected Compound Annual Growth Rate (CAGR) of the Photographic Equipment Industry?
The projected CAGR is approximately 7.1%.
2. Which companies are prominent players in the Photographic Equipment Industry?
Key companies in the market include Canon Inc, Nikon Corporation, Samsung Electronics Co, FUJIFILM Holdings Corporation, Leica Camera AG*List Not Exhaustive, Panasonic Corporation, Sony Corporation.
3. What are the main segments of the Photographic Equipment Industry?
The market segments include Product Type, Distribution Channel.
4. Can you provide details about the market size?
The market size is estimated to be USD 6.5 billion as of 2022.
5. What are some drivers contributing to market growth?
Fast Fashion Trend; Inflating Income Level of Individuals.
6. What are the notable trends driving market growth?
Increasing sale of Photography Equipment’s from Online Retailing Channels.
7. Are there any restraints impacting market growth?
The Presence Of Counterfeit Products.
8. Can you provide examples of recent developments in the market?
N/A
9. What pricing options are available for accessing the report?
Pricing options include single-user, multi-user, and enterprise licenses priced at USD 4750, USD 5250, and USD 8750 respectively.
10. Is the market size provided in terms of value or volume?
The market size is provided in terms of value, measured in billion and volume, measured in K Units.
11. Are there any specific market keywords associated with the report?
Yes, the market keyword associated with the report is "Photographic Equipment Industry," which aids in identifying and referencing the specific market segment covered.
12. How do I determine which pricing option suits my needs best?
The pricing options vary based on user requirements and access needs. Individual users may opt for single-user licenses, while businesses requiring broader access may choose multi-user or enterprise licenses for cost-effective access to the report.
13. Are there any additional resources or data provided in the Photographic Equipment Industry report?
While the report offers comprehensive insights, it's advisable to review the specific contents or supplementary materials provided to ascertain if additional resources or data are available.
14. How can I stay updated on further developments or reports in the Photographic Equipment Industry?
To stay informed about further developments, trends, and reports in the Photographic Equipment Industry, consider subscribing to industry newsletters, following relevant companies and organizations, or regularly checking reputable industry news sources and publications.
Methodology
Step 1 - Identification of Relevant Samples Size from Population Database


Step 2 - Approaches for Defining Global Market Size (Value, Volume* & Price*)

Note*: In applicable scenarios
Step 3 - Data Sources
Primary Research
- Web Analytics
- Survey Reports
- Research Institute
- Latest Research Reports
- Opinion Leaders
Secondary Research
- Annual Reports
- White Paper
- Latest Press Release
- Industry Association
- Paid Database
- Investor Presentations

Step 4 - Data Triangulation
Involves using different sources of information in order to increase the validity of a study
These sources are likely to be stakeholders in a program - participants, other researchers, program staff, other community members, and so on.
Then we put all data in single framework & apply various statistical tools to find out the dynamic on the market.
During the analysis stage, feedback from the stakeholder groups would be compared to determine areas of agreement as well as areas of divergence