
Key Insights
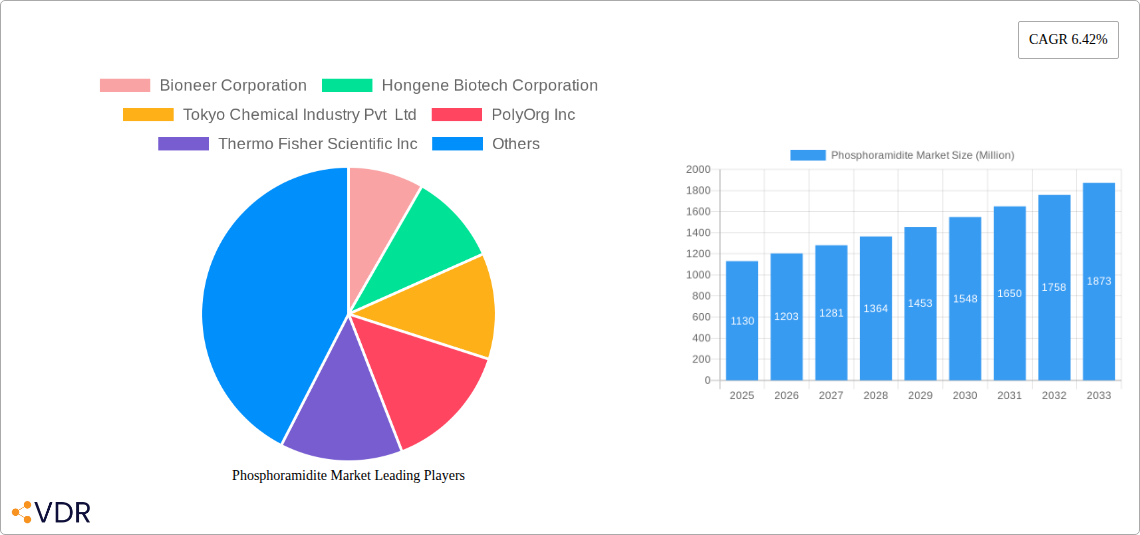
The global phosphoramidite market, valued at $1.13 billion in 2025, is projected to experience robust growth, driven by the increasing demand for oligonucleotide synthesis in pharmaceutical and biotechnology research. The compound annual growth rate (CAGR) of 6.42% from 2025 to 2033 indicates a significant expansion in market size over the forecast period. Key drivers include the rising prevalence of genetic disorders and the growing adoption of personalized medicine, which fuels the need for customized oligonucleotides in diagnostic and therapeutic applications. Furthermore, advancements in next-generation sequencing (NGS) technologies and their integration into various research areas are contributing to the market's growth. The pharmaceutical and biotechnology sector represents the largest end-user segment, driven by the development of novel therapeutics, including antisense oligonucleotides, siRNAs, and aptamers. The DNA phosphoramidite type currently dominates the market, reflecting its wider use in various applications. However, RNA phosphoramidites are expected to witness substantial growth due to the increasing importance of RNA-based therapeutics. Geographic segmentation shows North America currently holding a significant market share, fueled by a strong presence of key players and advanced research infrastructure. However, Asia Pacific is poised for rapid expansion, owing to the increasing investments in biotechnology and life sciences research within countries like China and India. While the market faces some restraints, such as stringent regulatory approvals for new oligonucleotide-based drugs and potential cost challenges, the overall outlook remains positive, indicating significant opportunities for growth in the coming years.
The competitive landscape is characterized by a mix of established players and emerging companies. Key players like Thermo Fisher Scientific, QIAGEN, and TriLink BioTechnologies benefit from their established distribution networks and comprehensive product portfolios. The market also features smaller, specialized companies focusing on specific types of phosphoramidites or niche applications. The strategic alliances, acquisitions, and technological advancements witnessed in recent years are expected to reshape the competitive dynamics, fostering further innovation and market expansion. Future growth will hinge on continuous technological improvements in oligonucleotide synthesis, the expansion of applications in novel therapeutic areas, and the development of cost-effective manufacturing processes. The focus on developing more efficient and scalable synthesis methods will be crucial to meeting the increasing demand for phosphoramidites in diverse applications.
Phosphoramidite Market: A Comprehensive Report (2019-2033)
This comprehensive report provides an in-depth analysis of the Phosphoramidite Market, encompassing market dynamics, growth trends, regional dominance, product landscape, and key players. The study period covers 2019-2033, with 2025 as the base and estimated year. The report offers invaluable insights for industry professionals, investors, and researchers seeking to understand and capitalize on opportunities within this dynamic sector. The market is segmented by end-user (Pharmaceutical and Biotechnology Companies, Academic and Research Institutes, Other End-Users) and by type (DNA Phosphoramidites, RNA Phosphoramidites, Other Phosphoramidites). The total market size is projected to reach xx Million by 2033.
Phosphoramidite Market Dynamics & Structure
The Phosphoramidite market exhibits a moderately concentrated structure, with key players holding significant market share. Technological innovation, particularly in solid-phase synthesis and next-generation sequencing, is a primary driver. Regulatory frameworks, including those governing pharmaceutical and biotechnology products, play a crucial role. Competitive substitutes include alternative nucleic acid synthesis methods, but phosphoramidites remain dominant due to their efficiency and cost-effectiveness. The end-user demographics are skewed towards pharmaceutical and biotechnology companies, reflecting the significant application of phosphoramidites in drug discovery and development. M&A activity in the sector has been moderate, with a focus on enhancing manufacturing capabilities and expanding product portfolios. Over the historical period (2019-2024), approximately xx M&A deals were recorded, resulting in a xx% increase in market consolidation.
- Market Concentration: Moderately concentrated, with top 5 players holding approximately xx% market share.
- Technological Innovation: Focus on high-throughput synthesis, improved purity, and modified phosphoramidites.
- Regulatory Landscape: Stringent regulations regarding purity and quality standards influence market dynamics.
- Competitive Landscape: Intense competition among established players and emerging companies.
- End-User Demographics: Pharmaceutical and biotechnology companies represent the largest end-user segment, accounting for approximately xx% of the market.
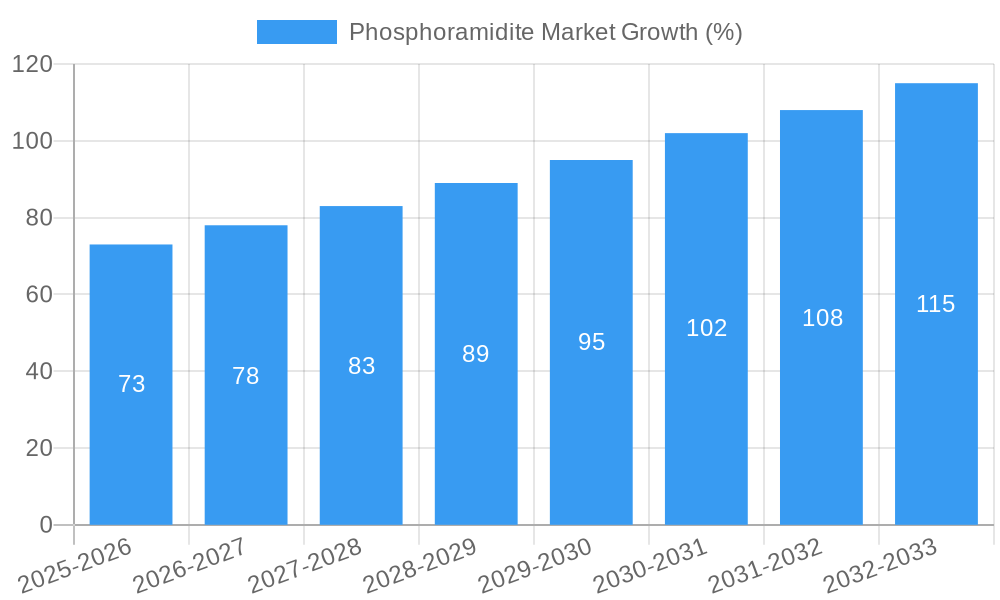
Phosphoramidite Market Growth Trends & Insights
The Phosphoramidite market has witnessed consistent growth over the historical period (2019-2024), driven by increasing demand for oligonucleotide-based therapeutics and diagnostics. The market size expanded from xx Million in 2019 to xx Million in 2024, exhibiting a CAGR of xx%. This growth is projected to continue through the forecast period (2025-2033), albeit at a slightly moderated pace, reaching an estimated xx Million by 2033. The adoption rate of phosphoramidites in various applications, including gene editing and personalized medicine, is accelerating. Technological disruptions, particularly advancements in solid-phase synthesis and automation, are further boosting market growth. Consumer behavior shifts towards more targeted and personalized healthcare solutions are creating new opportunities for phosphoramidite-based products.
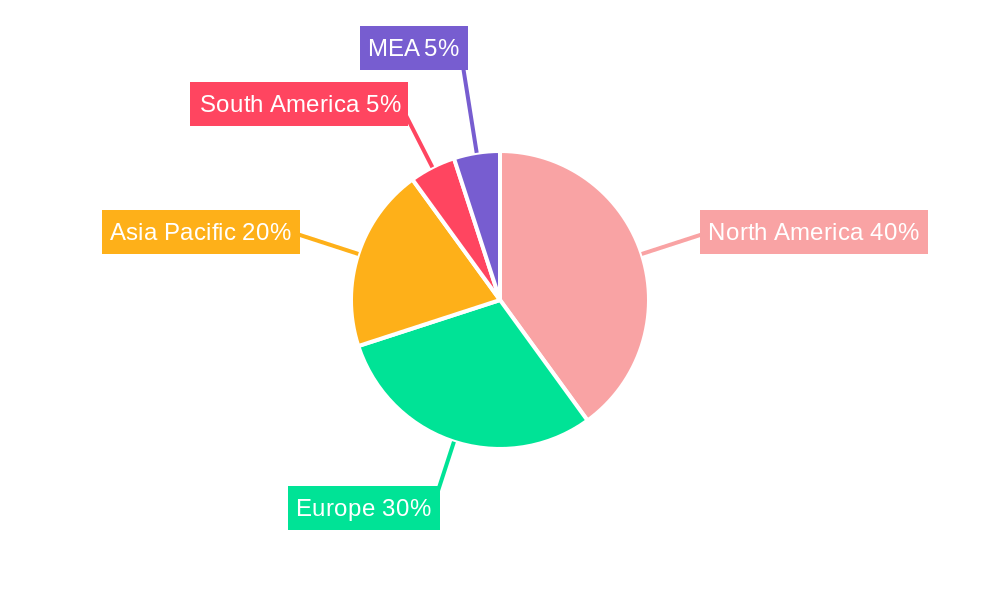
Dominant Regions, Countries, or Segments in Phosphoramidite Market
North America currently holds the largest market share, driven by a robust pharmaceutical and biotechnology industry and significant investments in research and development. Europe follows closely, with strong academic research institutions and a growing demand for advanced therapeutics. Within the segment breakdown, Pharmaceutical and Biotechnology Companies constitute the dominant end-user segment, accounting for over xx% of the total market value. DNA Phosphoramidites are the leading product type, dominating the market due to their widespread application in various fields.
- Key Drivers:
- North America: Strong R&D investment, robust pharmaceutical industry, favorable regulatory environment.
- Europe: High concentration of academic and research institutions, increasing adoption of advanced therapeutics.
- Pharmaceutical and Biotechnology Companies: High demand for phosphoramidites in drug discovery and development.
- DNA Phosphoramidites: Wide-ranging applications in diagnostics, therapeutics, and research.
Phosphoramidite Market Product Landscape
Phosphoramidite products are constantly evolving, with innovations focused on improving purity, yield, and scalability. The market features a wide array of products, tailored to specific applications. Key innovations include modified phosphoramidites with enhanced stability and functionality, enabling the synthesis of complex oligonucleotides for diverse applications such as next-generation sequencing and CRISPR-Cas9 gene editing. Performance metrics focus on purity, coupling efficiency, and scale-up capabilities. Unique selling propositions often emphasize customized synthesis services, rapid turnaround times, and high-quality products.
Key Drivers, Barriers & Challenges in Phosphoramidite Market
Key Drivers: The rising prevalence of chronic diseases, the increasing demand for personalized medicine, and significant investments in genomics and proteomics research are driving the growth of the phosphoramidite market. Technological advancements, including automation and high-throughput synthesis, further enhance market expansion. Favorable regulatory policies supporting the development of novel therapeutics also contribute positively.
Key Barriers & Challenges: Stringent regulatory approvals for new drugs and diagnostic tools can impede market growth. Price competition among manufacturers, supply chain disruptions, and the potential for technological obsolescence are also challenges. The cost of advanced phosphoramidites can limit market accessibility.
Emerging Opportunities in Phosphoramidite Market
Untapped markets in developing economies, coupled with the increasing adoption of personalized medicine, offer significant growth potential. Innovative applications of phosphoramidites in areas such as gene therapy, CRISPR-Cas9 technology, and next-generation sequencing are creating new opportunities. The evolving consumer preference for targeted and effective therapeutic solutions drives further demand.
Growth Accelerators in the Phosphoramidite Market Industry
Technological breakthroughs in solid-phase synthesis and automation are accelerating market growth. Strategic partnerships between manufacturers and research institutions foster innovation and expand market reach. The expansion of the oligonucleotide therapeutics market, driven by the increasing prevalence of genetic disorders, fuels demand for phosphoramidites.
Key Players Shaping the Phosphoramidite Market Market
- Bioneer Corporation
- Hongene Biotech Corporation
- Tokyo Chemical Industry Pvt Ltd
- PolyOrg Inc
- Thermo Fisher Scientific Inc
- Biosynth Ltd
- Lumiprobe Corporation
- Danaher Corporation
- QIAGEN N V
- TriLink BioTechnologies
- Creative Biolabs Inc
- BOC Sciences
Notable Milestones in Phosphoramidite Market Sector
- March 2023: Oligo Factory opens a new 13,000 sq ft oligo manufacturing facility in Holliston, United States, expanding manufacturing capacity.
- July 2022: WuXi STA launches a large-scale oligonucleotide and peptide manufacturing facility, significantly increasing global capacity for oligonucleotide therapeutics.
In-Depth Phosphoramidite Market Market Outlook
The phosphoramidite market is poised for continued growth, fueled by technological advancements, increasing demand for oligonucleotide-based therapeutics, and expansion into emerging markets. Strategic partnerships and investments in R&D will further drive market expansion. The focus on developing customized and high-purity phosphoramidites for niche applications will also contribute to market growth. Opportunities exist in developing novel phosphoramidite-based products for gene editing and other emerging therapeutic applications.
Phosphoramidite Market Segmentation
-
1. Type
- 1.1. DNA Phosphoramidites
- 1.2. RNA Phosphoramidites
- 1.3. Other Phosphoramidites
-
2. End-User
- 2.1. Pharmaceutical and Biotechnology Companies
- 2.2. Academic and Research Institutes
- 2.3. Other End-Users
Phosphoramidite Market Segmentation By Geography
-
1. North America
- 1.1. United States
- 1.2. Canada
- 1.3. Mexico
-
2. Europe
- 2.1. Germany
- 2.2. United Kingdom
- 2.3. France
- 2.4. Italy
- 2.5. Spain
- 2.6. Rest of Europe
-
3. Asia Pacific
- 3.1. China
- 3.2. Japan
- 3.3. India
- 3.4. Australia
- 3.5. South Korea
- 3.6. Rest of Asia Pacific
- 4. Rest of the World
Phosphoramidite Market REPORT HIGHLIGHTS
| Aspects | Details |
|---|---|
| Study Period | 2019-2033 |
| Base Year | 2024 |
| Estimated Year | 2025 |
| Forecast Period | 2025-2033 |
| Historical Period | 2019-2024 |
| Growth Rate | CAGR of 6.42% from 2019-2033 |
| Segmentation |
|
Table of Contents
- 1. Introduction
- 1.1. Research Scope
- 1.2. Market Segmentation
- 1.3. Research Methodology
- 1.4. Definitions and Assumptions
- 2. Executive Summary
- 2.1. Introduction
- 3. Market Dynamics
- 3.1. Introduction
- 3.2. Market Drivers
- 3.2.1. Increasing Synthetic Nucleotide Applications in Therapeutics; Growth in Synthetic Biology
- 3.3. Market Restrains
- 3.3.1. Challenges in Developing Long Nucleotide Sequences
- 3.4. Market Trends
- 3.4.1. DNA Phosphoramidites is Expected to Witness Growth Over the Forecast Period
- 4. Market Factor Analysis
- 4.1. Porters Five Forces
- 4.2. Supply/Value Chain
- 4.3. PESTEL analysis
- 4.4. Market Entropy
- 4.5. Patent/Trademark Analysis
- 5. Global Phosphoramidite Market Analysis, Insights and Forecast, 2019-2031
- 5.1. Market Analysis, Insights and Forecast - by Type
- 5.1.1. DNA Phosphoramidites
- 5.1.2. RNA Phosphoramidites
- 5.1.3. Other Phosphoramidites
- 5.2. Market Analysis, Insights and Forecast - by End-User
- 5.2.1. Pharmaceutical and Biotechnology Companies
- 5.2.2. Academic and Research Institutes
- 5.2.3. Other End-Users
- 5.3. Market Analysis, Insights and Forecast - by Region
- 5.3.1. North America
- 5.3.2. Europe
- 5.3.3. Asia Pacific
- 5.3.4. Rest of the World
- 5.1. Market Analysis, Insights and Forecast - by Type
- 6. North America Phosphoramidite Market Analysis, Insights and Forecast, 2019-2031
- 6.1. Market Analysis, Insights and Forecast - by Type
- 6.1.1. DNA Phosphoramidites
- 6.1.2. RNA Phosphoramidites
- 6.1.3. Other Phosphoramidites
- 6.2. Market Analysis, Insights and Forecast - by End-User
- 6.2.1. Pharmaceutical and Biotechnology Companies
- 6.2.2. Academic and Research Institutes
- 6.2.3. Other End-Users
- 6.1. Market Analysis, Insights and Forecast - by Type
- 7. Europe Phosphoramidite Market Analysis, Insights and Forecast, 2019-2031
- 7.1. Market Analysis, Insights and Forecast - by Type
- 7.1.1. DNA Phosphoramidites
- 7.1.2. RNA Phosphoramidites
- 7.1.3. Other Phosphoramidites
- 7.2. Market Analysis, Insights and Forecast - by End-User
- 7.2.1. Pharmaceutical and Biotechnology Companies
- 7.2.2. Academic and Research Institutes
- 7.2.3. Other End-Users
- 7.1. Market Analysis, Insights and Forecast - by Type
- 8. Asia Pacific Phosphoramidite Market Analysis, Insights and Forecast, 2019-2031
- 8.1. Market Analysis, Insights and Forecast - by Type
- 8.1.1. DNA Phosphoramidites
- 8.1.2. RNA Phosphoramidites
- 8.1.3. Other Phosphoramidites
- 8.2. Market Analysis, Insights and Forecast - by End-User
- 8.2.1. Pharmaceutical and Biotechnology Companies
- 8.2.2. Academic and Research Institutes
- 8.2.3. Other End-Users
- 8.1. Market Analysis, Insights and Forecast - by Type
- 9. Rest of the World Phosphoramidite Market Analysis, Insights and Forecast, 2019-2031
- 9.1. Market Analysis, Insights and Forecast - by Type
- 9.1.1. DNA Phosphoramidites
- 9.1.2. RNA Phosphoramidites
- 9.1.3. Other Phosphoramidites
- 9.2. Market Analysis, Insights and Forecast - by End-User
- 9.2.1. Pharmaceutical and Biotechnology Companies
- 9.2.2. Academic and Research Institutes
- 9.2.3. Other End-Users
- 9.1. Market Analysis, Insights and Forecast - by Type
- 10. North America Phosphoramidite Market Analysis, Insights and Forecast, 2019-2031
- 10.1. Market Analysis, Insights and Forecast - By Country/Sub-region
- 10.1.1 United States
- 10.1.2 Canada
- 10.1.3 Mexico
- 11. Europe Phosphoramidite Market Analysis, Insights and Forecast, 2019-2031
- 11.1. Market Analysis, Insights and Forecast - By Country/Sub-region
- 11.1.1 Germany
- 11.1.2 United Kingdom
- 11.1.3 France
- 11.1.4 Spain
- 11.1.5 Italy
- 11.1.6 Spain
- 11.1.7 Belgium
- 11.1.8 Netherland
- 11.1.9 Nordics
- 11.1.10 Rest of Europe
- 12. Asia Pacific Phosphoramidite Market Analysis, Insights and Forecast, 2019-2031
- 12.1. Market Analysis, Insights and Forecast - By Country/Sub-region
- 12.1.1 China
- 12.1.2 Japan
- 12.1.3 India
- 12.1.4 South Korea
- 12.1.5 Southeast Asia
- 12.1.6 Australia
- 12.1.7 Indonesia
- 12.1.8 Phillipes
- 12.1.9 Singapore
- 12.1.10 Thailandc
- 12.1.11 Rest of Asia Pacific
- 13. South America Phosphoramidite Market Analysis, Insights and Forecast, 2019-2031
- 13.1. Market Analysis, Insights and Forecast - By Country/Sub-region
- 13.1.1 Brazil
- 13.1.2 Argentina
- 13.1.3 Peru
- 13.1.4 Chile
- 13.1.5 Colombia
- 13.1.6 Ecuador
- 13.1.7 Venezuela
- 13.1.8 Rest of South America
- 14. North America Phosphoramidite Market Analysis, Insights and Forecast, 2019-2031
- 14.1. Market Analysis, Insights and Forecast - By Country/Sub-region
- 14.1.1 United States
- 14.1.2 Canada
- 14.1.3 Mexico
- 15. MEA Phosphoramidite Market Analysis, Insights and Forecast, 2019-2031
- 15.1. Market Analysis, Insights and Forecast - By Country/Sub-region
- 15.1.1 United Arab Emirates
- 15.1.2 Saudi Arabia
- 15.1.3 South Africa
- 15.1.4 Rest of Middle East and Africa
- 16. Competitive Analysis
- 16.1. Global Market Share Analysis 2024
- 16.2. Company Profiles
- 16.2.1 Bioneer Corporation
- 16.2.1.1. Overview
- 16.2.1.2. Products
- 16.2.1.3. SWOT Analysis
- 16.2.1.4. Recent Developments
- 16.2.1.5. Financials (Based on Availability)
- 16.2.2 Hongene Biotech Corporation
- 16.2.2.1. Overview
- 16.2.2.2. Products
- 16.2.2.3. SWOT Analysis
- 16.2.2.4. Recent Developments
- 16.2.2.5. Financials (Based on Availability)
- 16.2.3 Tokyo Chemical Industry Pvt Ltd
- 16.2.3.1. Overview
- 16.2.3.2. Products
- 16.2.3.3. SWOT Analysis
- 16.2.3.4. Recent Developments
- 16.2.3.5. Financials (Based on Availability)
- 16.2.4 PolyOrg Inc
- 16.2.4.1. Overview
- 16.2.4.2. Products
- 16.2.4.3. SWOT Analysis
- 16.2.4.4. Recent Developments
- 16.2.4.5. Financials (Based on Availability)
- 16.2.5 Thermo Fisher Scientific Inc
- 16.2.5.1. Overview
- 16.2.5.2. Products
- 16.2.5.3. SWOT Analysis
- 16.2.5.4. Recent Developments
- 16.2.5.5. Financials (Based on Availability)
- 16.2.6 Biosynth Ltd
- 16.2.6.1. Overview
- 16.2.6.2. Products
- 16.2.6.3. SWOT Analysis
- 16.2.6.4. Recent Developments
- 16.2.6.5. Financials (Based on Availability)
- 16.2.7 Lumiprobe Corporation
- 16.2.7.1. Overview
- 16.2.7.2. Products
- 16.2.7.3. SWOT Analysis
- 16.2.7.4. Recent Developments
- 16.2.7.5. Financials (Based on Availability)
- 16.2.8 Danaher Corporation
- 16.2.8.1. Overview
- 16.2.8.2. Products
- 16.2.8.3. SWOT Analysis
- 16.2.8.4. Recent Developments
- 16.2.8.5. Financials (Based on Availability)
- 16.2.9 QIAGEN N V
- 16.2.9.1. Overview
- 16.2.9.2. Products
- 16.2.9.3. SWOT Analysis
- 16.2.9.4. Recent Developments
- 16.2.9.5. Financials (Based on Availability)
- 16.2.10 TriLink BioTechnologies
- 16.2.10.1. Overview
- 16.2.10.2. Products
- 16.2.10.3. SWOT Analysis
- 16.2.10.4. Recent Developments
- 16.2.10.5. Financials (Based on Availability)
- 16.2.11 Creative Biolabs Inc
- 16.2.11.1. Overview
- 16.2.11.2. Products
- 16.2.11.3. SWOT Analysis
- 16.2.11.4. Recent Developments
- 16.2.11.5. Financials (Based on Availability)
- 16.2.12 BOC Sciences
- 16.2.12.1. Overview
- 16.2.12.2. Products
- 16.2.12.3. SWOT Analysis
- 16.2.12.4. Recent Developments
- 16.2.12.5. Financials (Based on Availability)
- 16.2.1 Bioneer Corporation
List of Figures
- Figure 1: Global Phosphoramidite Market Revenue Breakdown (Million, %) by Region 2024 & 2032
- Figure 2: Global Phosphoramidite Market Volume Breakdown (K Unit, %) by Region 2024 & 2032
- Figure 3: North America Phosphoramidite Market Revenue (Million), by Country 2024 & 2032
- Figure 4: North America Phosphoramidite Market Volume (K Unit), by Country 2024 & 2032
- Figure 5: North America Phosphoramidite Market Revenue Share (%), by Country 2024 & 2032
- Figure 6: North America Phosphoramidite Market Volume Share (%), by Country 2024 & 2032
- Figure 7: Europe Phosphoramidite Market Revenue (Million), by Country 2024 & 2032
- Figure 8: Europe Phosphoramidite Market Volume (K Unit), by Country 2024 & 2032
- Figure 9: Europe Phosphoramidite Market Revenue Share (%), by Country 2024 & 2032
- Figure 10: Europe Phosphoramidite Market Volume Share (%), by Country 2024 & 2032
- Figure 11: Asia Pacific Phosphoramidite Market Revenue (Million), by Country 2024 & 2032
- Figure 12: Asia Pacific Phosphoramidite Market Volume (K Unit), by Country 2024 & 2032
- Figure 13: Asia Pacific Phosphoramidite Market Revenue Share (%), by Country 2024 & 2032
- Figure 14: Asia Pacific Phosphoramidite Market Volume Share (%), by Country 2024 & 2032
- Figure 15: South America Phosphoramidite Market Revenue (Million), by Country 2024 & 2032
- Figure 16: South America Phosphoramidite Market Volume (K Unit), by Country 2024 & 2032
- Figure 17: South America Phosphoramidite Market Revenue Share (%), by Country 2024 & 2032
- Figure 18: South America Phosphoramidite Market Volume Share (%), by Country 2024 & 2032
- Figure 19: North America Phosphoramidite Market Revenue (Million), by Country 2024 & 2032
- Figure 20: North America Phosphoramidite Market Volume (K Unit), by Country 2024 & 2032
- Figure 21: North America Phosphoramidite Market Revenue Share (%), by Country 2024 & 2032
- Figure 22: North America Phosphoramidite Market Volume Share (%), by Country 2024 & 2032
- Figure 23: MEA Phosphoramidite Market Revenue (Million), by Country 2024 & 2032
- Figure 24: MEA Phosphoramidite Market Volume (K Unit), by Country 2024 & 2032
- Figure 25: MEA Phosphoramidite Market Revenue Share (%), by Country 2024 & 2032
- Figure 26: MEA Phosphoramidite Market Volume Share (%), by Country 2024 & 2032
- Figure 27: North America Phosphoramidite Market Revenue (Million), by Type 2024 & 2032
- Figure 28: North America Phosphoramidite Market Volume (K Unit), by Type 2024 & 2032
- Figure 29: North America Phosphoramidite Market Revenue Share (%), by Type 2024 & 2032
- Figure 30: North America Phosphoramidite Market Volume Share (%), by Type 2024 & 2032
- Figure 31: North America Phosphoramidite Market Revenue (Million), by End-User 2024 & 2032
- Figure 32: North America Phosphoramidite Market Volume (K Unit), by End-User 2024 & 2032
- Figure 33: North America Phosphoramidite Market Revenue Share (%), by End-User 2024 & 2032
- Figure 34: North America Phosphoramidite Market Volume Share (%), by End-User 2024 & 2032
- Figure 35: North America Phosphoramidite Market Revenue (Million), by Country 2024 & 2032
- Figure 36: North America Phosphoramidite Market Volume (K Unit), by Country 2024 & 2032
- Figure 37: North America Phosphoramidite Market Revenue Share (%), by Country 2024 & 2032
- Figure 38: North America Phosphoramidite Market Volume Share (%), by Country 2024 & 2032
- Figure 39: Europe Phosphoramidite Market Revenue (Million), by Type 2024 & 2032
- Figure 40: Europe Phosphoramidite Market Volume (K Unit), by Type 2024 & 2032
- Figure 41: Europe Phosphoramidite Market Revenue Share (%), by Type 2024 & 2032
- Figure 42: Europe Phosphoramidite Market Volume Share (%), by Type 2024 & 2032
- Figure 43: Europe Phosphoramidite Market Revenue (Million), by End-User 2024 & 2032
- Figure 44: Europe Phosphoramidite Market Volume (K Unit), by End-User 2024 & 2032
- Figure 45: Europe Phosphoramidite Market Revenue Share (%), by End-User 2024 & 2032
- Figure 46: Europe Phosphoramidite Market Volume Share (%), by End-User 2024 & 2032
- Figure 47: Europe Phosphoramidite Market Revenue (Million), by Country 2024 & 2032
- Figure 48: Europe Phosphoramidite Market Volume (K Unit), by Country 2024 & 2032
- Figure 49: Europe Phosphoramidite Market Revenue Share (%), by Country 2024 & 2032
- Figure 50: Europe Phosphoramidite Market Volume Share (%), by Country 2024 & 2032
- Figure 51: Asia Pacific Phosphoramidite Market Revenue (Million), by Type 2024 & 2032
- Figure 52: Asia Pacific Phosphoramidite Market Volume (K Unit), by Type 2024 & 2032
- Figure 53: Asia Pacific Phosphoramidite Market Revenue Share (%), by Type 2024 & 2032
- Figure 54: Asia Pacific Phosphoramidite Market Volume Share (%), by Type 2024 & 2032
- Figure 55: Asia Pacific Phosphoramidite Market Revenue (Million), by End-User 2024 & 2032
- Figure 56: Asia Pacific Phosphoramidite Market Volume (K Unit), by End-User 2024 & 2032
- Figure 57: Asia Pacific Phosphoramidite Market Revenue Share (%), by End-User 2024 & 2032
- Figure 58: Asia Pacific Phosphoramidite Market Volume Share (%), by End-User 2024 & 2032
- Figure 59: Asia Pacific Phosphoramidite Market Revenue (Million), by Country 2024 & 2032
- Figure 60: Asia Pacific Phosphoramidite Market Volume (K Unit), by Country 2024 & 2032
- Figure 61: Asia Pacific Phosphoramidite Market Revenue Share (%), by Country 2024 & 2032
- Figure 62: Asia Pacific Phosphoramidite Market Volume Share (%), by Country 2024 & 2032
- Figure 63: Rest of the World Phosphoramidite Market Revenue (Million), by Type 2024 & 2032
- Figure 64: Rest of the World Phosphoramidite Market Volume (K Unit), by Type 2024 & 2032
- Figure 65: Rest of the World Phosphoramidite Market Revenue Share (%), by Type 2024 & 2032
- Figure 66: Rest of the World Phosphoramidite Market Volume Share (%), by Type 2024 & 2032
- Figure 67: Rest of the World Phosphoramidite Market Revenue (Million), by End-User 2024 & 2032
- Figure 68: Rest of the World Phosphoramidite Market Volume (K Unit), by End-User 2024 & 2032
- Figure 69: Rest of the World Phosphoramidite Market Revenue Share (%), by End-User 2024 & 2032
- Figure 70: Rest of the World Phosphoramidite Market Volume Share (%), by End-User 2024 & 2032
- Figure 71: Rest of the World Phosphoramidite Market Revenue (Million), by Country 2024 & 2032
- Figure 72: Rest of the World Phosphoramidite Market Volume (K Unit), by Country 2024 & 2032
- Figure 73: Rest of the World Phosphoramidite Market Revenue Share (%), by Country 2024 & 2032
- Figure 74: Rest of the World Phosphoramidite Market Volume Share (%), by Country 2024 & 2032
List of Tables
- Table 1: Global Phosphoramidite Market Revenue Million Forecast, by Region 2019 & 2032
- Table 2: Global Phosphoramidite Market Volume K Unit Forecast, by Region 2019 & 2032
- Table 3: Global Phosphoramidite Market Revenue Million Forecast, by Type 2019 & 2032
- Table 4: Global Phosphoramidite Market Volume K Unit Forecast, by Type 2019 & 2032
- Table 5: Global Phosphoramidite Market Revenue Million Forecast, by End-User 2019 & 2032
- Table 6: Global Phosphoramidite Market Volume K Unit Forecast, by End-User 2019 & 2032
- Table 7: Global Phosphoramidite Market Revenue Million Forecast, by Region 2019 & 2032
- Table 8: Global Phosphoramidite Market Volume K Unit Forecast, by Region 2019 & 2032
- Table 9: Global Phosphoramidite Market Revenue Million Forecast, by Country 2019 & 2032
- Table 10: Global Phosphoramidite Market Volume K Unit Forecast, by Country 2019 & 2032
- Table 11: United States Phosphoramidite Market Revenue (Million) Forecast, by Application 2019 & 2032
- Table 12: United States Phosphoramidite Market Volume (K Unit) Forecast, by Application 2019 & 2032
- Table 13: Canada Phosphoramidite Market Revenue (Million) Forecast, by Application 2019 & 2032
- Table 14: Canada Phosphoramidite Market Volume (K Unit) Forecast, by Application 2019 & 2032
- Table 15: Mexico Phosphoramidite Market Revenue (Million) Forecast, by Application 2019 & 2032
- Table 16: Mexico Phosphoramidite Market Volume (K Unit) Forecast, by Application 2019 & 2032
- Table 17: Global Phosphoramidite Market Revenue Million Forecast, by Country 2019 & 2032
- Table 18: Global Phosphoramidite Market Volume K Unit Forecast, by Country 2019 & 2032
- Table 19: Germany Phosphoramidite Market Revenue (Million) Forecast, by Application 2019 & 2032
- Table 20: Germany Phosphoramidite Market Volume (K Unit) Forecast, by Application 2019 & 2032
- Table 21: United Kingdom Phosphoramidite Market Revenue (Million) Forecast, by Application 2019 & 2032
- Table 22: United Kingdom Phosphoramidite Market Volume (K Unit) Forecast, by Application 2019 & 2032
- Table 23: France Phosphoramidite Market Revenue (Million) Forecast, by Application 2019 & 2032
- Table 24: France Phosphoramidite Market Volume (K Unit) Forecast, by Application 2019 & 2032
- Table 25: Spain Phosphoramidite Market Revenue (Million) Forecast, by Application 2019 & 2032
- Table 26: Spain Phosphoramidite Market Volume (K Unit) Forecast, by Application 2019 & 2032
- Table 27: Italy Phosphoramidite Market Revenue (Million) Forecast, by Application 2019 & 2032
- Table 28: Italy Phosphoramidite Market Volume (K Unit) Forecast, by Application 2019 & 2032
- Table 29: Spain Phosphoramidite Market Revenue (Million) Forecast, by Application 2019 & 2032
- Table 30: Spain Phosphoramidite Market Volume (K Unit) Forecast, by Application 2019 & 2032
- Table 31: Belgium Phosphoramidite Market Revenue (Million) Forecast, by Application 2019 & 2032
- Table 32: Belgium Phosphoramidite Market Volume (K Unit) Forecast, by Application 2019 & 2032
- Table 33: Netherland Phosphoramidite Market Revenue (Million) Forecast, by Application 2019 & 2032
- Table 34: Netherland Phosphoramidite Market Volume (K Unit) Forecast, by Application 2019 & 2032
- Table 35: Nordics Phosphoramidite Market Revenue (Million) Forecast, by Application 2019 & 2032
- Table 36: Nordics Phosphoramidite Market Volume (K Unit) Forecast, by Application 2019 & 2032
- Table 37: Rest of Europe Phosphoramidite Market Revenue (Million) Forecast, by Application 2019 & 2032
- Table 38: Rest of Europe Phosphoramidite Market Volume (K Unit) Forecast, by Application 2019 & 2032
- Table 39: Global Phosphoramidite Market Revenue Million Forecast, by Country 2019 & 2032
- Table 40: Global Phosphoramidite Market Volume K Unit Forecast, by Country 2019 & 2032
- Table 41: China Phosphoramidite Market Revenue (Million) Forecast, by Application 2019 & 2032
- Table 42: China Phosphoramidite Market Volume (K Unit) Forecast, by Application 2019 & 2032
- Table 43: Japan Phosphoramidite Market Revenue (Million) Forecast, by Application 2019 & 2032
- Table 44: Japan Phosphoramidite Market Volume (K Unit) Forecast, by Application 2019 & 2032
- Table 45: India Phosphoramidite Market Revenue (Million) Forecast, by Application 2019 & 2032
- Table 46: India Phosphoramidite Market Volume (K Unit) Forecast, by Application 2019 & 2032
- Table 47: South Korea Phosphoramidite Market Revenue (Million) Forecast, by Application 2019 & 2032
- Table 48: South Korea Phosphoramidite Market Volume (K Unit) Forecast, by Application 2019 & 2032
- Table 49: Southeast Asia Phosphoramidite Market Revenue (Million) Forecast, by Application 2019 & 2032
- Table 50: Southeast Asia Phosphoramidite Market Volume (K Unit) Forecast, by Application 2019 & 2032
- Table 51: Australia Phosphoramidite Market Revenue (Million) Forecast, by Application 2019 & 2032
- Table 52: Australia Phosphoramidite Market Volume (K Unit) Forecast, by Application 2019 & 2032
- Table 53: Indonesia Phosphoramidite Market Revenue (Million) Forecast, by Application 2019 & 2032
- Table 54: Indonesia Phosphoramidite Market Volume (K Unit) Forecast, by Application 2019 & 2032
- Table 55: Phillipes Phosphoramidite Market Revenue (Million) Forecast, by Application 2019 & 2032
- Table 56: Phillipes Phosphoramidite Market Volume (K Unit) Forecast, by Application 2019 & 2032
- Table 57: Singapore Phosphoramidite Market Revenue (Million) Forecast, by Application 2019 & 2032
- Table 58: Singapore Phosphoramidite Market Volume (K Unit) Forecast, by Application 2019 & 2032
- Table 59: Thailandc Phosphoramidite Market Revenue (Million) Forecast, by Application 2019 & 2032
- Table 60: Thailandc Phosphoramidite Market Volume (K Unit) Forecast, by Application 2019 & 2032
- Table 61: Rest of Asia Pacific Phosphoramidite Market Revenue (Million) Forecast, by Application 2019 & 2032
- Table 62: Rest of Asia Pacific Phosphoramidite Market Volume (K Unit) Forecast, by Application 2019 & 2032
- Table 63: Global Phosphoramidite Market Revenue Million Forecast, by Country 2019 & 2032
- Table 64: Global Phosphoramidite Market Volume K Unit Forecast, by Country 2019 & 2032
- Table 65: Brazil Phosphoramidite Market Revenue (Million) Forecast, by Application 2019 & 2032
- Table 66: Brazil Phosphoramidite Market Volume (K Unit) Forecast, by Application 2019 & 2032
- Table 67: Argentina Phosphoramidite Market Revenue (Million) Forecast, by Application 2019 & 2032
- Table 68: Argentina Phosphoramidite Market Volume (K Unit) Forecast, by Application 2019 & 2032
- Table 69: Peru Phosphoramidite Market Revenue (Million) Forecast, by Application 2019 & 2032
- Table 70: Peru Phosphoramidite Market Volume (K Unit) Forecast, by Application 2019 & 2032
- Table 71: Chile Phosphoramidite Market Revenue (Million) Forecast, by Application 2019 & 2032
- Table 72: Chile Phosphoramidite Market Volume (K Unit) Forecast, by Application 2019 & 2032
- Table 73: Colombia Phosphoramidite Market Revenue (Million) Forecast, by Application 2019 & 2032
- Table 74: Colombia Phosphoramidite Market Volume (K Unit) Forecast, by Application 2019 & 2032
- Table 75: Ecuador Phosphoramidite Market Revenue (Million) Forecast, by Application 2019 & 2032
- Table 76: Ecuador Phosphoramidite Market Volume (K Unit) Forecast, by Application 2019 & 2032
- Table 77: Venezuela Phosphoramidite Market Revenue (Million) Forecast, by Application 2019 & 2032
- Table 78: Venezuela Phosphoramidite Market Volume (K Unit) Forecast, by Application 2019 & 2032
- Table 79: Rest of South America Phosphoramidite Market Revenue (Million) Forecast, by Application 2019 & 2032
- Table 80: Rest of South America Phosphoramidite Market Volume (K Unit) Forecast, by Application 2019 & 2032
- Table 81: Global Phosphoramidite Market Revenue Million Forecast, by Country 2019 & 2032
- Table 82: Global Phosphoramidite Market Volume K Unit Forecast, by Country 2019 & 2032
- Table 83: United States Phosphoramidite Market Revenue (Million) Forecast, by Application 2019 & 2032
- Table 84: United States Phosphoramidite Market Volume (K Unit) Forecast, by Application 2019 & 2032
- Table 85: Canada Phosphoramidite Market Revenue (Million) Forecast, by Application 2019 & 2032
- Table 86: Canada Phosphoramidite Market Volume (K Unit) Forecast, by Application 2019 & 2032
- Table 87: Mexico Phosphoramidite Market Revenue (Million) Forecast, by Application 2019 & 2032
- Table 88: Mexico Phosphoramidite Market Volume (K Unit) Forecast, by Application 2019 & 2032
- Table 89: Global Phosphoramidite Market Revenue Million Forecast, by Country 2019 & 2032
- Table 90: Global Phosphoramidite Market Volume K Unit Forecast, by Country 2019 & 2032
- Table 91: United Arab Emirates Phosphoramidite Market Revenue (Million) Forecast, by Application 2019 & 2032
- Table 92: United Arab Emirates Phosphoramidite Market Volume (K Unit) Forecast, by Application 2019 & 2032
- Table 93: Saudi Arabia Phosphoramidite Market Revenue (Million) Forecast, by Application 2019 & 2032
- Table 94: Saudi Arabia Phosphoramidite Market Volume (K Unit) Forecast, by Application 2019 & 2032
- Table 95: South Africa Phosphoramidite Market Revenue (Million) Forecast, by Application 2019 & 2032
- Table 96: South Africa Phosphoramidite Market Volume (K Unit) Forecast, by Application 2019 & 2032
- Table 97: Rest of Middle East and Africa Phosphoramidite Market Revenue (Million) Forecast, by Application 2019 & 2032
- Table 98: Rest of Middle East and Africa Phosphoramidite Market Volume (K Unit) Forecast, by Application 2019 & 2032
- Table 99: Global Phosphoramidite Market Revenue Million Forecast, by Type 2019 & 2032
- Table 100: Global Phosphoramidite Market Volume K Unit Forecast, by Type 2019 & 2032
- Table 101: Global Phosphoramidite Market Revenue Million Forecast, by End-User 2019 & 2032
- Table 102: Global Phosphoramidite Market Volume K Unit Forecast, by End-User 2019 & 2032
- Table 103: Global Phosphoramidite Market Revenue Million Forecast, by Country 2019 & 2032
- Table 104: Global Phosphoramidite Market Volume K Unit Forecast, by Country 2019 & 2032
- Table 105: United States Phosphoramidite Market Revenue (Million) Forecast, by Application 2019 & 2032
- Table 106: United States Phosphoramidite Market Volume (K Unit) Forecast, by Application 2019 & 2032
- Table 107: Canada Phosphoramidite Market Revenue (Million) Forecast, by Application 2019 & 2032
- Table 108: Canada Phosphoramidite Market Volume (K Unit) Forecast, by Application 2019 & 2032
- Table 109: Mexico Phosphoramidite Market Revenue (Million) Forecast, by Application 2019 & 2032
- Table 110: Mexico Phosphoramidite Market Volume (K Unit) Forecast, by Application 2019 & 2032
- Table 111: Global Phosphoramidite Market Revenue Million Forecast, by Type 2019 & 2032
- Table 112: Global Phosphoramidite Market Volume K Unit Forecast, by Type 2019 & 2032
- Table 113: Global Phosphoramidite Market Revenue Million Forecast, by End-User 2019 & 2032
- Table 114: Global Phosphoramidite Market Volume K Unit Forecast, by End-User 2019 & 2032
- Table 115: Global Phosphoramidite Market Revenue Million Forecast, by Country 2019 & 2032
- Table 116: Global Phosphoramidite Market Volume K Unit Forecast, by Country 2019 & 2032
- Table 117: Germany Phosphoramidite Market Revenue (Million) Forecast, by Application 2019 & 2032
- Table 118: Germany Phosphoramidite Market Volume (K Unit) Forecast, by Application 2019 & 2032
- Table 119: United Kingdom Phosphoramidite Market Revenue (Million) Forecast, by Application 2019 & 2032
- Table 120: United Kingdom Phosphoramidite Market Volume (K Unit) Forecast, by Application 2019 & 2032
- Table 121: France Phosphoramidite Market Revenue (Million) Forecast, by Application 2019 & 2032
- Table 122: France Phosphoramidite Market Volume (K Unit) Forecast, by Application 2019 & 2032
- Table 123: Italy Phosphoramidite Market Revenue (Million) Forecast, by Application 2019 & 2032
- Table 124: Italy Phosphoramidite Market Volume (K Unit) Forecast, by Application 2019 & 2032
- Table 125: Spain Phosphoramidite Market Revenue (Million) Forecast, by Application 2019 & 2032
- Table 126: Spain Phosphoramidite Market Volume (K Unit) Forecast, by Application 2019 & 2032
- Table 127: Rest of Europe Phosphoramidite Market Revenue (Million) Forecast, by Application 2019 & 2032
- Table 128: Rest of Europe Phosphoramidite Market Volume (K Unit) Forecast, by Application 2019 & 2032
- Table 129: Global Phosphoramidite Market Revenue Million Forecast, by Type 2019 & 2032
- Table 130: Global Phosphoramidite Market Volume K Unit Forecast, by Type 2019 & 2032
- Table 131: Global Phosphoramidite Market Revenue Million Forecast, by End-User 2019 & 2032
- Table 132: Global Phosphoramidite Market Volume K Unit Forecast, by End-User 2019 & 2032
- Table 133: Global Phosphoramidite Market Revenue Million Forecast, by Country 2019 & 2032
- Table 134: Global Phosphoramidite Market Volume K Unit Forecast, by Country 2019 & 2032
- Table 135: China Phosphoramidite Market Revenue (Million) Forecast, by Application 2019 & 2032
- Table 136: China Phosphoramidite Market Volume (K Unit) Forecast, by Application 2019 & 2032
- Table 137: Japan Phosphoramidite Market Revenue (Million) Forecast, by Application 2019 & 2032
- Table 138: Japan Phosphoramidite Market Volume (K Unit) Forecast, by Application 2019 & 2032
- Table 139: India Phosphoramidite Market Revenue (Million) Forecast, by Application 2019 & 2032
- Table 140: India Phosphoramidite Market Volume (K Unit) Forecast, by Application 2019 & 2032
- Table 141: Australia Phosphoramidite Market Revenue (Million) Forecast, by Application 2019 & 2032
- Table 142: Australia Phosphoramidite Market Volume (K Unit) Forecast, by Application 2019 & 2032
- Table 143: South Korea Phosphoramidite Market Revenue (Million) Forecast, by Application 2019 & 2032
- Table 144: South Korea Phosphoramidite Market Volume (K Unit) Forecast, by Application 2019 & 2032
- Table 145: Rest of Asia Pacific Phosphoramidite Market Revenue (Million) Forecast, by Application 2019 & 2032
- Table 146: Rest of Asia Pacific Phosphoramidite Market Volume (K Unit) Forecast, by Application 2019 & 2032
- Table 147: Global Phosphoramidite Market Revenue Million Forecast, by Type 2019 & 2032
- Table 148: Global Phosphoramidite Market Volume K Unit Forecast, by Type 2019 & 2032
- Table 149: Global Phosphoramidite Market Revenue Million Forecast, by End-User 2019 & 2032
- Table 150: Global Phosphoramidite Market Volume K Unit Forecast, by End-User 2019 & 2032
- Table 151: Global Phosphoramidite Market Revenue Million Forecast, by Country 2019 & 2032
- Table 152: Global Phosphoramidite Market Volume K Unit Forecast, by Country 2019 & 2032
Frequently Asked Questions
1. What is the projected Compound Annual Growth Rate (CAGR) of the Phosphoramidite Market?
The projected CAGR is approximately 6.42%.
2. Which companies are prominent players in the Phosphoramidite Market?
Key companies in the market include Bioneer Corporation, Hongene Biotech Corporation, Tokyo Chemical Industry Pvt Ltd, PolyOrg Inc, Thermo Fisher Scientific Inc, Biosynth Ltd, Lumiprobe Corporation, Danaher Corporation, QIAGEN N V, TriLink BioTechnologies, Creative Biolabs Inc, BOC Sciences.
3. What are the main segments of the Phosphoramidite Market?
The market segments include Type, End-User.
4. Can you provide details about the market size?
The market size is estimated to be USD 1.13 Million as of 2022.
5. What are some drivers contributing to market growth?
Increasing Synthetic Nucleotide Applications in Therapeutics; Growth in Synthetic Biology.
6. What are the notable trends driving market growth?
DNA Phosphoramidites is Expected to Witness Growth Over the Forecast Period.
7. Are there any restraints impacting market growth?
Challenges in Developing Long Nucleotide Sequences.
8. Can you provide examples of recent developments in the market?
March 2023: Oligo Factory, an independent custom oligonucleotide manufacturer, opened a new oligo manufacturing facility with 13,000 sq ft of combined offices, bench space, and labs in Holliston, United States.
9. What pricing options are available for accessing the report?
Pricing options include single-user, multi-user, and enterprise licenses priced at USD 4750, USD 5250, and USD 8750 respectively.
10. Is the market size provided in terms of value or volume?
The market size is provided in terms of value, measured in Million and volume, measured in K Unit.
11. Are there any specific market keywords associated with the report?
Yes, the market keyword associated with the report is "Phosphoramidite Market," which aids in identifying and referencing the specific market segment covered.
12. How do I determine which pricing option suits my needs best?
The pricing options vary based on user requirements and access needs. Individual users may opt for single-user licenses, while businesses requiring broader access may choose multi-user or enterprise licenses for cost-effective access to the report.
13. Are there any additional resources or data provided in the Phosphoramidite Market report?
While the report offers comprehensive insights, it's advisable to review the specific contents or supplementary materials provided to ascertain if additional resources or data are available.
14. How can I stay updated on further developments or reports in the Phosphoramidite Market?
To stay informed about further developments, trends, and reports in the Phosphoramidite Market, consider subscribing to industry newsletters, following relevant companies and organizations, or regularly checking reputable industry news sources and publications.
Methodology
Step 1 - Identification of Relevant Samples Size from Population Database


Step 2 - Approaches for Defining Global Market Size (Value, Volume* & Price*)

Note*: In applicable scenarios
Step 3 - Data Sources
Primary Research
- Web Analytics
- Survey Reports
- Research Institute
- Latest Research Reports
- Opinion Leaders
Secondary Research
- Annual Reports
- White Paper
- Latest Press Release
- Industry Association
- Paid Database
- Investor Presentations

Step 4 - Data Triangulation
Involves using different sources of information in order to increase the validity of a study
These sources are likely to be stakeholders in a program - participants, other researchers, program staff, other community members, and so on.
Then we put all data in single framework & apply various statistical tools to find out the dynamic on the market.
During the analysis stage, feedback from the stakeholder groups would be compared to determine areas of agreement as well as areas of divergence


