


Key Insights
The global pharmaceutical jars market is poised for robust growth, projected to reach a substantial market size of approximately USD 26,000 million by 2025, with a compound annual growth rate (CAGR) of 4.1% anticipated through 2033. This expansion is largely fueled by the increasing global demand for pharmaceutical products, driven by a growing and aging population, rising healthcare expenditure, and the continuous development of new medications. The inherent need for safe, reliable, and compliant packaging solutions for various pharmaceutical formulations, including solid dosage forms, powders, and creams, underpins the sustained demand for these essential containers. Technological advancements in material science and manufacturing processes are also contributing significantly, leading to the development of more innovative, sustainable, and cost-effective jar solutions that meet stringent regulatory requirements. The market's growth is further supported by the expanding pharmaceutical manufacturing base, particularly in emerging economies, where increased access to healthcare is driving the consumption of a wider range of medicines.
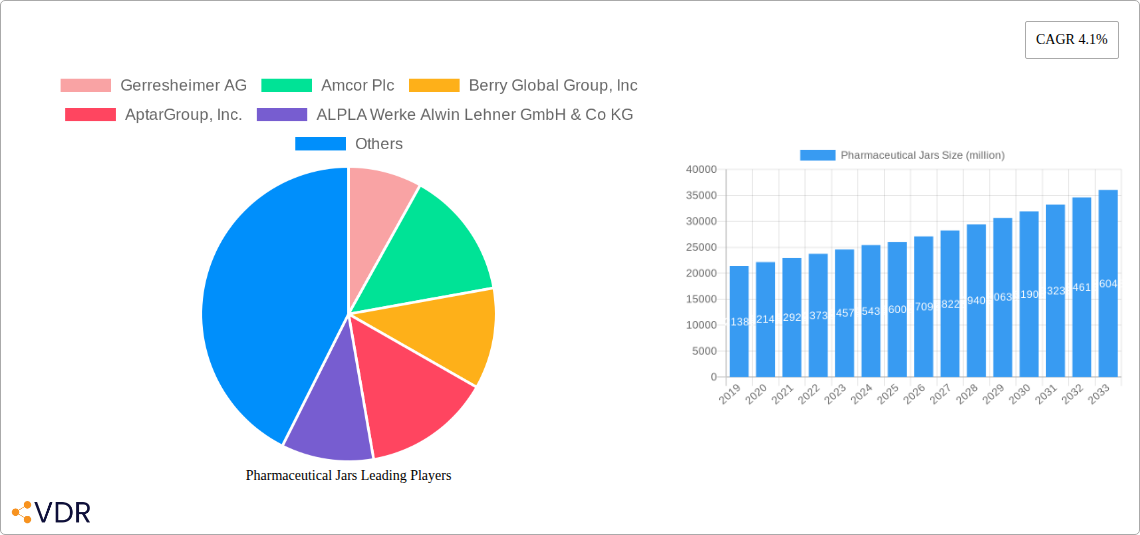
Pharmaceutical Jars Market Size (In Billion)

The pharmaceutical jars market is segmented by application into hospitals, clinics, and others, with hospitals likely representing the largest share due to higher prescription volumes and the diverse range of medications dispensed. By type, the market is divided into plastic and glass jars. While glass offers superior barrier properties and a premium feel, plastic jars are gaining prominence due to their lightweight nature, shatter-resistance, cost-effectiveness, and recyclability, aligning with growing environmental concerns. Key market drivers include the escalating prevalence of chronic diseases worldwide, necessitating continuous drug supply and thus, robust packaging. Furthermore, stringent regulatory frameworks governing pharmaceutical packaging necessitate the use of high-quality, compliant jars, creating a stable demand. The competitive landscape is characterized by the presence of several established global players, including Gerresheimer AG, Amcor Plc, and Berry Global Group, Inc., who are actively involved in research and development, strategic collaborations, and market expansion to cater to evolving customer needs and geographical demands, particularly in rapidly growing regions like Asia Pacific.
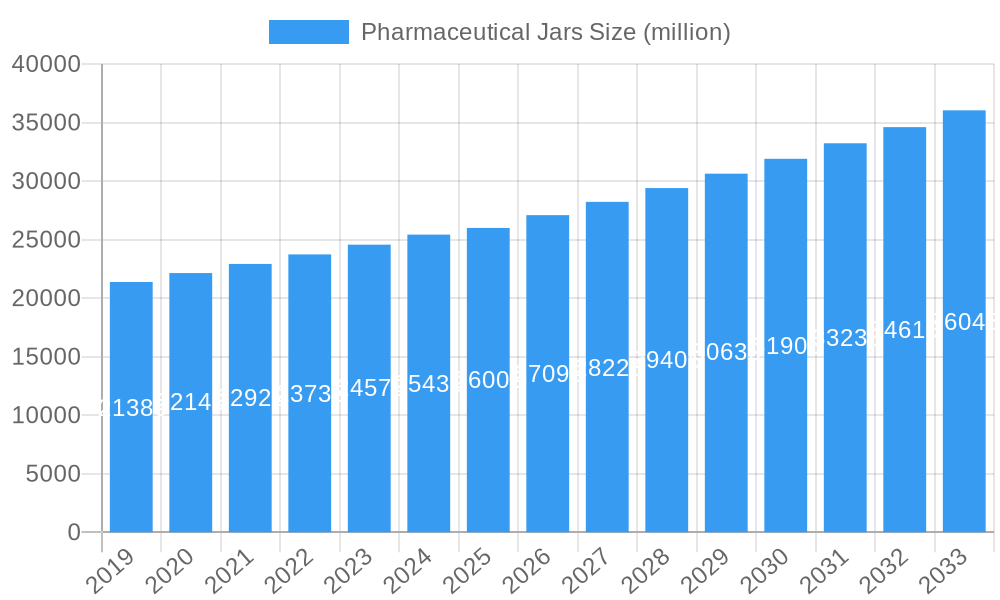
Pharmaceutical Jars Company Market Share
This comprehensive report delves into the intricate dynamics, growth trajectories, and future outlook of the global Pharmaceutical Jars market. Spanning from 2019 to 2033, with a base year of 2025, this analysis leverages extensive data and expert insights to provide actionable intelligence for industry stakeholders. We meticulously examine market segmentation, regional dominance, product innovation, and the interplay of drivers, barriers, and opportunities. This report is your essential guide to navigating the evolving landscape of pharmaceutical packaging solutions.
Pharmaceutical Jars Market Dynamics & Structure
The Pharmaceutical Jars market is characterized by a moderately fragmented structure, with key players like Gerresheimer AG, Amcor Plc, and Berry Global Group, Inc. holding significant market shares. Technological innovation is a primary driver, with advancements in material science leading to more sustainable and tamper-evident packaging solutions. Regulatory frameworks, including stringent FDA and EMA guidelines, significantly influence product development and manufacturing processes, ensuring product safety and efficacy. Competitive product substitutes, such as pharmaceutical pouches and blisters, present a moderate challenge, pushing jar manufacturers to focus on value-added features and specialized designs. End-user demographics are shifting, with an increasing demand for child-resistant and senior-friendly packaging solutions. Mergers and Acquisitions (M&A) trends indicate a consolidation phase, with larger entities acquiring smaller specialized manufacturers to expand their product portfolios and geographical reach. For instance, recent M&A activity has seen a collective volume of approximately 15 million units changing hands as companies strategically enhance their production capacities and market penetration. Barriers to innovation often stem from the high cost of research and development, coupled with the extensive validation processes required for pharmaceutical-grade packaging.
- Market Concentration: Moderate, with a mix of large multinational corporations and specialized regional players.
- Technological Innovation: Focus on sustainable materials, enhanced barrier properties, and smart packaging.
- Regulatory Frameworks: Strict adherence to global pharmaceutical packaging standards is paramount.
- Competitive Substitutes: Pouches and blister packs offer alternative solutions for specific drug formulations.
- End-User Demographics: Growing demand for user-friendly and safe packaging for all age groups.
- M&A Trends: Consolidation to gain market share and technological expertise.
Pharmaceutical Jars Growth Trends & Insights
The Pharmaceutical Jars market is poised for robust growth, driven by the escalating global demand for pharmaceuticals and healthcare services. The market size is projected to expand from an estimated 750 million units in 2025 to over 1000 million units by 2033, exhibiting a Compound Annual Growth Rate (CAGR) of approximately 4.5% during the forecast period. This growth is underpinned by increasing healthcare expenditure in emerging economies and the rising prevalence of chronic diseases, necessitating advanced and reliable drug containment solutions. Adoption rates for innovative packaging, such as those incorporating advanced barrier technologies to preserve drug integrity and extend shelf life, are steadily increasing. Technological disruptions, including the integration of antimicrobial coatings and advanced sealing mechanisms, are further enhancing the value proposition of pharmaceutical jars. Consumer behavior is also evolving, with a greater emphasis on product safety, convenience, and sustainability. Patients and healthcare providers alike are seeking packaging that offers tamper evidence, ease of use, and minimal environmental impact. The shift towards personalized medicine and the development of novel drug delivery systems are also expected to fuel the demand for specialized pharmaceutical jars tailored to specific formulations and dosages. For instance, the market penetration of child-resistant closures has risen significantly, reflecting a proactive response to safety concerns. The increasing focus on generic drug manufacturing, especially in developing regions, will also contribute to the sustained demand for cost-effective yet reliable pharmaceutical jar solutions. The overall market trajectory indicates a healthy expansion fueled by a confluence of demographic, economic, and technological factors, with a projected market size of 820 million units in the base year of 2025.
Dominant Regions, Countries, or Segments in Pharmaceutical Jars
North America currently stands as the dominant region in the Pharmaceutical Jars market, driven by its advanced healthcare infrastructure, high per capita healthcare spending, and a strong emphasis on pharmaceutical innovation and stringent quality control. The United States, in particular, represents a significant market share due to its large pharmaceutical manufacturing base and substantial demand for a wide array of prescription and over-the-counter medications.
Key Drivers of Dominance in North America:
- Advanced Healthcare Infrastructure: Extensive network of hospitals and clinics ensures continuous demand for pharmaceutical packaging.
- High Pharmaceutical R&D Investment: Leading pharmaceutical companies based in the region drive innovation in drug development and packaging.
- Stringent Regulatory Environment: FDA regulations mandate high-quality, safe, and tamper-evident packaging, fostering the use of premium pharmaceutical jars.
- Consumer Awareness & Demand: A well-informed consumer base prioritizes product safety and convenience, driving demand for sophisticated packaging solutions.
- Economic Policies: Favorable economic conditions and supportive policies for the pharmaceutical industry bolster market growth.
Within North America, the Hospital segment is a primary growth engine, accounting for a substantial portion of the pharmaceutical jar demand. Hospitals require large volumes of jars for various medications, from prescription drugs to diagnostic reagents. The increasing number of surgical procedures and inpatient treatments directly correlates with the demand for sterile and secure pharmaceutical packaging.
Dominance Factors and Growth Potential:
- Market Share: North America holds an estimated 35% of the global pharmaceutical jars market share.
- Growth Potential: While mature, the region continues to grow at a steady pace of 3.8% CAGR, driven by specialized packaging needs for biologics and advanced therapies.
- Plastic Jars: Within this region, plastic jars (estimated 60% market share) dominate due to their durability, cost-effectiveness, and versatility in design, catering to a wide range of applications from solid dosage forms to creams and ointments.
- Glass Jars: Glass jars (estimated 40% market share) remain crucial for sensitive formulations and high-potency drugs where inertness and impermeability are critical.
Asia-Pacific is anticipated to be the fastest-growing region, propelled by its rapidly expanding healthcare sector, increasing disposable incomes, and a growing generic drug market. Emerging economies like China and India are witnessing significant investments in pharmaceutical manufacturing and R&D, leading to a surge in demand for pharmaceutical jars.
Pharmaceutical Jars Product Landscape
The Pharmaceutical Jars product landscape is defined by continuous innovation focused on enhancing drug safety, patient compliance, and supply chain integrity. Manufacturers are introducing lightweight yet durable plastic jars made from high-density polyethylene (HDPE) and polypropylene (PP), offering excellent chemical resistance and cost-effectiveness. Innovations include advanced tamper-evident seals, child-resistant closures, and senior-friendly designs with easy-to-grip surfaces and clear labeling. Furthermore, the industry is witnessing a growing adoption of sustainable materials, with a focus on recycled plastics and bio-based alternatives. Glass jars, particularly for sensitive APIs and high-value pharmaceuticals, continue to be a preferred choice due to their inertness and impermeability, with advancements in glass coatings for improved barrier properties. Unique selling propositions often lie in customization capabilities, offering a wide range of sizes, colors, and dispensing features to meet specific pharmaceutical product requirements.
Key Drivers, Barriers & Challenges in Pharmaceutical Jars
Key Drivers:
- Growing Pharmaceutical Market: The expanding global pharmaceutical industry, driven by an aging population and rising chronic disease prevalence, is the primary catalyst for pharmaceutical jar demand.
- Demand for Safe and Secure Packaging: Stringent regulatory requirements and increasing consumer awareness for product safety and tamper-evidence are pushing for high-quality jar solutions.
- Technological Advancements: Innovations in material science and manufacturing processes, leading to lighter, more durable, and sustainable packaging options.
- Rise of Generic Drugs: The expanding generic drug market, particularly in emerging economies, creates a substantial demand for cost-effective and reliable pharmaceutical jars.
Key Barriers & Challenges:
- Supply Chain Disruptions: Global supply chain vulnerabilities, raw material price volatility, and logistics challenges can impact production and delivery timelines. The estimated impact of such disruptions can lead to a 5-10% increase in production costs.
- Stringent Regulatory Compliance: Navigating and adhering to evolving international and regional pharmaceutical packaging regulations requires significant investment and can be a lengthy process.
- Competition from Alternative Packaging: The presence of pharmaceutical pouches, blisters, and other novel packaging formats presents ongoing competition.
- Cost Pressures: Pharmaceutical companies constantly seek cost-effective packaging solutions, creating pressure on jar manufacturers to optimize their production processes and pricing strategies.
Emerging Opportunities in Pharmaceutical Jars
Emerging opportunities in the Pharmaceutical Jars market lie in the development of smart packaging solutions that can monitor temperature, humidity, and shock, providing real-time data on drug integrity. The growing demand for sustainable and eco-friendly packaging presents a significant opportunity for manufacturers adopting recycled materials and bio-based alternatives. Furthermore, the expansion of telemedicine and home healthcare services is driving the need for smaller, more convenient, and user-friendly pharmaceutical jars for dispensing medications directly to patients. Untapped markets in developing regions with burgeoning healthcare sectors also offer substantial growth potential.
Growth Accelerators in the Pharmaceutical Jars Industry
Growth accelerators for the Pharmaceutical Jars industry are intrinsically linked to advancements in material science, leading to the development of enhanced barrier properties and antimicrobial coatings that extend drug shelf life and efficacy. Strategic partnerships between pharmaceutical companies and packaging manufacturers are crucial for co-developing innovative solutions tailored to new drug formulations. Market expansion strategies, particularly focusing on emerging economies with rapidly growing healthcare sectors, will significantly contribute to long-term growth. Furthermore, the increasing adoption of automated filling and packaging lines by pharmaceutical companies will create demand for standardized and high-volume pharmaceutical jar solutions.
Key Players Shaping the Pharmaceutical Jars Market
- Gerresheimer AG
- Amcor Plc
- Berry Global Group, Inc
- AptarGroup, Inc.
- ALPLA Werke Alwin Lehner GmbH & Co KG
- Alpha Packaging, Inc.
- RPC M&H Plastics Ltd.
- Graham Packaging Company Inc.
- Resilux NV
- Drug Plastics & Glass Co., Inc.
- Pretium Packaging, LLC
- Silgan Holdings Inc.
- O. Berk Company, LLC
- Bormioli Pharma S.p.a.
- C.L. Smith Company
- PACCOR International GmbH
- Pro-Pac Packaging Group Pty Ltd
- Comar LLC
- Weener Plastics Group BV
Notable Milestones in Pharmaceutical Jars Sector
- 2019: Introduction of advanced child-resistant closure technologies by leading manufacturers, enhancing child safety standards.
- 2020: Increased focus on sustainable packaging materials, with several companies launching lines utilizing recycled PET.
- 2021: Emergence of smart pharmaceutical jars with integrated RFID tags for enhanced track-and-trace capabilities.
- 2022: Significant M&A activity as larger players consolidated to expand their product portfolios and global reach.
- 2023: Development of novel barrier coatings for glass jars, improving drug stability and shelf-life for sensitive formulations.
- 2024: Greater emphasis on antimicrobial properties in plastic jar materials to reduce contamination risks.
In-Depth Pharmaceutical Jars Market Outlook
The future of the Pharmaceutical Jars market is characterized by sustained growth, driven by a confluence of factors including an expanding global pharmaceutical pipeline, an aging demographic, and a persistent demand for safe, reliable, and compliant packaging solutions. Key growth accelerators will include the continued integration of advanced materials that offer superior barrier properties and enhanced sustainability credentials, catering to the growing environmental consciousness of both consumers and regulatory bodies. Strategic collaborations between pharmaceutical manufacturers and packaging innovators will be paramount in developing bespoke solutions for novel drug delivery systems and specialized therapies. The burgeoning healthcare markets in emerging economies present substantial opportunities for market expansion, necessitating the adaptation of packaging solutions to meet local needs and regulatory landscapes. The overall outlook points towards a dynamic and evolving market, where innovation, sustainability, and regulatory adherence will remain critical for success, with a projected market size of 980 million units by 2033.
Pharmaceutical Jars Segmentation
-
1. Application
- 1.1. Hospital
- 1.2. Clinic
- 1.3. Others
-
2. Type
- 2.1. Plastic
- 2.2. Glass
Pharmaceutical Jars Segmentation By Geography
-
1. North America
- 1.1. United States
- 1.2. Canada
- 1.3. Mexico
-
2. South America
- 2.1. Brazil
- 2.2. Argentina
- 2.3. Rest of South America
-
3. Europe
- 3.1. United Kingdom
- 3.2. Germany
- 3.3. France
- 3.4. Italy
- 3.5. Spain
- 3.6. Russia
- 3.7. Benelux
- 3.8. Nordics
- 3.9. Rest of Europe
-
4. Middle East & Africa
- 4.1. Turkey
- 4.2. Israel
- 4.3. GCC
- 4.4. North Africa
- 4.5. South Africa
- 4.6. Rest of Middle East & Africa
-
5. Asia Pacific
- 5.1. China
- 5.2. India
- 5.3. Japan
- 5.4. South Korea
- 5.5. ASEAN
- 5.6. Oceania
- 5.7. Rest of Asia Pacific
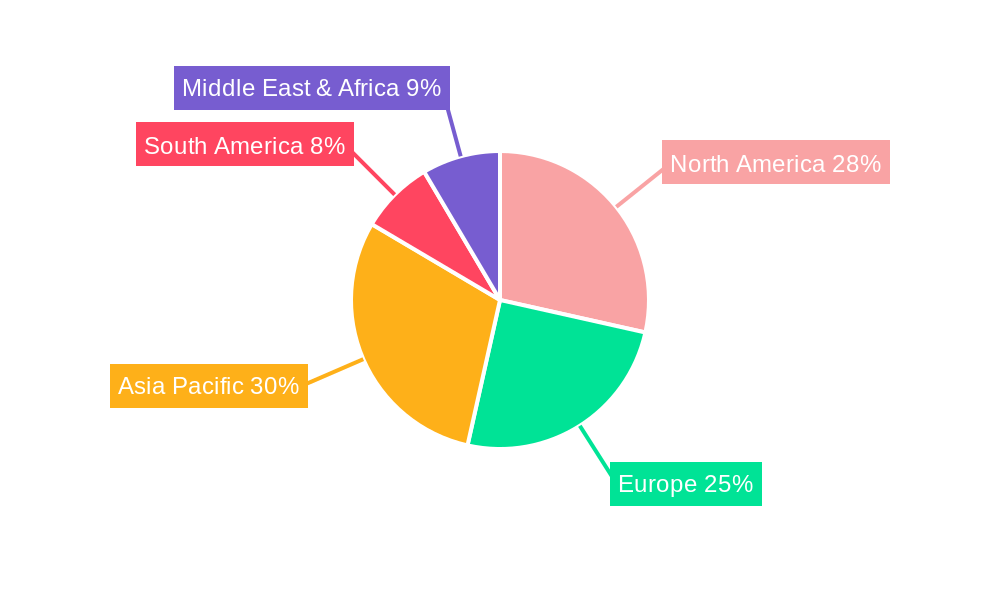
Pharmaceutical Jars Regional Market Share
Geographic Coverage of Pharmaceutical Jars
Pharmaceutical Jars REPORT HIGHLIGHTS
| Aspects | Details |
|---|---|
| Study Period | 2020-2034 |
| Base Year | 2025 |
| Estimated Year | 2026 |
| Forecast Period | 2026-2034 |
| Historical Period | 2020-2025 |
| Growth Rate | CAGR of 15.8% from 2020-2034 |
| Segmentation |
|
Table of Contents
- 1. Introduction
- 1.1. Research Scope
- 1.2. Market Segmentation
- 1.3. Research Objective
- 1.4. Definitions and Assumptions
- 2. Executive Summary
- 2.1. Market Snapshot
- 3. Market Dynamics
- 3.1. Market Drivers
- 3.2. Market Restrains
- 3.3. Market Trends
- 3.4. Market Opportunities
- 4. Market Factor Analysis
- 4.1. Porters Five Forces
- 4.1.1. Bargaining Power of Suppliers
- 4.1.2. Bargaining Power of Buyers
- 4.1.3. Threat of New Entrants
- 4.1.4. Threat of Substitutes
- 4.1.5. Competitive Rivalry
- 4.2. PESTEL analysis
- 4.3. BCG Analysis
- 4.3.1. Stars (High Growth, High Market Share)
- 4.3.2. Cash Cows (Low Growth, High Market Share)
- 4.3.3. Question Mark (High Growth, Low Market Share)
- 4.3.4. Dogs (Low Growth, Low Market Share)
- 4.4. Ansoff Matrix Analysis
- 4.5. Supply Chain Analysis
- 4.6. Regulatory Landscape
- 4.7. Current Market Potential and Opportunity Assessment (TAM–SAM–SOM Framework)
- 4.8. VDR Analyst Note
- 4.1. Porters Five Forces
- 5. Market Analysis, Insights and Forecast 2021-2033
- 5.1. Market Analysis, Insights and Forecast - by Application
- 5.1.1. Hospital
- 5.1.2. Clinic
- 5.1.3. Others
- 5.2. Market Analysis, Insights and Forecast - by Type
- 5.2.1. Plastic
- 5.2.2. Glass
- 5.3. Market Analysis, Insights and Forecast - by Region
- 5.3.1. North America
- 5.3.2. South America
- 5.3.3. Europe
- 5.3.4. Middle East & Africa
- 5.3.5. Asia Pacific
- 5.1. Market Analysis, Insights and Forecast - by Application
- 6. Global Pharmaceutical Jars Analysis, Insights and Forecast, 2021-2033
- 6.1. Market Analysis, Insights and Forecast - by Application
- 6.1.1. Hospital
- 6.1.2. Clinic
- 6.1.3. Others
- 6.2. Market Analysis, Insights and Forecast - by Type
- 6.2.1. Plastic
- 6.2.2. Glass
- 6.1. Market Analysis, Insights and Forecast - by Application
- 7. North America Pharmaceutical Jars Analysis, Insights and Forecast, 2021-2033
- 7.1. Market Analysis, Insights and Forecast - by Application
- 7.1.1. Hospital
- 7.1.2. Clinic
- 7.1.3. Others
- 7.2. Market Analysis, Insights and Forecast - by Type
- 7.2.1. Plastic
- 7.2.2. Glass
- 7.1. Market Analysis, Insights and Forecast - by Application
- 8. South America Pharmaceutical Jars Analysis, Insights and Forecast, 2021-2033
- 8.1. Market Analysis, Insights and Forecast - by Application
- 8.1.1. Hospital
- 8.1.2. Clinic
- 8.1.3. Others
- 8.2. Market Analysis, Insights and Forecast - by Type
- 8.2.1. Plastic
- 8.2.2. Glass
- 8.1. Market Analysis, Insights and Forecast - by Application
- 9. Europe Pharmaceutical Jars Analysis, Insights and Forecast, 2021-2033
- 9.1. Market Analysis, Insights and Forecast - by Application
- 9.1.1. Hospital
- 9.1.2. Clinic
- 9.1.3. Others
- 9.2. Market Analysis, Insights and Forecast - by Type
- 9.2.1. Plastic
- 9.2.2. Glass
- 9.1. Market Analysis, Insights and Forecast - by Application
- 10. Middle East & Africa Pharmaceutical Jars Analysis, Insights and Forecast, 2021-2033
- 10.1. Market Analysis, Insights and Forecast - by Application
- 10.1.1. Hospital
- 10.1.2. Clinic
- 10.1.3. Others
- 10.2. Market Analysis, Insights and Forecast - by Type
- 10.2.1. Plastic
- 10.2.2. Glass
- 10.1. Market Analysis, Insights and Forecast - by Application
- 11. Asia Pacific Pharmaceutical Jars Analysis, Insights and Forecast, 2021-2033
- 11.1. Market Analysis, Insights and Forecast - by Application
- 11.1.1. Hospital
- 11.1.2. Clinic
- 11.1.3. Others
- 11.2. Market Analysis, Insights and Forecast - by Type
- 11.2.1. Plastic
- 11.2.2. Glass
- 11.1. Market Analysis, Insights and Forecast - by Application
- 12. Competitive Analysis
- 12.1. Company Profiles
- 12.1.1 Gerresheimer AG
- 12.1.1.1. Company Overview
- 12.1.1.2. Products
- 12.1.1.3. Company Financials
- 12.1.1.4. SWOT Analysis
- 12.1.2 Amcor Plc
- 12.1.2.1. Company Overview
- 12.1.2.2. Products
- 12.1.2.3. Company Financials
- 12.1.2.4. SWOT Analysis
- 12.1.3 Berry Global Group Inc
- 12.1.3.1. Company Overview
- 12.1.3.2. Products
- 12.1.3.3. Company Financials
- 12.1.3.4. SWOT Analysis
- 12.1.4 AptarGroup Inc.
- 12.1.4.1. Company Overview
- 12.1.4.2. Products
- 12.1.4.3. Company Financials
- 12.1.4.4. SWOT Analysis
- 12.1.5 ALPLA Werke Alwin Lehner GmbH & Co KG
- 12.1.5.1. Company Overview
- 12.1.5.2. Products
- 12.1.5.3. Company Financials
- 12.1.5.4. SWOT Analysis
- 12.1.6 Alpha Packaging Inc.
- 12.1.6.1. Company Overview
- 12.1.6.2. Products
- 12.1.6.3. Company Financials
- 12.1.6.4. SWOT Analysis
- 12.1.7 RPC M&H Plastics Ltd.
- 12.1.7.1. Company Overview
- 12.1.7.2. Products
- 12.1.7.3. Company Financials
- 12.1.7.4. SWOT Analysis
- 12.1.8 Graham Packaging Company Inc.
- 12.1.8.1. Company Overview
- 12.1.8.2. Products
- 12.1.8.3. Company Financials
- 12.1.8.4. SWOT Analysis
- 12.1.9 Resilux NV Drug Plastics & Glass Co.
- 12.1.9.1. Company Overview
- 12.1.9.2. Products
- 12.1.9.3. Company Financials
- 12.1.9.4. SWOT Analysis
- 12.1.10 Inc.
- 12.1.10.1. Company Overview
- 12.1.10.2. Products
- 12.1.10.3. Company Financials
- 12.1.10.4. SWOT Analysis
- 12.1.11 Pretium Packaging LLC
- 12.1.11.1. Company Overview
- 12.1.11.2. Products
- 12.1.11.3. Company Financials
- 12.1.11.4. SWOT Analysis
- 12.1.12 Silgan Holdings Inc. O. Berk Company
- 12.1.12.1. Company Overview
- 12.1.12.2. Products
- 12.1.12.3. Company Financials
- 12.1.12.4. SWOT Analysis
- 12.1.13 LLC
- 12.1.13.1. Company Overview
- 12.1.13.2. Products
- 12.1.13.3. Company Financials
- 12.1.13.4. SWOT Analysis
- 12.1.14 Bormioli Pharma S.p.a.
- 12.1.14.1. Company Overview
- 12.1.14.2. Products
- 12.1.14.3. Company Financials
- 12.1.14.4. SWOT Analysis
- 12.1.15 C.L. Smith Company
- 12.1.15.1. Company Overview
- 12.1.15.2. Products
- 12.1.15.3. Company Financials
- 12.1.15.4. SWOT Analysis
- 12.1.16 PACCOR International GmbH
- 12.1.16.1. Company Overview
- 12.1.16.2. Products
- 12.1.16.3. Company Financials
- 12.1.16.4. SWOT Analysis
- 12.1.17 Pro-Pac Packaging Group Pty Ltd
- 12.1.17.1. Company Overview
- 12.1.17.2. Products
- 12.1.17.3. Company Financials
- 12.1.17.4. SWOT Analysis
- 12.1.18 Comar LLC
- 12.1.18.1. Company Overview
- 12.1.18.2. Products
- 12.1.18.3. Company Financials
- 12.1.18.4. SWOT Analysis
- 12.1.19 Weener Plastics Group BV.
- 12.1.19.1. Company Overview
- 12.1.19.2. Products
- 12.1.19.3. Company Financials
- 12.1.19.4. SWOT Analysis
- 12.1.1 Gerresheimer AG
- 12.2. Market Entropy
- 12.2.1 Company's Key Areas Served
- 12.2.2 Recent Developments
- 12.3. Company Market Share Analysis 2025
- 12.3.1 Top 5 Companies Market Share Analysis
- 12.3.2 Top 3 Companies Market Share Analysis
- 12.4. List of Potential Customers
- 13. Research Methodology
List of Figures
- Figure 1: Global Pharmaceutical Jars Revenue Breakdown (billion, %) by Region 2025 & 2033
- Figure 2: North America Pharmaceutical Jars Revenue (billion), by Application 2025 & 2033
- Figure 3: North America Pharmaceutical Jars Revenue Share (%), by Application 2025 & 2033
- Figure 4: North America Pharmaceutical Jars Revenue (billion), by Type 2025 & 2033
- Figure 5: North America Pharmaceutical Jars Revenue Share (%), by Type 2025 & 2033
- Figure 6: North America Pharmaceutical Jars Revenue (billion), by Country 2025 & 2033
- Figure 7: North America Pharmaceutical Jars Revenue Share (%), by Country 2025 & 2033
- Figure 8: South America Pharmaceutical Jars Revenue (billion), by Application 2025 & 2033
- Figure 9: South America Pharmaceutical Jars Revenue Share (%), by Application 2025 & 2033
- Figure 10: South America Pharmaceutical Jars Revenue (billion), by Type 2025 & 2033
- Figure 11: South America Pharmaceutical Jars Revenue Share (%), by Type 2025 & 2033
- Figure 12: South America Pharmaceutical Jars Revenue (billion), by Country 2025 & 2033
- Figure 13: South America Pharmaceutical Jars Revenue Share (%), by Country 2025 & 2033
- Figure 14: Europe Pharmaceutical Jars Revenue (billion), by Application 2025 & 2033
- Figure 15: Europe Pharmaceutical Jars Revenue Share (%), by Application 2025 & 2033
- Figure 16: Europe Pharmaceutical Jars Revenue (billion), by Type 2025 & 2033
- Figure 17: Europe Pharmaceutical Jars Revenue Share (%), by Type 2025 & 2033
- Figure 18: Europe Pharmaceutical Jars Revenue (billion), by Country 2025 & 2033
- Figure 19: Europe Pharmaceutical Jars Revenue Share (%), by Country 2025 & 2033
- Figure 20: Middle East & Africa Pharmaceutical Jars Revenue (billion), by Application 2025 & 2033
- Figure 21: Middle East & Africa Pharmaceutical Jars Revenue Share (%), by Application 2025 & 2033
- Figure 22: Middle East & Africa Pharmaceutical Jars Revenue (billion), by Type 2025 & 2033
- Figure 23: Middle East & Africa Pharmaceutical Jars Revenue Share (%), by Type 2025 & 2033
- Figure 24: Middle East & Africa Pharmaceutical Jars Revenue (billion), by Country 2025 & 2033
- Figure 25: Middle East & Africa Pharmaceutical Jars Revenue Share (%), by Country 2025 & 2033
- Figure 26: Asia Pacific Pharmaceutical Jars Revenue (billion), by Application 2025 & 2033
- Figure 27: Asia Pacific Pharmaceutical Jars Revenue Share (%), by Application 2025 & 2033
- Figure 28: Asia Pacific Pharmaceutical Jars Revenue (billion), by Type 2025 & 2033
- Figure 29: Asia Pacific Pharmaceutical Jars Revenue Share (%), by Type 2025 & 2033
- Figure 30: Asia Pacific Pharmaceutical Jars Revenue (billion), by Country 2025 & 2033
- Figure 31: Asia Pacific Pharmaceutical Jars Revenue Share (%), by Country 2025 & 2033
List of Tables
- Table 1: Global Pharmaceutical Jars Revenue billion Forecast, by Application 2020 & 2033
- Table 2: Global Pharmaceutical Jars Revenue billion Forecast, by Type 2020 & 2033
- Table 3: Global Pharmaceutical Jars Revenue billion Forecast, by Region 2020 & 2033
- Table 4: Global Pharmaceutical Jars Revenue billion Forecast, by Application 2020 & 2033
- Table 5: Global Pharmaceutical Jars Revenue billion Forecast, by Type 2020 & 2033
- Table 6: Global Pharmaceutical Jars Revenue billion Forecast, by Country 2020 & 2033
- Table 7: United States Pharmaceutical Jars Revenue (billion) Forecast, by Application 2020 & 2033
- Table 8: Canada Pharmaceutical Jars Revenue (billion) Forecast, by Application 2020 & 2033
- Table 9: Mexico Pharmaceutical Jars Revenue (billion) Forecast, by Application 2020 & 2033
- Table 10: Global Pharmaceutical Jars Revenue billion Forecast, by Application 2020 & 2033
- Table 11: Global Pharmaceutical Jars Revenue billion Forecast, by Type 2020 & 2033
- Table 12: Global Pharmaceutical Jars Revenue billion Forecast, by Country 2020 & 2033
- Table 13: Brazil Pharmaceutical Jars Revenue (billion) Forecast, by Application 2020 & 2033
- Table 14: Argentina Pharmaceutical Jars Revenue (billion) Forecast, by Application 2020 & 2033
- Table 15: Rest of South America Pharmaceutical Jars Revenue (billion) Forecast, by Application 2020 & 2033
- Table 16: Global Pharmaceutical Jars Revenue billion Forecast, by Application 2020 & 2033
- Table 17: Global Pharmaceutical Jars Revenue billion Forecast, by Type 2020 & 2033
- Table 18: Global Pharmaceutical Jars Revenue billion Forecast, by Country 2020 & 2033
- Table 19: United Kingdom Pharmaceutical Jars Revenue (billion) Forecast, by Application 2020 & 2033
- Table 20: Germany Pharmaceutical Jars Revenue (billion) Forecast, by Application 2020 & 2033
- Table 21: France Pharmaceutical Jars Revenue (billion) Forecast, by Application 2020 & 2033
- Table 22: Italy Pharmaceutical Jars Revenue (billion) Forecast, by Application 2020 & 2033
- Table 23: Spain Pharmaceutical Jars Revenue (billion) Forecast, by Application 2020 & 2033
- Table 24: Russia Pharmaceutical Jars Revenue (billion) Forecast, by Application 2020 & 2033
- Table 25: Benelux Pharmaceutical Jars Revenue (billion) Forecast, by Application 2020 & 2033
- Table 26: Nordics Pharmaceutical Jars Revenue (billion) Forecast, by Application 2020 & 2033
- Table 27: Rest of Europe Pharmaceutical Jars Revenue (billion) Forecast, by Application 2020 & 2033
- Table 28: Global Pharmaceutical Jars Revenue billion Forecast, by Application 2020 & 2033
- Table 29: Global Pharmaceutical Jars Revenue billion Forecast, by Type 2020 & 2033
- Table 30: Global Pharmaceutical Jars Revenue billion Forecast, by Country 2020 & 2033
- Table 31: Turkey Pharmaceutical Jars Revenue (billion) Forecast, by Application 2020 & 2033
- Table 32: Israel Pharmaceutical Jars Revenue (billion) Forecast, by Application 2020 & 2033
- Table 33: GCC Pharmaceutical Jars Revenue (billion) Forecast, by Application 2020 & 2033
- Table 34: North Africa Pharmaceutical Jars Revenue (billion) Forecast, by Application 2020 & 2033
- Table 35: South Africa Pharmaceutical Jars Revenue (billion) Forecast, by Application 2020 & 2033
- Table 36: Rest of Middle East & Africa Pharmaceutical Jars Revenue (billion) Forecast, by Application 2020 & 2033
- Table 37: Global Pharmaceutical Jars Revenue billion Forecast, by Application 2020 & 2033
- Table 38: Global Pharmaceutical Jars Revenue billion Forecast, by Type 2020 & 2033
- Table 39: Global Pharmaceutical Jars Revenue billion Forecast, by Country 2020 & 2033
- Table 40: China Pharmaceutical Jars Revenue (billion) Forecast, by Application 2020 & 2033
- Table 41: India Pharmaceutical Jars Revenue (billion) Forecast, by Application 2020 & 2033
- Table 42: Japan Pharmaceutical Jars Revenue (billion) Forecast, by Application 2020 & 2033
- Table 43: South Korea Pharmaceutical Jars Revenue (billion) Forecast, by Application 2020 & 2033
- Table 44: ASEAN Pharmaceutical Jars Revenue (billion) Forecast, by Application 2020 & 2033
- Table 45: Oceania Pharmaceutical Jars Revenue (billion) Forecast, by Application 2020 & 2033
- Table 46: Rest of Asia Pacific Pharmaceutical Jars Revenue (billion) Forecast, by Application 2020 & 2033
Frequently Asked Questions
1. What is the projected Compound Annual Growth Rate (CAGR) of the Pharmaceutical Jars?
The projected CAGR is approximately 15.8%.
2. Which companies are prominent players in the Pharmaceutical Jars?
Key companies in the market include Gerresheimer AG, Amcor Plc, Berry Global Group, Inc, AptarGroup, Inc., ALPLA Werke Alwin Lehner GmbH & Co KG, Alpha Packaging, Inc., RPC M&H Plastics Ltd., Graham Packaging Company Inc., Resilux NV, Drug Plastics & Glass Co., Inc., Pretium Packaging, LLC, Silgan Holdings Inc., O. Berk Company, LLC, Bormioli Pharma S.p.a., C.L. Smith Company, PACCOR International GmbH, Pro-Pac Packaging Group Pty Ltd,, Comar LLC, Weener Plastics Group BV..
3. What are the main segments of the Pharmaceutical Jars?
The market segments include Application, Type.
4. Can you provide details about the market size?
The market size is estimated to be USD 174.85 billion as of 2022.
5. What are some drivers contributing to market growth?
N/A
6. What are the notable trends driving market growth?
N/A
7. Are there any restraints impacting market growth?
N/A
8. Can you provide examples of recent developments in the market?
N/A
9. What pricing options are available for accessing the report?
Pricing options include single-user, multi-user, and enterprise licenses priced at USD 4250.00, USD 6375.00, and USD 8500.00 respectively.
10. Is the market size provided in terms of value or volume?
The market size is provided in terms of value, measured in billion.
11. Are there any specific market keywords associated with the report?
Yes, the market keyword associated with the report is "Pharmaceutical Jars," which aids in identifying and referencing the specific market segment covered.
12. How do I determine which pricing option suits my needs best?
The pricing options vary based on user requirements and access needs. Individual users may opt for single-user licenses, while businesses requiring broader access may choose multi-user or enterprise licenses for cost-effective access to the report.
13. Are there any additional resources or data provided in the Pharmaceutical Jars report?
While the report offers comprehensive insights, it's advisable to review the specific contents or supplementary materials provided to ascertain if additional resources or data are available.
14. How can I stay updated on further developments or reports in the Pharmaceutical Jars?
To stay informed about further developments, trends, and reports in the Pharmaceutical Jars, consider subscribing to industry newsletters, following relevant companies and organizations, or regularly checking reputable industry news sources and publications.
Methodology
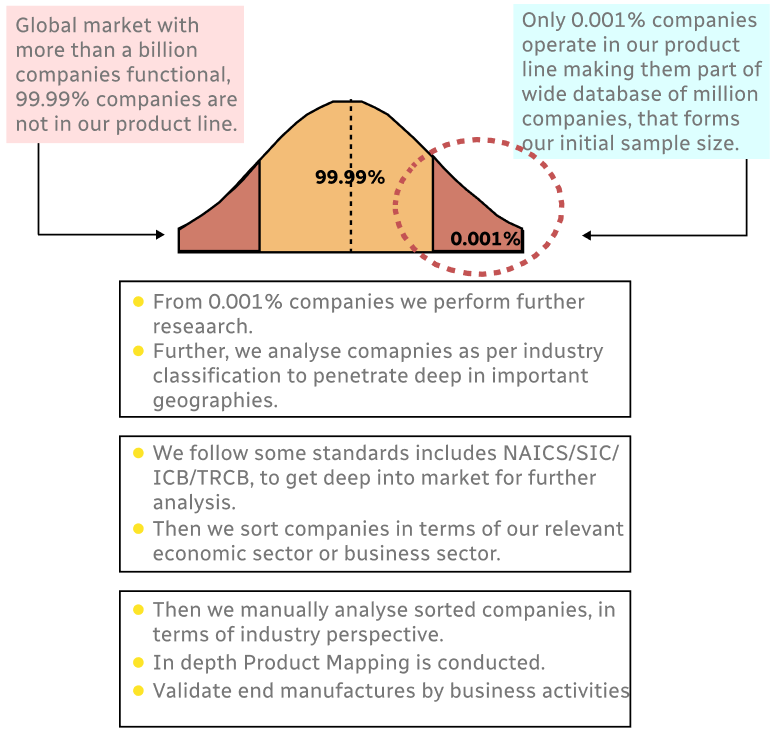
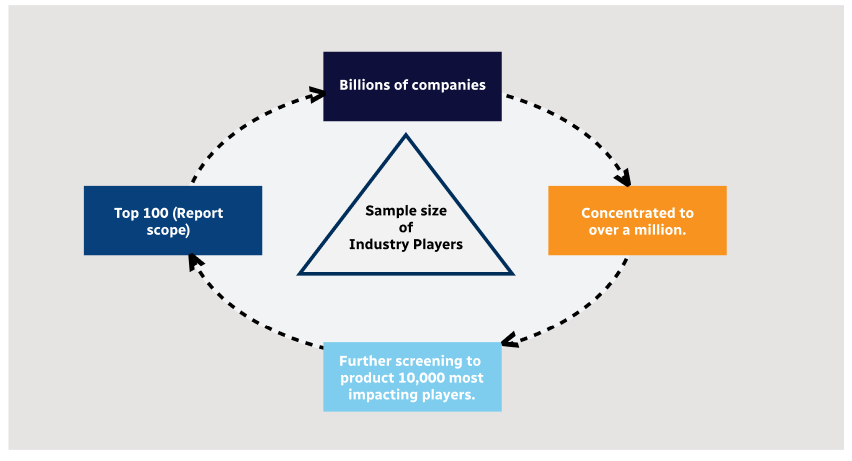
Step 1 - Identification of Relevant Samples Size from Population Database
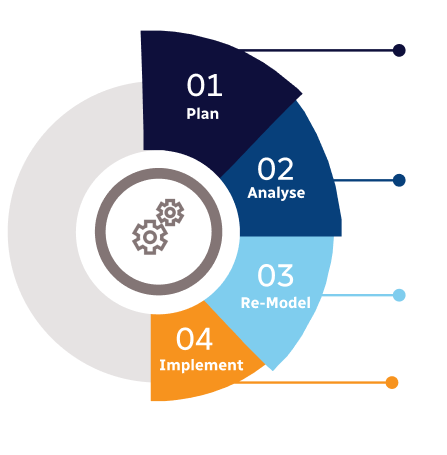
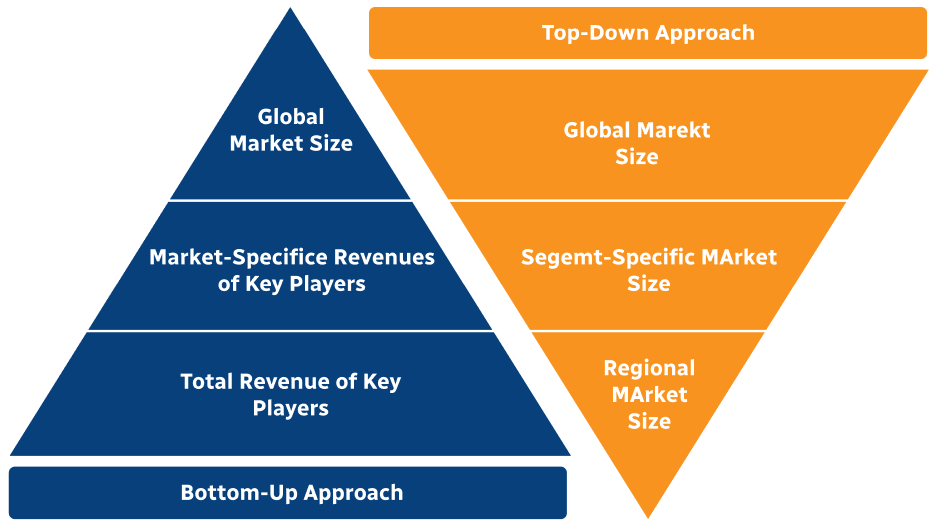
Step 2 - Approaches for Defining Global Market Size (Value, Volume* & Price*)
Note*: In applicable scenarios
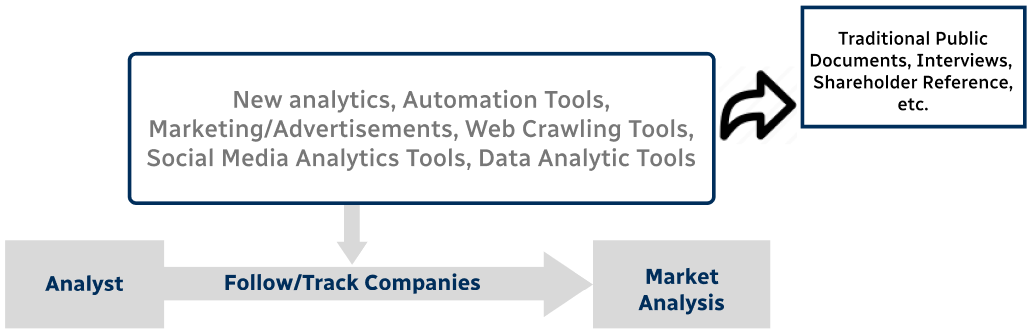
Step 3 - Data Sources
Primary Research
- Web Analytics
- Survey Reports
- Research Institute
- Latest Research Reports
- Opinion Leaders
Secondary Research
- Annual Reports
- White Paper
- Latest Press Release
- Industry Association
- Paid Database
- Investor Presentations
Step 4 - Data Triangulation
Involves using different sources of information in order to increase the validity of a study
These sources are likely to be stakeholders in a program - participants, other researchers, program staff, other community members, and so on.
Then we put all data in single framework & apply various statistical tools to find out the dynamic on the market.
During the analysis stage, feedback from the stakeholder groups would be compared to determine areas of agreement as well as areas of divergence