


Key Insights
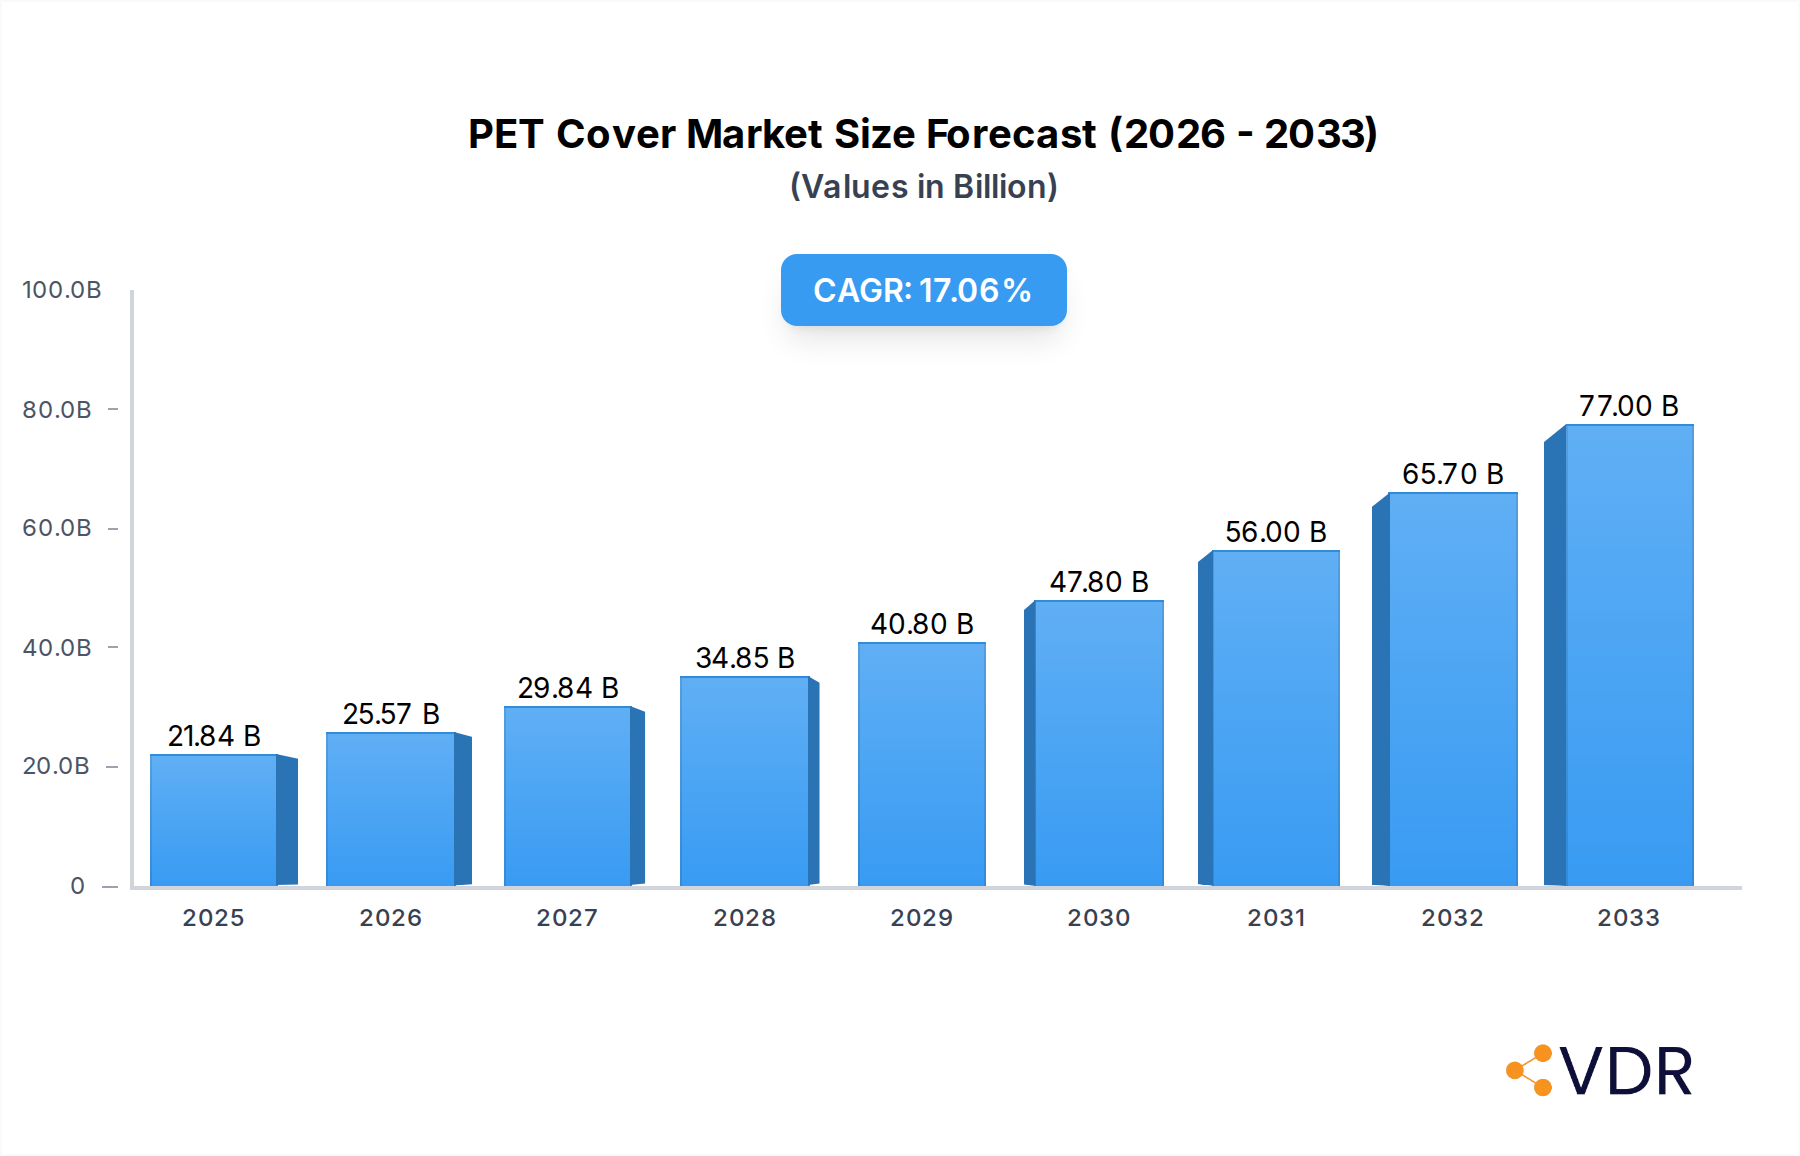
The global PET Cover market is poised for substantial expansion, driven by its diverse applications and increasing demand across key industries. Valued at an estimated $21.84 billion in 2025, the market is projected to witness a robust Compound Annual Growth Rate (CAGR) of 17.53% during the forecast period of 2025-2033. This significant growth trajectory is primarily fueled by the burgeoning food and beverage sector, where PET covers offer superior clarity, durability, and barrier properties crucial for packaging perishable goods and maintaining product freshness. The pharmaceutical industry's reliance on sterile and tamper-evident packaging further bolsters demand, while the cosmetics sector benefits from the aesthetic appeal and reusability of PET covers for various beauty products. Emerging economies, particularly in the Asia Pacific region, are emerging as major consumption hubs due to rapid industrialization and a growing middle class with increasing purchasing power.
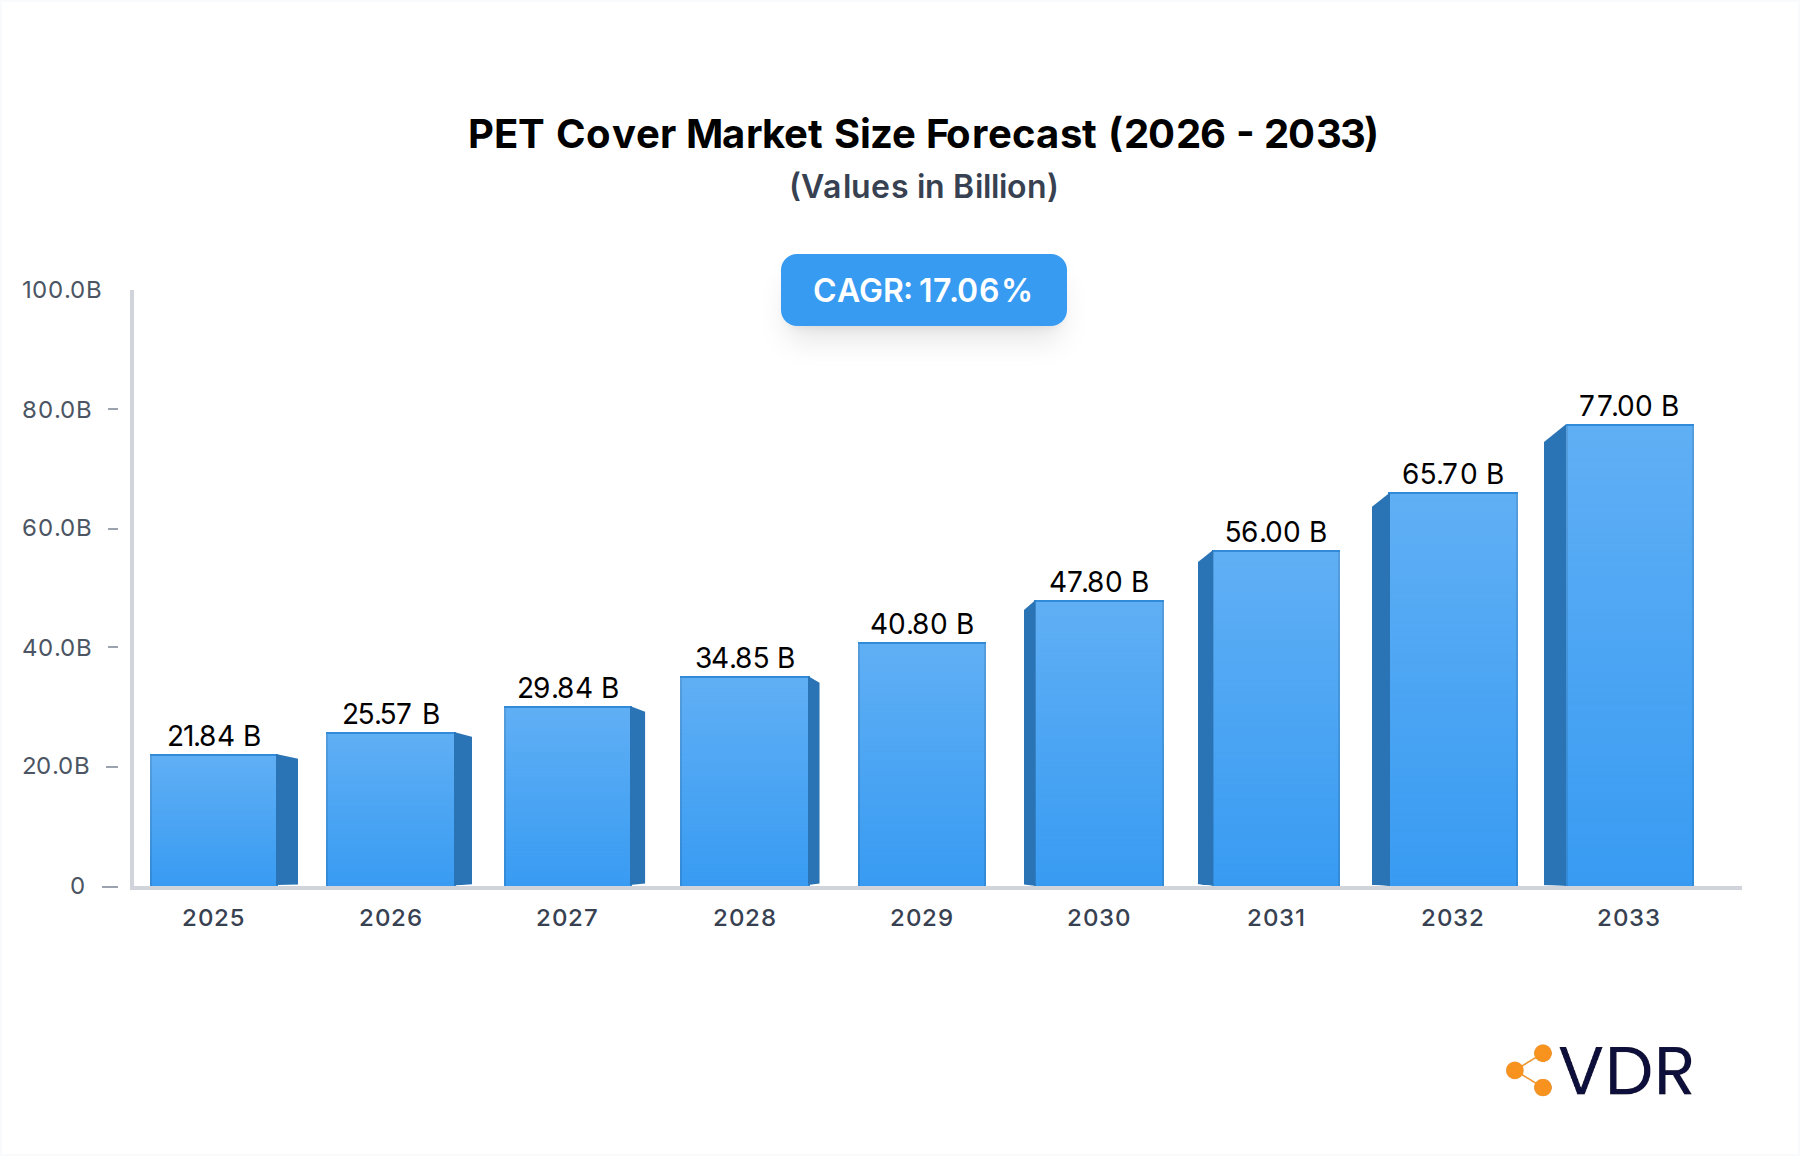
PET Cover Market Size (In Billion)

The market's dynamism is further shaped by evolving consumer preferences towards sustainable and convenient packaging solutions. Advancements in PET manufacturing technologies are leading to the development of lighter, stronger, and more eco-friendly cover designs, addressing environmental concerns and regulatory pressures. While the market is characterized by strong growth, certain factors may present challenges. The rising cost of raw materials, coupled with increasing competition from alternative packaging materials like paper-based or biodegradable options, could influence pricing and market share dynamics. However, the inherent advantages of PET, including its recyclability and cost-effectiveness in many applications, are expected to sustain its dominance. Key players are actively investing in research and development to enhance product features and expand their global footprint, indicating a competitive landscape focused on innovation and market penetration.
PET Cover Company Market Share
Report Description: Global PET Cover Market Analysis 2019–2033
This comprehensive report delves into the dynamic global PET Cover market, providing an in-depth analysis from 2019 to 2033. Covering market structure, growth trends, regional dominance, product landscape, key drivers, emerging opportunities, growth accelerators, and a detailed outlook, this study is an essential resource for industry professionals, investors, and stakeholders seeking to understand and capitalize on the evolving PET Cover sector. The report leverages extensive data from the Base Year (2025) and forecasts significant growth through the Forecast Period (2025–2033), offering actionable insights based on Historical Period data (2019–2024).
PET Cover Market Dynamics & Structure
The global PET Cover market is characterized by a moderate level of concentration, with key players such as Amcor, Indorama Ventures Public, Retal, and Manjushree holding significant market shares. Technological innovation is a primary driver, with advancements in material science and manufacturing processes leading to enhanced barrier properties, recyclability, and aesthetic appeal for PET covers. Regulatory frameworks, particularly those concerning food contact safety and plastic waste management, play a crucial role in shaping market dynamics. The growing emphasis on sustainable packaging solutions is influencing product development and consumer choice. Competitive product substitutes, including other plastic types and alternative packaging materials, pose a constant challenge, pushing manufacturers to innovate and differentiate their offerings. End-user demographics, driven by evolving consumer preferences for convenience, product visibility, and sustainable packaging, are also influencing demand. Mergers and acquisitions (M&A) trends are observed as companies seek to expand their market reach, acquire new technologies, and achieve economies of scale. For instance, the recent M&A activity in the plastic packaging sector, involving companies like Indorama Ventures, highlights a strategic push for consolidation and market leadership. Innovation barriers include the high cost of research and development for novel materials and the capital investment required for upgrading manufacturing facilities.
- Market Concentration: Moderate, with a few major players dominating.
- Technological Innovation Drivers: Enhanced barrier properties, recyclability, aesthetics, automation in production.
- Regulatory Frameworks: Food safety standards (e.g., FDA, EFSA), environmental regulations (e.g., EPR schemes, single-use plastic bans).
- Competitive Product Substitutes: PP covers, aluminum lids, paper-based packaging.
- End-User Demographics: Growing demand for convenience in food, increased awareness of product safety in pharmaceuticals, and aesthetic appeal in cosmetics.
- M&A Trends: Consolidation for market share, technology acquisition, and vertical integration.
- Innovation Barriers: High R&D costs, capital expenditure for new technologies, stringent regulatory approvals.
PET Cover Growth Trends & Insights
The global PET Cover market is poised for substantial growth, projected to expand at a Compound Annual Growth Rate (CAGR) of approximately 5.5% between 2025 and 2033. This impressive expansion is fueled by several interconnected trends. The escalating demand for convenient and safe packaging solutions across various industries, particularly in food & beverage and pharmaceuticals, is a primary catalyst. As consumer lifestyles become more dynamic, the need for pre-portioned, easy-to-open, and resealable packaging solutions like PET covers has surged. The market size is estimated to reach $12.5 billion in 2025, with projections indicating a climb to over $18.0 billion by 2033. Adoption rates for PET covers are steadily increasing due to their inherent properties such as transparency, excellent barrier characteristics against moisture and oxygen, and durability, which contribute to extended shelf life and product integrity. Technological disruptions are continuously enhancing the functionality and sustainability of PET covers. Innovations in biaxial orientation technology for PET films and the development of advanced barrier coatings are improving performance. Furthermore, the industry is witnessing a significant shift towards eco-friendly alternatives, driving the development of recycled PET (rPET) covers and exploring biodegradable options, thereby aligning with global sustainability goals. Consumer behavior is also playing a pivotal role; consumers are increasingly conscious of packaging waste and are favoring brands that demonstrate environmental responsibility. This is compelling manufacturers to invest in sustainable packaging materials and designs. The market penetration of PET covers is expected to deepen across both developed and emerging economies as the advantages of PET packaging become more widely recognized and accessible. The forecast indicates a consistent upward trajectory, underpinned by a robust CAGR and an expanding market penetration, reflecting the increasing reliance of industries on advanced PET packaging solutions.
Dominant Regions, Countries, or Segments in PET Cover
The global PET Cover market's dominance is multifaceted, with regional economic strength, manufacturing capabilities, and evolving consumer demands significantly influencing growth patterns.
Dominant Region: Asia Pacific
The Asia Pacific region is projected to emerge as the leading force in the PET Cover market, driven by its rapidly expanding economies, a large and growing population, and an increasing middle class with higher disposable incomes. This translates to a burgeoning demand for packaged goods across all key application segments.
- Economic Policies: Favorable government policies promoting manufacturing and industrial growth, coupled with significant foreign investment, are creating a robust ecosystem for PET cover production and consumption.
- Infrastructure Development: Enhanced logistics and supply chain infrastructure facilitate the efficient distribution of packaged goods, further boosting demand for PET covers.
- Market Share & Growth Potential: Asia Pacific is estimated to hold a significant share of the global PET cover market, projected to grow at an accelerated pace compared to other regions. The sheer volume of consumers and the increasing adoption of Western consumption patterns are key drivers.
Dominant Application Segment: Food & Beverage
Within the application segments, the Food & Beverage industry will continue to be the largest and most significant driver of PET Cover demand.
- Consumer Convenience: The demand for ready-to-eat meals, convenience foods, and on-the-go beverages necessitates packaging that offers both protection and ease of use, making PET covers indispensable.
- Product Freshness & Shelf Life: The transparency and excellent barrier properties of PET covers ensure product visibility and extend shelf life, reducing food waste and meeting consumer expectations for quality.
- Hygiene & Safety: PET covers provide a sterile and hygienic barrier, crucial for maintaining the safety and integrity of food products, especially in sensitive categories like dairy and confectionery.
- Market Share & Growth Potential: The Food & Beverage segment is expected to command the largest market share, with steady growth driven by population increase and evolving dietary habits.
Dominant Type Segment: Bowl Cover & Box Cover
Both Bowl Covers and Box Covers are significant contributors to the PET Cover market, catering to distinct yet overlapping applications.
- Bowl Covers: Essential for ready meals, salads, desserts, and individual servings in the food service industry, their demand is directly linked to the growth of the convenience food sector.
- Box Covers: Widely used for packaging confectionery, baked goods, and processed foods, their versatility and ability to provide a secure closure are key to their widespread adoption. The growth in e-commerce has also seen an increased demand for protective and presentable box covers.
- Market Share & Growth Potential: These segments are projected to witness consistent growth, driven by their ubiquitous presence in the food industry and evolving packaging needs for various product formats.
PET Cover Product Landscape
The PET Cover product landscape is continuously evolving, driven by innovation in material science and manufacturing techniques. Key product developments focus on enhancing barrier properties for extended shelf life, improving transparency for superior product visibility, and increasing recyclability to meet sustainability mandates. Innovations include the development of multi-layer PET structures that offer improved oxygen and moisture barrier capabilities, as well as the incorporation of advanced coatings for enhanced scratch resistance and aesthetic appeal. Unique selling propositions often revolve around customized shapes and sizes to fit a wide array of containers, tamper-evident features for product security, and the increasing availability of covers made from recycled PET (rPET), appealing to environmentally conscious consumers. Technological advancements are also enabling more efficient and cost-effective production of complex PET cover designs.
Key Drivers, Barriers & Challenges in PET Cover
The PET Cover market is propelled by several key drivers, including the escalating demand for convenience and extended shelf life in the food & beverage sector, stringent food safety regulations that necessitate reliable packaging, and the growing consumer preference for transparent packaging that allows for product visibility. Technological advancements in PET processing and the increasing availability of recycled PET (rPET) are also significant growth accelerators.
- Key Drivers:
- Growing demand for packaged convenience foods.
- Need for extended product shelf life and reduced spoilage.
- Enhanced consumer preference for product visibility.
- Advancements in sustainable packaging materials like rPET.
- Stringent food safety and hygiene standards.
However, the market faces notable barriers and challenges. Fluctuations in the price of raw materials, primarily derived from petroleum, can impact production costs. The increasing global focus on plastic waste reduction and the potential for stricter regulations on single-use plastics, despite PET's recyclability, pose a significant challenge. Furthermore, competition from alternative packaging materials and the capital-intensive nature of establishing advanced PET cover manufacturing facilities can also act as restraints. Supply chain disruptions, as witnessed in recent global events, can affect raw material availability and lead times, impacting production schedules.
- Key Barriers & Challenges:
- Volatility in raw material prices (crude oil derivatives).
- Increasing regulatory pressure and public perception regarding plastic waste.
- Competition from alternative packaging materials (e.g., paper, aluminum).
- High capital investment for advanced manufacturing technologies.
- Supply chain vulnerabilities and disruptions.
Emerging Opportunities in PET Cover
Emerging opportunities in the PET Cover market are largely concentrated around sustainability and innovation in niche applications. The increasing adoption of recycled PET (rPET) presents a significant growth avenue, with governments and consumers alike pushing for a circular economy. Innovations in biodegradable and compostable PET alternatives, while still in nascent stages, offer long-term potential. Furthermore, the expansion of the pharmaceutical and nutraceutical sectors, driven by an aging global population and increased health consciousness, creates demand for specialized PET covers with enhanced barrier properties for sensitive drug formulations and supplements. The growth of e-commerce also opens opportunities for aesthetically pleasing and protective PET covers designed for online retail packaging.
- Sustainability Focus: Increased demand for rPET covers and development of biodegradable alternatives.
- Niche Applications: Growth in pharmaceutical, nutraceutical, and specialty food packaging.
- E-commerce Packaging: Opportunities for aesthetically pleasing and protective designs.
Growth Accelerators in the PET Cover Industry
Several catalysts are accelerating the growth of the PET Cover industry. Technological breakthroughs in PET recycling processes are making rPET more commercially viable and scalable, directly addressing sustainability concerns. Strategic partnerships between PET resin producers, cover manufacturers, and end-users are fostering collaborative innovation, leading to the development of tailored packaging solutions. Market expansion strategies, particularly in emerging economies where the demand for packaged goods is rapidly rising, are also significant growth drivers. Investments in automation and advanced manufacturing technologies are enhancing production efficiency and reducing costs, making PET covers more competitive.
Key Players Shaping the PET Cover Market
- Retal
- Amcor
- Manjushree
- Indorama Ventures Public
- EcoPack
- Schabert Group
- Indorama Ventures
- Berry
- Bericap
- Zhongxin Stock
- Zhengjiang Pando Environmental Protection and Technology
- Jiangmen Youbang Plastic Packaging
- Qingdao Jinxi Food Raw Materials
- Dongguan Imitation Packaging Products
- Dongguan Whale Mouth Environmental Protection Technology
- Dongyang Plastic
Notable Milestones in PET Cover Sector
- 2019: Increased focus on sustainable packaging solutions, with a rise in trials and adoption of rPET for food and beverage covers.
- 2020: Global supply chain disruptions due to the pandemic highlighted the importance of robust and flexible packaging solutions, boosting demand for PET covers.
- 2021: Advancements in biaxial orientation technology led to thinner yet stronger PET covers, optimizing material usage and cost-effectiveness.
- 2022: Growing consumer awareness and regulatory pressures spurred significant investments in recycling infrastructure for PET.
- 2023: Introduction of new barrier technologies within PET films to further extend product shelf life, especially for sensitive food items.
- 2024: Several companies announced ambitious targets for increasing the recycled content in their PET packaging, signaling a major industry shift.
In-Depth PET Cover Market Outlook
The PET Cover market is set for robust and sustained growth, driven by an increasing global demand for convenient, safe, and aesthetically appealing packaging. The accelerating adoption of recycled PET (rPET) will be a defining characteristic, propelled by environmental consciousness and supportive regulations, making sustainability a key competitive differentiator. Continuous technological innovation will further enhance the performance and functionality of PET covers, offering superior barrier properties and design flexibility. Strategic expansion into high-growth emerging markets, coupled with a focus on specialized applications within the pharmaceutical and nutraceutical sectors, will unlock significant new revenue streams. Overall, the outlook for the PET Cover industry remains exceptionally positive, with ample opportunities for players who prioritize innovation, sustainability, and adaptability to evolving market demands.
PET Cover Segmentation
-
1. Application
- 1.1. Food & Beverage
- 1.2. Pharmaceuticals
- 1.3. Cosmetics
- 1.4. Others
-
2. Types
- 2.1. Bowl Cover
- 2.2. Box Cover
- 2.3. Others
PET Cover Segmentation By Geography
-
1. North America
- 1.1. United States
- 1.2. Canada
- 1.3. Mexico
-
2. South America
- 2.1. Brazil
- 2.2. Argentina
- 2.3. Rest of South America
-
3. Europe
- 3.1. United Kingdom
- 3.2. Germany
- 3.3. France
- 3.4. Italy
- 3.5. Spain
- 3.6. Russia
- 3.7. Benelux
- 3.8. Nordics
- 3.9. Rest of Europe
-
4. Middle East & Africa
- 4.1. Turkey
- 4.2. Israel
- 4.3. GCC
- 4.4. North Africa
- 4.5. South Africa
- 4.6. Rest of Middle East & Africa
-
5. Asia Pacific
- 5.1. China
- 5.2. India
- 5.3. Japan
- 5.4. South Korea
- 5.5. ASEAN
- 5.6. Oceania
- 5.7. Rest of Asia Pacific
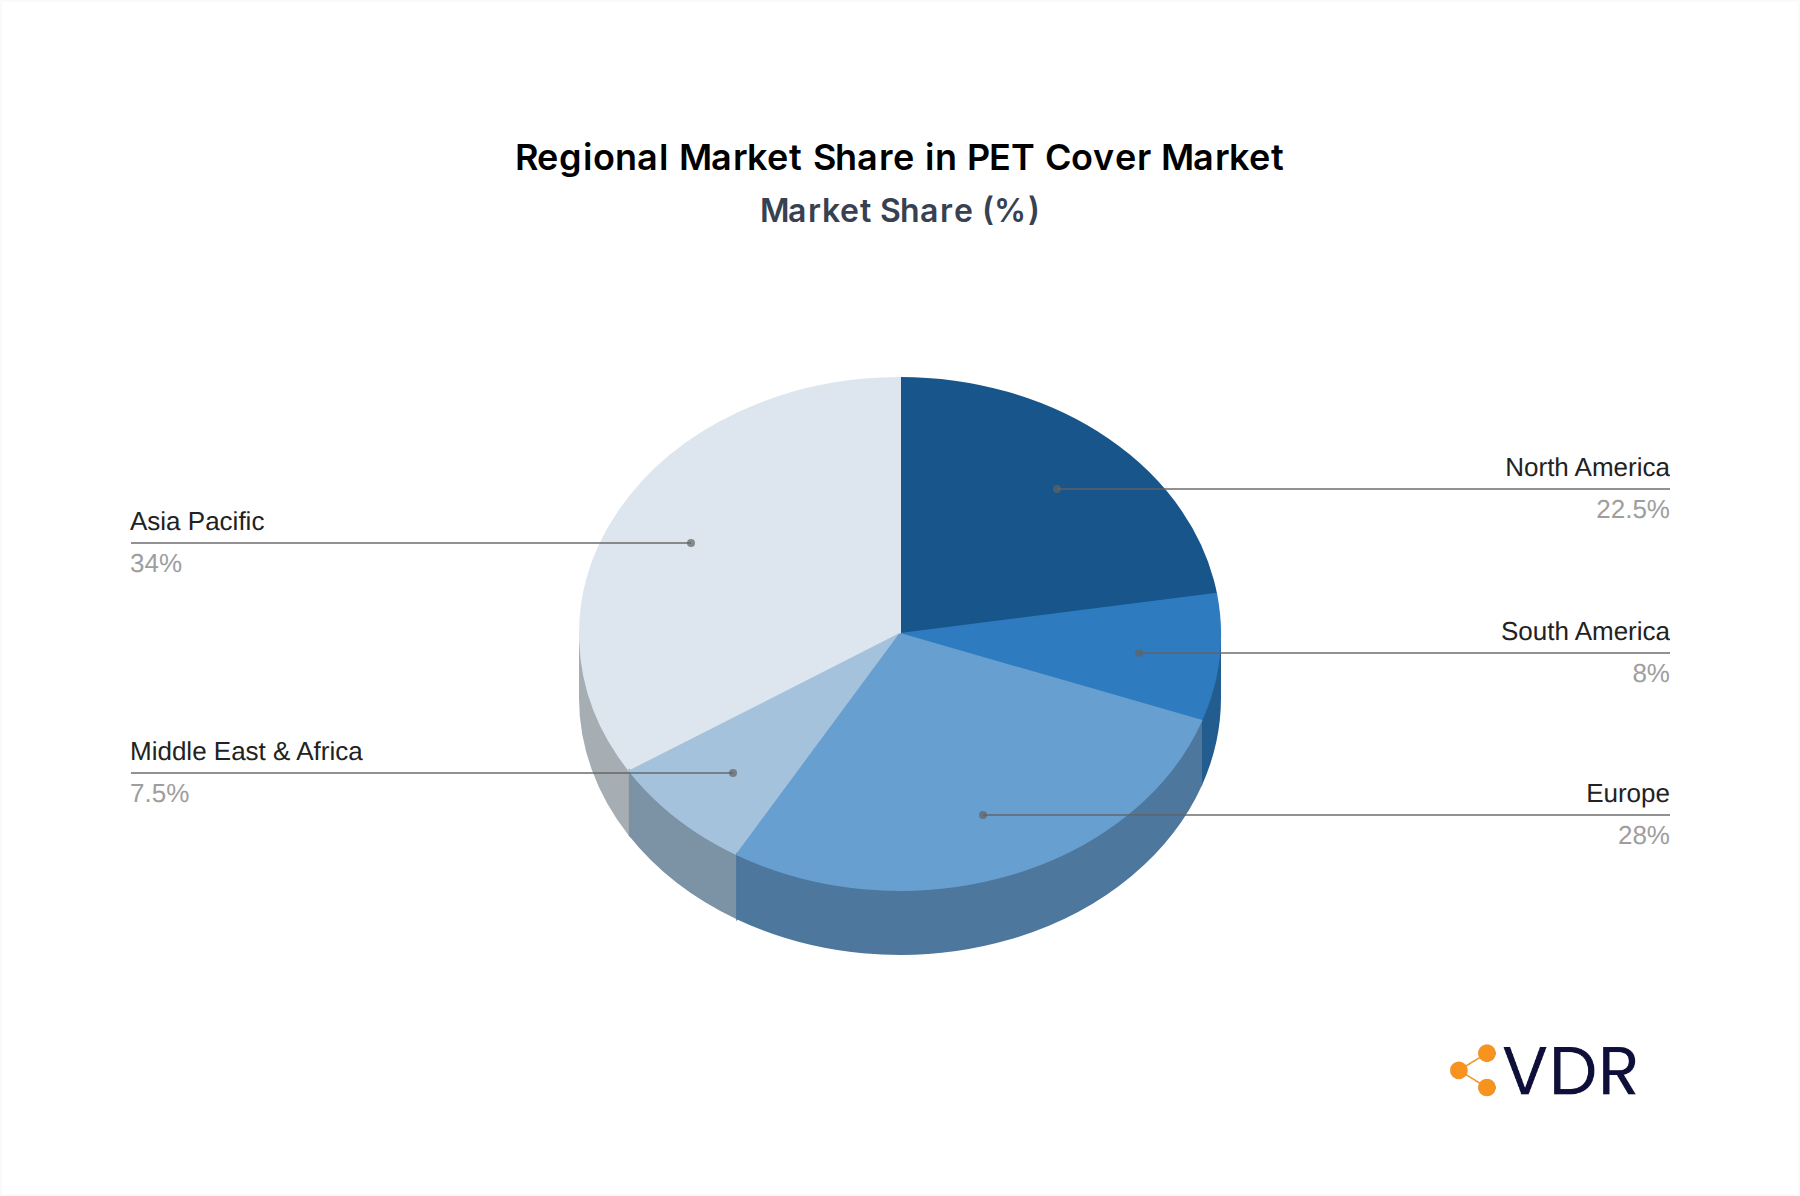
PET Cover Regional Market Share
Geographic Coverage of PET Cover
PET Cover REPORT HIGHLIGHTS
| Aspects | Details |
|---|---|
| Study Period | 2020-2034 |
| Base Year | 2025 |
| Estimated Year | 2026 |
| Forecast Period | 2026-2034 |
| Historical Period | 2020-2025 |
| Growth Rate | CAGR of 17.53% from 2020-2034 |
| Segmentation |
|
Table of Contents
- 1. Introduction
- 1.1. Research Scope
- 1.2. Market Segmentation
- 1.3. Research Objective
- 1.4. Definitions and Assumptions
- 2. Executive Summary
- 2.1. Market Snapshot
- 3. Market Dynamics
- 3.1. Market Drivers
- 3.2. Market Restrains
- 3.3. Market Trends
- 3.4. Market Opportunities
- 4. Market Factor Analysis
- 4.1. Porters Five Forces
- 4.1.1. Bargaining Power of Suppliers
- 4.1.2. Bargaining Power of Buyers
- 4.1.3. Threat of New Entrants
- 4.1.4. Threat of Substitutes
- 4.1.5. Competitive Rivalry
- 4.2. PESTEL analysis
- 4.3. BCG Analysis
- 4.3.1. Stars (High Growth, High Market Share)
- 4.3.2. Cash Cows (Low Growth, High Market Share)
- 4.3.3. Question Mark (High Growth, Low Market Share)
- 4.3.4. Dogs (Low Growth, Low Market Share)
- 4.4. Ansoff Matrix Analysis
- 4.5. Supply Chain Analysis
- 4.6. Regulatory Landscape
- 4.7. Current Market Potential and Opportunity Assessment (TAM–SAM–SOM Framework)
- 4.8. VDR Analyst Note
- 4.1. Porters Five Forces
- 5. Market Analysis, Insights and Forecast 2021-2033
- 5.1. Market Analysis, Insights and Forecast - by Application
- 5.1.1. Food & Beverage
- 5.1.2. Pharmaceuticals
- 5.1.3. Cosmetics
- 5.1.4. Others
- 5.2. Market Analysis, Insights and Forecast - by Types
- 5.2.1. Bowl Cover
- 5.2.2. Box Cover
- 5.2.3. Others
- 5.3. Market Analysis, Insights and Forecast - by Region
- 5.3.1. North America
- 5.3.2. South America
- 5.3.3. Europe
- 5.3.4. Middle East & Africa
- 5.3.5. Asia Pacific
- 5.1. Market Analysis, Insights and Forecast - by Application
- 6. Global PET Cover Analysis, Insights and Forecast, 2021-2033
- 6.1. Market Analysis, Insights and Forecast - by Application
- 6.1.1. Food & Beverage
- 6.1.2. Pharmaceuticals
- 6.1.3. Cosmetics
- 6.1.4. Others
- 6.2. Market Analysis, Insights and Forecast - by Types
- 6.2.1. Bowl Cover
- 6.2.2. Box Cover
- 6.2.3. Others
- 6.1. Market Analysis, Insights and Forecast - by Application
- 7. North America PET Cover Analysis, Insights and Forecast, 2021-2033
- 7.1. Market Analysis, Insights and Forecast - by Application
- 7.1.1. Food & Beverage
- 7.1.2. Pharmaceuticals
- 7.1.3. Cosmetics
- 7.1.4. Others
- 7.2. Market Analysis, Insights and Forecast - by Types
- 7.2.1. Bowl Cover
- 7.2.2. Box Cover
- 7.2.3. Others
- 7.1. Market Analysis, Insights and Forecast - by Application
- 8. South America PET Cover Analysis, Insights and Forecast, 2021-2033
- 8.1. Market Analysis, Insights and Forecast - by Application
- 8.1.1. Food & Beverage
- 8.1.2. Pharmaceuticals
- 8.1.3. Cosmetics
- 8.1.4. Others
- 8.2. Market Analysis, Insights and Forecast - by Types
- 8.2.1. Bowl Cover
- 8.2.2. Box Cover
- 8.2.3. Others
- 8.1. Market Analysis, Insights and Forecast - by Application
- 9. Europe PET Cover Analysis, Insights and Forecast, 2021-2033
- 9.1. Market Analysis, Insights and Forecast - by Application
- 9.1.1. Food & Beverage
- 9.1.2. Pharmaceuticals
- 9.1.3. Cosmetics
- 9.1.4. Others
- 9.2. Market Analysis, Insights and Forecast - by Types
- 9.2.1. Bowl Cover
- 9.2.2. Box Cover
- 9.2.3. Others
- 9.1. Market Analysis, Insights and Forecast - by Application
- 10. Middle East & Africa PET Cover Analysis, Insights and Forecast, 2021-2033
- 10.1. Market Analysis, Insights and Forecast - by Application
- 10.1.1. Food & Beverage
- 10.1.2. Pharmaceuticals
- 10.1.3. Cosmetics
- 10.1.4. Others
- 10.2. Market Analysis, Insights and Forecast - by Types
- 10.2.1. Bowl Cover
- 10.2.2. Box Cover
- 10.2.3. Others
- 10.1. Market Analysis, Insights and Forecast - by Application
- 11. Asia Pacific PET Cover Analysis, Insights and Forecast, 2021-2033
- 11.1. Market Analysis, Insights and Forecast - by Application
- 11.1.1. Food & Beverage
- 11.1.2. Pharmaceuticals
- 11.1.3. Cosmetics
- 11.1.4. Others
- 11.2. Market Analysis, Insights and Forecast - by Types
- 11.2.1. Bowl Cover
- 11.2.2. Box Cover
- 11.2.3. Others
- 11.1. Market Analysis, Insights and Forecast - by Application
- 12. Competitive Analysis
- 12.1. Company Profiles
- 12.1.1 Retal
- 12.1.1.1. Company Overview
- 12.1.1.2. Products
- 12.1.1.3. Company Financials
- 12.1.1.4. SWOT Analysis
- 12.1.2 Amcor
- 12.1.2.1. Company Overview
- 12.1.2.2. Products
- 12.1.2.3. Company Financials
- 12.1.2.4. SWOT Analysis
- 12.1.3 Manjushree
- 12.1.3.1. Company Overview
- 12.1.3.2. Products
- 12.1.3.3. Company Financials
- 12.1.3.4. SWOT Analysis
- 12.1.4 Indorama Ventures Public
- 12.1.4.1. Company Overview
- 12.1.4.2. Products
- 12.1.4.3. Company Financials
- 12.1.4.4. SWOT Analysis
- 12.1.5 EcoPack
- 12.1.5.1. Company Overview
- 12.1.5.2. Products
- 12.1.5.3. Company Financials
- 12.1.5.4. SWOT Analysis
- 12.1.6 Schabert Group
- 12.1.6.1. Company Overview
- 12.1.6.2. Products
- 12.1.6.3. Company Financials
- 12.1.6.4. SWOT Analysis
- 12.1.7 Indorama Ventures
- 12.1.7.1. Company Overview
- 12.1.7.2. Products
- 12.1.7.3. Company Financials
- 12.1.7.4. SWOT Analysis
- 12.1.8 Berry
- 12.1.8.1. Company Overview
- 12.1.8.2. Products
- 12.1.8.3. Company Financials
- 12.1.8.4. SWOT Analysis
- 12.1.9 Bericap
- 12.1.9.1. Company Overview
- 12.1.9.2. Products
- 12.1.9.3. Company Financials
- 12.1.9.4. SWOT Analysis
- 12.1.10 Zhongxin Stock
- 12.1.10.1. Company Overview
- 12.1.10.2. Products
- 12.1.10.3. Company Financials
- 12.1.10.4. SWOT Analysis
- 12.1.11 Zhengjiang Pando Environmental Protection and Technology
- 12.1.11.1. Company Overview
- 12.1.11.2. Products
- 12.1.11.3. Company Financials
- 12.1.11.4. SWOT Analysis
- 12.1.12 Jiangmen Youbang Plastic Packaging
- 12.1.12.1. Company Overview
- 12.1.12.2. Products
- 12.1.12.3. Company Financials
- 12.1.12.4. SWOT Analysis
- 12.1.13 Qingdao Jinxi Food Raw Materials
- 12.1.13.1. Company Overview
- 12.1.13.2. Products
- 12.1.13.3. Company Financials
- 12.1.13.4. SWOT Analysis
- 12.1.14 Dongguan Imitation Packaging Products
- 12.1.14.1. Company Overview
- 12.1.14.2. Products
- 12.1.14.3. Company Financials
- 12.1.14.4. SWOT Analysis
- 12.1.15 Dongguan Whale Mouth Environmental Protection Technology
- 12.1.15.1. Company Overview
- 12.1.15.2. Products
- 12.1.15.3. Company Financials
- 12.1.15.4. SWOT Analysis
- 12.1.16 Dongyang Plastic
- 12.1.16.1. Company Overview
- 12.1.16.2. Products
- 12.1.16.3. Company Financials
- 12.1.16.4. SWOT Analysis
- 12.1.1 Retal
- 12.2. Market Entropy
- 12.2.1 Company's Key Areas Served
- 12.2.2 Recent Developments
- 12.3. Company Market Share Analysis 2025
- 12.3.1 Top 5 Companies Market Share Analysis
- 12.3.2 Top 3 Companies Market Share Analysis
- 12.4. List of Potential Customers
- 13. Research Methodology
List of Figures
- Figure 1: Global PET Cover Revenue Breakdown (billion, %) by Region 2025 & 2033
- Figure 2: Global PET Cover Volume Breakdown (K, %) by Region 2025 & 2033
- Figure 3: North America PET Cover Revenue (billion), by Application 2025 & 2033
- Figure 4: North America PET Cover Volume (K), by Application 2025 & 2033
- Figure 5: North America PET Cover Revenue Share (%), by Application 2025 & 2033
- Figure 6: North America PET Cover Volume Share (%), by Application 2025 & 2033
- Figure 7: North America PET Cover Revenue (billion), by Types 2025 & 2033
- Figure 8: North America PET Cover Volume (K), by Types 2025 & 2033
- Figure 9: North America PET Cover Revenue Share (%), by Types 2025 & 2033
- Figure 10: North America PET Cover Volume Share (%), by Types 2025 & 2033
- Figure 11: North America PET Cover Revenue (billion), by Country 2025 & 2033
- Figure 12: North America PET Cover Volume (K), by Country 2025 & 2033
- Figure 13: North America PET Cover Revenue Share (%), by Country 2025 & 2033
- Figure 14: North America PET Cover Volume Share (%), by Country 2025 & 2033
- Figure 15: South America PET Cover Revenue (billion), by Application 2025 & 2033
- Figure 16: South America PET Cover Volume (K), by Application 2025 & 2033
- Figure 17: South America PET Cover Revenue Share (%), by Application 2025 & 2033
- Figure 18: South America PET Cover Volume Share (%), by Application 2025 & 2033
- Figure 19: South America PET Cover Revenue (billion), by Types 2025 & 2033
- Figure 20: South America PET Cover Volume (K), by Types 2025 & 2033
- Figure 21: South America PET Cover Revenue Share (%), by Types 2025 & 2033
- Figure 22: South America PET Cover Volume Share (%), by Types 2025 & 2033
- Figure 23: South America PET Cover Revenue (billion), by Country 2025 & 2033
- Figure 24: South America PET Cover Volume (K), by Country 2025 & 2033
- Figure 25: South America PET Cover Revenue Share (%), by Country 2025 & 2033
- Figure 26: South America PET Cover Volume Share (%), by Country 2025 & 2033
- Figure 27: Europe PET Cover Revenue (billion), by Application 2025 & 2033
- Figure 28: Europe PET Cover Volume (K), by Application 2025 & 2033
- Figure 29: Europe PET Cover Revenue Share (%), by Application 2025 & 2033
- Figure 30: Europe PET Cover Volume Share (%), by Application 2025 & 2033
- Figure 31: Europe PET Cover Revenue (billion), by Types 2025 & 2033
- Figure 32: Europe PET Cover Volume (K), by Types 2025 & 2033
- Figure 33: Europe PET Cover Revenue Share (%), by Types 2025 & 2033
- Figure 34: Europe PET Cover Volume Share (%), by Types 2025 & 2033
- Figure 35: Europe PET Cover Revenue (billion), by Country 2025 & 2033
- Figure 36: Europe PET Cover Volume (K), by Country 2025 & 2033
- Figure 37: Europe PET Cover Revenue Share (%), by Country 2025 & 2033
- Figure 38: Europe PET Cover Volume Share (%), by Country 2025 & 2033
- Figure 39: Middle East & Africa PET Cover Revenue (billion), by Application 2025 & 2033
- Figure 40: Middle East & Africa PET Cover Volume (K), by Application 2025 & 2033
- Figure 41: Middle East & Africa PET Cover Revenue Share (%), by Application 2025 & 2033
- Figure 42: Middle East & Africa PET Cover Volume Share (%), by Application 2025 & 2033
- Figure 43: Middle East & Africa PET Cover Revenue (billion), by Types 2025 & 2033
- Figure 44: Middle East & Africa PET Cover Volume (K), by Types 2025 & 2033
- Figure 45: Middle East & Africa PET Cover Revenue Share (%), by Types 2025 & 2033
- Figure 46: Middle East & Africa PET Cover Volume Share (%), by Types 2025 & 2033
- Figure 47: Middle East & Africa PET Cover Revenue (billion), by Country 2025 & 2033
- Figure 48: Middle East & Africa PET Cover Volume (K), by Country 2025 & 2033
- Figure 49: Middle East & Africa PET Cover Revenue Share (%), by Country 2025 & 2033
- Figure 50: Middle East & Africa PET Cover Volume Share (%), by Country 2025 & 2033
- Figure 51: Asia Pacific PET Cover Revenue (billion), by Application 2025 & 2033
- Figure 52: Asia Pacific PET Cover Volume (K), by Application 2025 & 2033
- Figure 53: Asia Pacific PET Cover Revenue Share (%), by Application 2025 & 2033
- Figure 54: Asia Pacific PET Cover Volume Share (%), by Application 2025 & 2033
- Figure 55: Asia Pacific PET Cover Revenue (billion), by Types 2025 & 2033
- Figure 56: Asia Pacific PET Cover Volume (K), by Types 2025 & 2033
- Figure 57: Asia Pacific PET Cover Revenue Share (%), by Types 2025 & 2033
- Figure 58: Asia Pacific PET Cover Volume Share (%), by Types 2025 & 2033
- Figure 59: Asia Pacific PET Cover Revenue (billion), by Country 2025 & 2033
- Figure 60: Asia Pacific PET Cover Volume (K), by Country 2025 & 2033
- Figure 61: Asia Pacific PET Cover Revenue Share (%), by Country 2025 & 2033
- Figure 62: Asia Pacific PET Cover Volume Share (%), by Country 2025 & 2033
List of Tables
- Table 1: Global PET Cover Revenue billion Forecast, by Application 2020 & 2033
- Table 2: Global PET Cover Volume K Forecast, by Application 2020 & 2033
- Table 3: Global PET Cover Revenue billion Forecast, by Types 2020 & 2033
- Table 4: Global PET Cover Volume K Forecast, by Types 2020 & 2033
- Table 5: Global PET Cover Revenue billion Forecast, by Region 2020 & 2033
- Table 6: Global PET Cover Volume K Forecast, by Region 2020 & 2033
- Table 7: Global PET Cover Revenue billion Forecast, by Application 2020 & 2033
- Table 8: Global PET Cover Volume K Forecast, by Application 2020 & 2033
- Table 9: Global PET Cover Revenue billion Forecast, by Types 2020 & 2033
- Table 10: Global PET Cover Volume K Forecast, by Types 2020 & 2033
- Table 11: Global PET Cover Revenue billion Forecast, by Country 2020 & 2033
- Table 12: Global PET Cover Volume K Forecast, by Country 2020 & 2033
- Table 13: United States PET Cover Revenue (billion) Forecast, by Application 2020 & 2033
- Table 14: United States PET Cover Volume (K) Forecast, by Application 2020 & 2033
- Table 15: Canada PET Cover Revenue (billion) Forecast, by Application 2020 & 2033
- Table 16: Canada PET Cover Volume (K) Forecast, by Application 2020 & 2033
- Table 17: Mexico PET Cover Revenue (billion) Forecast, by Application 2020 & 2033
- Table 18: Mexico PET Cover Volume (K) Forecast, by Application 2020 & 2033
- Table 19: Global PET Cover Revenue billion Forecast, by Application 2020 & 2033
- Table 20: Global PET Cover Volume K Forecast, by Application 2020 & 2033
- Table 21: Global PET Cover Revenue billion Forecast, by Types 2020 & 2033
- Table 22: Global PET Cover Volume K Forecast, by Types 2020 & 2033
- Table 23: Global PET Cover Revenue billion Forecast, by Country 2020 & 2033
- Table 24: Global PET Cover Volume K Forecast, by Country 2020 & 2033
- Table 25: Brazil PET Cover Revenue (billion) Forecast, by Application 2020 & 2033
- Table 26: Brazil PET Cover Volume (K) Forecast, by Application 2020 & 2033
- Table 27: Argentina PET Cover Revenue (billion) Forecast, by Application 2020 & 2033
- Table 28: Argentina PET Cover Volume (K) Forecast, by Application 2020 & 2033
- Table 29: Rest of South America PET Cover Revenue (billion) Forecast, by Application 2020 & 2033
- Table 30: Rest of South America PET Cover Volume (K) Forecast, by Application 2020 & 2033
- Table 31: Global PET Cover Revenue billion Forecast, by Application 2020 & 2033
- Table 32: Global PET Cover Volume K Forecast, by Application 2020 & 2033
- Table 33: Global PET Cover Revenue billion Forecast, by Types 2020 & 2033
- Table 34: Global PET Cover Volume K Forecast, by Types 2020 & 2033
- Table 35: Global PET Cover Revenue billion Forecast, by Country 2020 & 2033
- Table 36: Global PET Cover Volume K Forecast, by Country 2020 & 2033
- Table 37: United Kingdom PET Cover Revenue (billion) Forecast, by Application 2020 & 2033
- Table 38: United Kingdom PET Cover Volume (K) Forecast, by Application 2020 & 2033
- Table 39: Germany PET Cover Revenue (billion) Forecast, by Application 2020 & 2033
- Table 40: Germany PET Cover Volume (K) Forecast, by Application 2020 & 2033
- Table 41: France PET Cover Revenue (billion) Forecast, by Application 2020 & 2033
- Table 42: France PET Cover Volume (K) Forecast, by Application 2020 & 2033
- Table 43: Italy PET Cover Revenue (billion) Forecast, by Application 2020 & 2033
- Table 44: Italy PET Cover Volume (K) Forecast, by Application 2020 & 2033
- Table 45: Spain PET Cover Revenue (billion) Forecast, by Application 2020 & 2033
- Table 46: Spain PET Cover Volume (K) Forecast, by Application 2020 & 2033
- Table 47: Russia PET Cover Revenue (billion) Forecast, by Application 2020 & 2033
- Table 48: Russia PET Cover Volume (K) Forecast, by Application 2020 & 2033
- Table 49: Benelux PET Cover Revenue (billion) Forecast, by Application 2020 & 2033
- Table 50: Benelux PET Cover Volume (K) Forecast, by Application 2020 & 2033
- Table 51: Nordics PET Cover Revenue (billion) Forecast, by Application 2020 & 2033
- Table 52: Nordics PET Cover Volume (K) Forecast, by Application 2020 & 2033
- Table 53: Rest of Europe PET Cover Revenue (billion) Forecast, by Application 2020 & 2033
- Table 54: Rest of Europe PET Cover Volume (K) Forecast, by Application 2020 & 2033
- Table 55: Global PET Cover Revenue billion Forecast, by Application 2020 & 2033
- Table 56: Global PET Cover Volume K Forecast, by Application 2020 & 2033
- Table 57: Global PET Cover Revenue billion Forecast, by Types 2020 & 2033
- Table 58: Global PET Cover Volume K Forecast, by Types 2020 & 2033
- Table 59: Global PET Cover Revenue billion Forecast, by Country 2020 & 2033
- Table 60: Global PET Cover Volume K Forecast, by Country 2020 & 2033
- Table 61: Turkey PET Cover Revenue (billion) Forecast, by Application 2020 & 2033
- Table 62: Turkey PET Cover Volume (K) Forecast, by Application 2020 & 2033
- Table 63: Israel PET Cover Revenue (billion) Forecast, by Application 2020 & 2033
- Table 64: Israel PET Cover Volume (K) Forecast, by Application 2020 & 2033
- Table 65: GCC PET Cover Revenue (billion) Forecast, by Application 2020 & 2033
- Table 66: GCC PET Cover Volume (K) Forecast, by Application 2020 & 2033
- Table 67: North Africa PET Cover Revenue (billion) Forecast, by Application 2020 & 2033
- Table 68: North Africa PET Cover Volume (K) Forecast, by Application 2020 & 2033
- Table 69: South Africa PET Cover Revenue (billion) Forecast, by Application 2020 & 2033
- Table 70: South Africa PET Cover Volume (K) Forecast, by Application 2020 & 2033
- Table 71: Rest of Middle East & Africa PET Cover Revenue (billion) Forecast, by Application 2020 & 2033
- Table 72: Rest of Middle East & Africa PET Cover Volume (K) Forecast, by Application 2020 & 2033
- Table 73: Global PET Cover Revenue billion Forecast, by Application 2020 & 2033
- Table 74: Global PET Cover Volume K Forecast, by Application 2020 & 2033
- Table 75: Global PET Cover Revenue billion Forecast, by Types 2020 & 2033
- Table 76: Global PET Cover Volume K Forecast, by Types 2020 & 2033
- Table 77: Global PET Cover Revenue billion Forecast, by Country 2020 & 2033
- Table 78: Global PET Cover Volume K Forecast, by Country 2020 & 2033
- Table 79: China PET Cover Revenue (billion) Forecast, by Application 2020 & 2033
- Table 80: China PET Cover Volume (K) Forecast, by Application 2020 & 2033
- Table 81: India PET Cover Revenue (billion) Forecast, by Application 2020 & 2033
- Table 82: India PET Cover Volume (K) Forecast, by Application 2020 & 2033
- Table 83: Japan PET Cover Revenue (billion) Forecast, by Application 2020 & 2033
- Table 84: Japan PET Cover Volume (K) Forecast, by Application 2020 & 2033
- Table 85: South Korea PET Cover Revenue (billion) Forecast, by Application 2020 & 2033
- Table 86: South Korea PET Cover Volume (K) Forecast, by Application 2020 & 2033
- Table 87: ASEAN PET Cover Revenue (billion) Forecast, by Application 2020 & 2033
- Table 88: ASEAN PET Cover Volume (K) Forecast, by Application 2020 & 2033
- Table 89: Oceania PET Cover Revenue (billion) Forecast, by Application 2020 & 2033
- Table 90: Oceania PET Cover Volume (K) Forecast, by Application 2020 & 2033
- Table 91: Rest of Asia Pacific PET Cover Revenue (billion) Forecast, by Application 2020 & 2033
- Table 92: Rest of Asia Pacific PET Cover Volume (K) Forecast, by Application 2020 & 2033
Frequently Asked Questions
1. What is the projected Compound Annual Growth Rate (CAGR) of the PET Cover?
The projected CAGR is approximately 17.53%.
2. Which companies are prominent players in the PET Cover?
Key companies in the market include Retal, Amcor, Manjushree, Indorama Ventures Public, EcoPack, Schabert Group, Indorama Ventures, Berry, Bericap, Zhongxin Stock, Zhengjiang Pando Environmental Protection and Technology, Jiangmen Youbang Plastic Packaging, Qingdao Jinxi Food Raw Materials, Dongguan Imitation Packaging Products, Dongguan Whale Mouth Environmental Protection Technology, Dongyang Plastic.
3. What are the main segments of the PET Cover?
The market segments include Application, Types.
4. Can you provide details about the market size?
The market size is estimated to be USD 21.84 billion as of 2022.
5. What are some drivers contributing to market growth?
N/A
6. What are the notable trends driving market growth?
N/A
7. Are there any restraints impacting market growth?
N/A
8. Can you provide examples of recent developments in the market?
N/A
9. What pricing options are available for accessing the report?
Pricing options include single-user, multi-user, and enterprise licenses priced at USD 3950.00, USD 5925.00, and USD 7900.00 respectively.
10. Is the market size provided in terms of value or volume?
The market size is provided in terms of value, measured in billion and volume, measured in K.
11. Are there any specific market keywords associated with the report?
Yes, the market keyword associated with the report is "PET Cover," which aids in identifying and referencing the specific market segment covered.
12. How do I determine which pricing option suits my needs best?
The pricing options vary based on user requirements and access needs. Individual users may opt for single-user licenses, while businesses requiring broader access may choose multi-user or enterprise licenses for cost-effective access to the report.
13. Are there any additional resources or data provided in the PET Cover report?
While the report offers comprehensive insights, it's advisable to review the specific contents or supplementary materials provided to ascertain if additional resources or data are available.
14. How can I stay updated on further developments or reports in the PET Cover?
To stay informed about further developments, trends, and reports in the PET Cover, consider subscribing to industry newsletters, following relevant companies and organizations, or regularly checking reputable industry news sources and publications.
Methodology
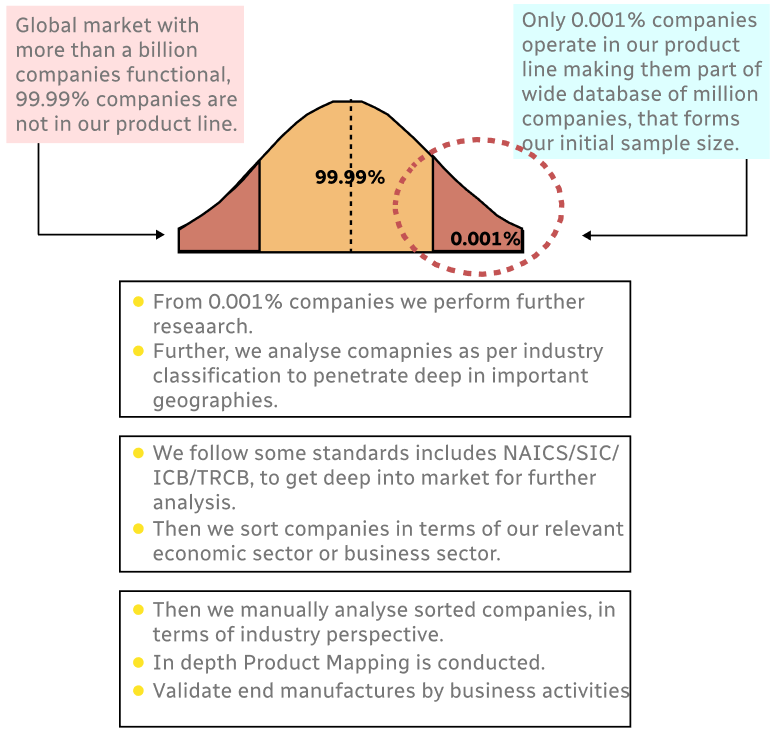
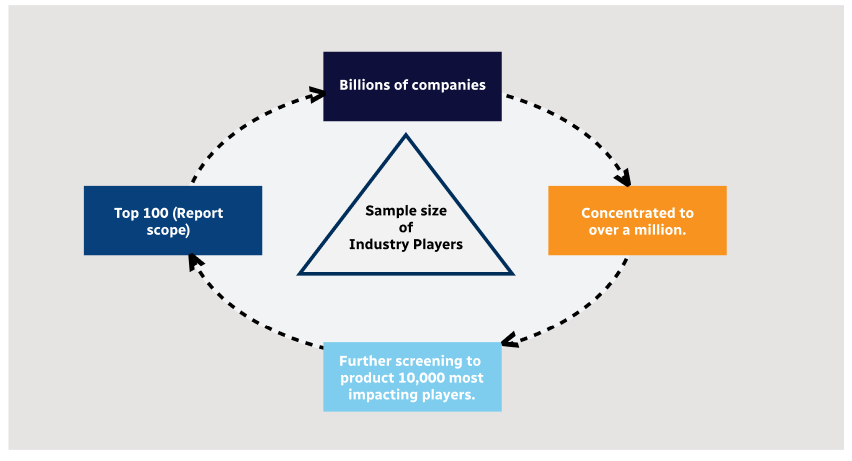
Step 1 - Identification of Relevant Samples Size from Population Database
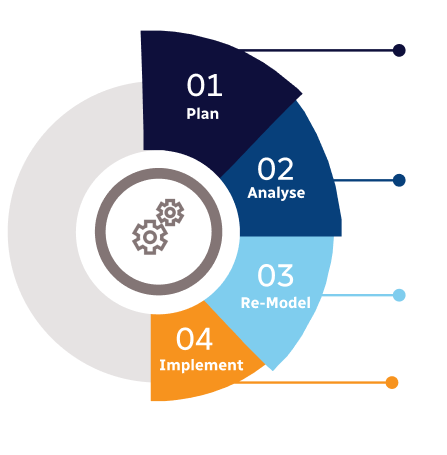
Step 2 - Approaches for Defining Global Market Size (Value, Volume* & Price*)
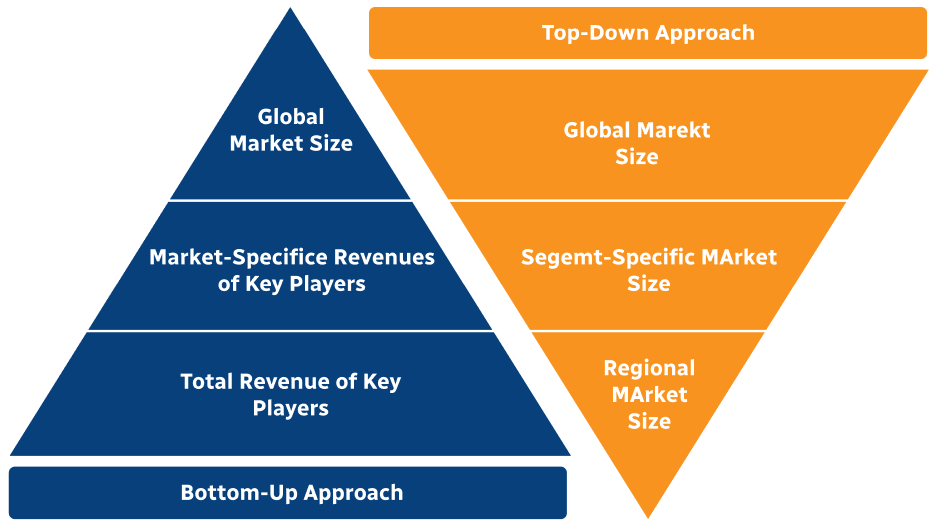
Note*: In applicable scenarios
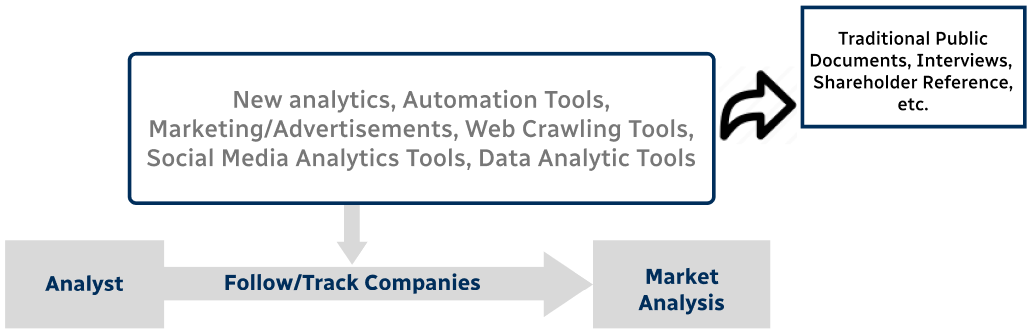
Step 3 - Data Sources
Primary Research
- Web Analytics
- Survey Reports
- Research Institute
- Latest Research Reports
- Opinion Leaders
Secondary Research
- Annual Reports
- White Paper
- Latest Press Release
- Industry Association
- Paid Database
- Investor Presentations
Step 4 - Data Triangulation
Involves using different sources of information in order to increase the validity of a study
These sources are likely to be stakeholders in a program - participants, other researchers, program staff, other community members, and so on.
Then we put all data in single framework & apply various statistical tools to find out the dynamic on the market.
During the analysis stage, feedback from the stakeholder groups would be compared to determine areas of agreement as well as areas of divergence