

Key Insights
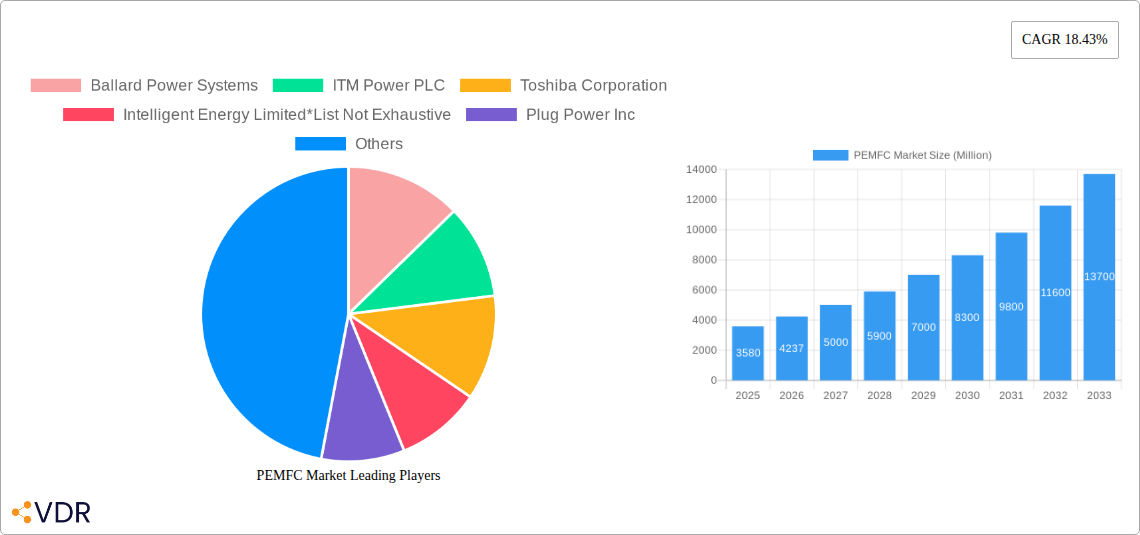
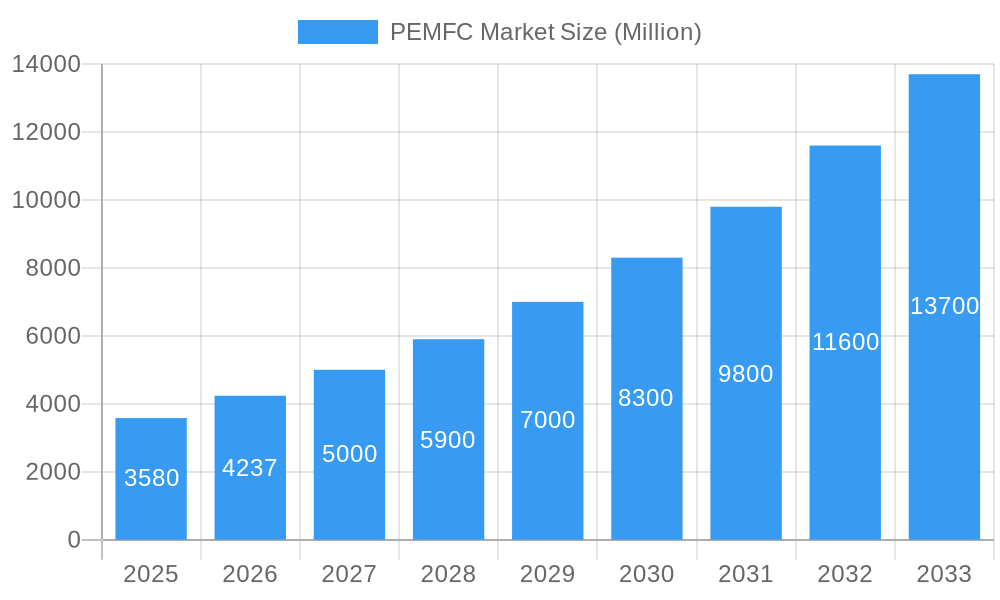
The Polymer Electrolyte Membrane Fuel Cell (PEMFC) market is experiencing robust growth, projected to reach $3.58 billion by 2025 and exhibiting a Compound Annual Growth Rate (CAGR) of 18.43% from 2025 to 2033. This expansion is driven by increasing demand for clean energy solutions across various sectors, particularly transportation and stationary power generation. The automotive industry's push for zero-emission vehicles is a major catalyst, with PEMFCs offering a compelling alternative to battery-electric vehicles, especially for long-haul transportation and heavy-duty applications like buses and forklifts. Furthermore, the growing adoption of PEMFCs in stationary power applications, ranging from residential and commercial buildings to industrial facilities, is significantly contributing to market growth. Technological advancements, such as improved durability and efficiency of high-temperature PEMFCs, are further enhancing the market appeal. However, challenges remain, including the high initial cost of PEMFC systems and the need for a wider hydrogen refueling infrastructure, which are acting as restraints on market penetration. Nonetheless, government incentives and investments in research and development are expected to mitigate these challenges, fostering substantial market growth in the coming years.
PEMFC Market Market Size (In Billion)
The geographical distribution of the PEMFC market reveals significant regional variations. North America, particularly the United States, is expected to dominate the market due to strong government support for clean energy initiatives and a well-established automotive industry. Europe follows closely, driven by stringent emission regulations and a focus on renewable energy sources. The Asia-Pacific region, especially China and Japan, is also exhibiting rapid growth, fueled by increasing industrialization and investment in fuel cell technology. While South America and the Middle East & Africa regions currently hold smaller market shares, their potential for growth is significant, given increasing awareness of environmental concerns and government efforts to diversify energy sources. The competitive landscape is characterized by established players like Ballard Power Systems, Plug Power Inc., and Toshiba Corporation, alongside emerging companies focusing on innovative PEMFC technologies. The market’s future success hinges on overcoming cost barriers, improving infrastructure, and continued technological advancements to further enhance the performance and reliability of PEMFC systems.
PEMFC Market Company Market Share
PEMFC Market Report: A Comprehensive Analysis (2019-2033)
This comprehensive report provides a detailed analysis of the Proton Exchange Membrane Fuel Cell (PEMFC) market, encompassing its dynamics, growth trends, key players, and future outlook. With a focus on both parent and child markets, this study offers invaluable insights for industry professionals, investors, and researchers seeking a thorough understanding of this rapidly evolving sector. The report covers the period from 2019 to 2033, with a base year of 2025 and a forecast period of 2025-2033. The market size is expressed in million units.
PEMFC Market Dynamics & Structure
The PEMFC market is characterized by a moderately concentrated landscape with several key players vying for market share. Technological innovation, particularly in areas like high-temperature PEMFCs and improved catalyst materials, is a major growth driver. Stringent environmental regulations globally are pushing the adoption of cleaner energy solutions, favoring PEMFC technology. However, high initial investment costs and the need for robust hydrogen infrastructure remain significant barriers. Competitive substitutes, such as batteries and internal combustion engines, pose a challenge, particularly in certain applications. M&A activity within the sector is expected to increase, driven by the need for technological advancements and broader market access.
- Market Concentration: Moderately concentrated, with top 5 players holding xx% market share (2024).
- Technological Innovation: Significant advancements in catalyst technology and membrane durability are observed.
- Regulatory Landscape: Favourable government policies and incentives are driving market growth in key regions.
- Competitive Substitutes: Batteries and internal combustion engines represent significant competition in some segments.
- M&A Activity: xx deals recorded in the last 5 years, with an increasing trend predicted for the forecast period.
- End-User Demographics: Growth is driven primarily by the transportation, stationary power generation, and portable power sectors.
PEMFC Market Growth Trends & Insights
The Proton Exchange Membrane Fuel Cell (PEMFC) market is on a robust growth trajectory, propelled by escalating demand across a multitude of end-use sectors. The market was valued at **USD XX million** in 2024 and is impressively projected to reach **USD XX million** by 2033, demonstrating a significant Compound Annual Growth Rate (CAGR) of **XX%** during the forecast period. Adoption rates are particularly pronounced in regions with strong governmental support for hydrogen technologies and well-established hydrogen refueling infrastructure. This expansion is further amplified by technological breakthroughs, including the development of more efficient, durable, and cost-effective PEMFC systems. Concurrently, a global shift in consumer behavior towards sustainable and eco-friendly alternatives is a key driver, fueling the demand for PEMFC-based solutions. The market's ascent is underpinned by a confluence of factors: growing environmental consciousness, increasingly stringent emission regulations worldwide, and continuous advancements in fuel cell technology, including improved membrane materials and catalyst designs. This upward trend is anticipated to maintain its momentum over the coming decade, with ongoing innovation in material science, advanced manufacturing processes, and seamless system integration poised to be pivotal in shaping the future of the PEMFC market.
Dominant Regions, Countries, or Segments in PEMFC Market
The market is witnessing strong growth across multiple segments and regions. The Transportation sector (Automotive, Buses, Forklifts) is currently the largest segment, driven by rising demand for zero-emission vehicles. Within this segment, Automotive applications show the highest growth potential. Geographically, Asia-Pacific is predicted to dominate the market, followed by Europe and North America. Key drivers in these regions include supportive government policies, investments in hydrogen infrastructure, and a growing focus on reducing carbon emissions. The Polymer Electrolyte Membrane Fuel Cell (PEMFC) segment holds the largest market share among fuel cell types due to its higher efficiency and lower operating temperatures.
- Key Growth Drivers:
- Stringent emission regulations in major economies.
- Government subsidies and incentives for clean energy technologies.
- Growing awareness of environmental concerns among consumers.
- Technological advancements leading to improved efficiency and cost reduction.
- Dominant Regions: Asia-Pacific, Europe, North America.
- Dominant Segments: Transportation (Automotive, Buses, Forklifts), Stationary Power Generation (Residential, Commercial, Industrial), PEMFC type.
PEMFC Market Product Landscape
The PEMFC technology landscape is characterized by rapid innovation, with a relentless focus on enhancing operational efficiency, extending product lifespan, and reducing overall costs. Significant advancements are being made in material science, leading to the development of novel components that boost power density and streamline manufacturing processes. This evolution is driving the diversification of PEMFC applications, spanning from zero-emission vehicles and heavy-duty transportation to portable power solutions and stationary power generation. The compelling unique selling propositions of PEMFCs – including zero tailpipe emissions, high energy conversion efficiency, and swift refueling times – are key differentiators. Emerging technological frontiers include the development of high-temperature PEMFCs, which offer superior performance under diverse operating conditions and enhanced energy conversion capabilities.
Key Drivers, Barriers & Challenges in PEMFC Market
Key Drivers:
- Increasing demand for clean and sustainable energy sources.
- Stringent government regulations on greenhouse gas emissions.
- Growing investments in hydrogen infrastructure development.
- Technological advancements leading to improved efficiency and cost-effectiveness.
Key Challenges:
- High initial capital costs associated with PEMFC technology.
- Limited availability of hydrogen refueling infrastructure.
- Durability and lifespan of PEMFCs remain concerns.
- Competition from other clean energy technologies, such as batteries.
Emerging Opportunities in PEMFC Market
Emerging opportunities lie in expanding applications of PEMFC technology into previously untapped markets, such as off-grid power generation and small-scale industrial applications. The development of portable PEMFC systems for consumer electronics and military applications presents substantial growth potential. Further innovation in materials and design can unlock higher efficiency and lower manufacturing costs, opening new markets.
Growth Accelerators in the PEMFC Market Industry
Technological breakthroughs, particularly in the realm of advanced material science and highly efficient catalyst development, are significant growth accelerators for the PEMFC industry. Strategic collaborations and partnerships between leading fuel cell manufacturers, prominent automotive corporations, and forward-thinking energy providers are instrumental in driving innovation and expanding market reach. Furthermore, supportive government policies that champion research and development initiatives, coupled with attractive incentives for PEMFC adoption across various sectors, are poised to play a critical role in accelerating the market's growth trajectory.
Key Players Shaping the PEMFC Market Market
- Ballard Power Systems
- ITM Power PLC
- Toshiba Corporation
- Intelligent Energy Limited
- Plug Power Inc.
- Powercell Sweden AB
- Bramble Energy
- Cummins Inc.
- Bloom Energy
- Hydrogenics (a Cummins Inc. company)
Notable Milestones in PEMFC Market Sector
- October 2021: Panasonic Corporation unveiled a significant development with its pure hydrogen fuel cell generator, showcasing advancements in hydrogen-based power solutions.
- April 2022: SFC Energy and FC TecNrgy forged a strategic partnership to establish the production of methanol and hydrogen fuel cells in India, expanding manufacturing capabilities in a key emerging market.
- August 2022: The National Renewable Energy Laboratory (NREL) and Toyota announced a groundbreaking collaboration on a 1-MW PEM fuel cell power generation system, highlighting progress in large-scale fuel cell applications.
In-Depth PEMFC Market Market Outlook
The PEMFC market is poised for significant growth, driven by technological advancements, supportive government policies, and increasing environmental awareness. Strategic partnerships and investments in hydrogen infrastructure will be key to unlocking the full market potential. Companies focusing on innovation, cost reduction, and market diversification will be best positioned to capitalize on the expanding opportunities in this dynamic sector.
PEMFC Market Segmentation
- 1. Production Analysis
- 2. Consumption Analysis
- 3. Import Market Analysis (Value & Volume)
- 4. Export Market Analysis (Value & Volume)
- 5. Price Trend Analysis
PEMFC Market Segmentation By Geography
- 1. North America
- 2. Europe
- 3. Asia Pacific
- 4. Rest of the World
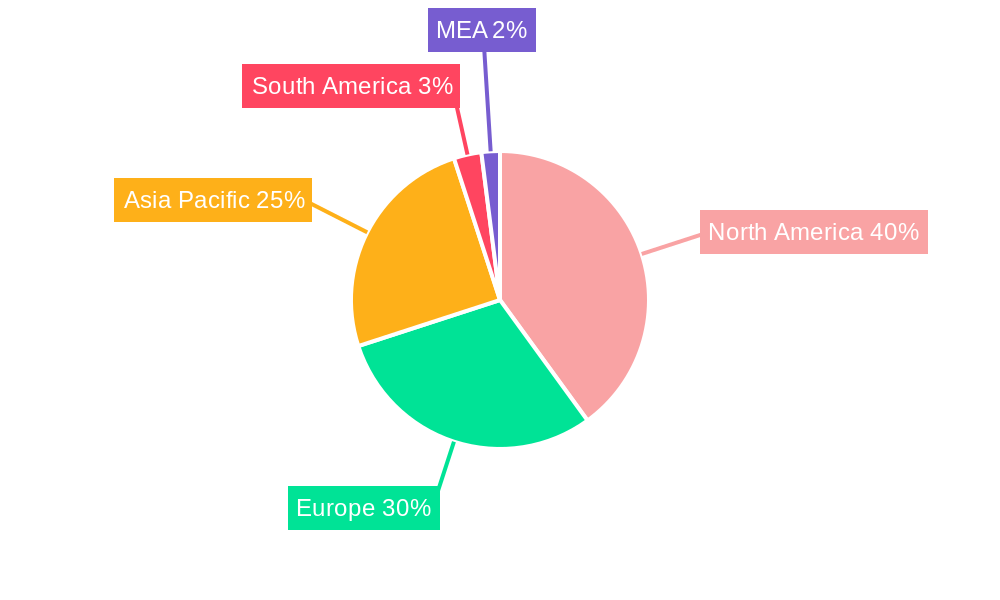
PEMFC Market Regional Market Share
Geographic Coverage of PEMFC Market
PEMFC Market REPORT HIGHLIGHTS
| Aspects | Details |
|---|---|
| Study Period | 2020-2034 |
| Base Year | 2025 |
| Estimated Year | 2026 |
| Forecast Period | 2026-2034 |
| Historical Period | 2020-2025 |
| Growth Rate | CAGR of 18.43% from 2020-2034 |
| Segmentation |
|
Table of Contents
- 1. Introduction
- 1.1. Research Scope
- 1.2. Market Segmentation
- 1.3. Research Objective
- 1.4. Definitions and Assumptions
- 2. Executive Summary
- 2.1. Market Snapshot
- 3. Market Dynamics
- 3.1. Market Drivers
- 3.2. Market Restrains
- 3.3. Market Trends
- 3.4. Market Opportunities
- 4. Market Factor Analysis
- 4.1. Porters Five Forces
- 4.1.1. Bargaining Power of Suppliers
- 4.1.2. Bargaining Power of Buyers
- 4.1.3. Threat of New Entrants
- 4.1.4. Threat of Substitutes
- 4.1.5. Competitive Rivalry
- 4.2. PESTEL analysis
- 4.3. BCG Analysis
- 4.3.1. Stars (High Growth, High Market Share)
- 4.3.2. Cash Cows (Low Growth, High Market Share)
- 4.3.3. Question Mark (High Growth, Low Market Share)
- 4.3.4. Dogs (Low Growth, Low Market Share)
- 4.4. Ansoff Matrix Analysis
- 4.5. Supply Chain Analysis
- 4.6. Regulatory Landscape
- 4.7. Current Market Potential and Opportunity Assessment (TAM–SAM–SOM Framework)
- 4.8. VDR Analyst Note
- 4.1. Porters Five Forces
- 5. Market Analysis, Insights and Forecast 2021-2033
- 5.1. Market Analysis, Insights and Forecast - by Production Analysis
- 5.2. Market Analysis, Insights and Forecast - by Consumption Analysis
- 5.3. Market Analysis, Insights and Forecast - by Import Market Analysis (Value & Volume)
- 5.4. Market Analysis, Insights and Forecast - by Export Market Analysis (Value & Volume)
- 5.5. Market Analysis, Insights and Forecast - by Price Trend Analysis
- 5.6. Market Analysis, Insights and Forecast - by Region
- 5.6.1. North America
- 5.6.2. Europe
- 5.6.3. Asia Pacific
- 5.6.4. Rest of the World
- 6. Global PEMFC Market Analysis, Insights and Forecast, 2021-2033
- 6.1. Market Analysis, Insights and Forecast - by Production Analysis
- 6.2. Market Analysis, Insights and Forecast - by Consumption Analysis
- 6.3. Market Analysis, Insights and Forecast - by Import Market Analysis (Value & Volume)
- 6.4. Market Analysis, Insights and Forecast - by Export Market Analysis (Value & Volume)
- 6.5. Market Analysis, Insights and Forecast - by Price Trend Analysis
- 7. North America PEMFC Market Analysis, Insights and Forecast, 2021-2033
- 7.1. Market Analysis, Insights and Forecast - by Production Analysis
- 7.2. Market Analysis, Insights and Forecast - by Consumption Analysis
- 7.3. Market Analysis, Insights and Forecast - by Import Market Analysis (Value & Volume)
- 7.4. Market Analysis, Insights and Forecast - by Export Market Analysis (Value & Volume)
- 7.5. Market Analysis, Insights and Forecast - by Price Trend Analysis
- 8. Europe PEMFC Market Analysis, Insights and Forecast, 2021-2033
- 8.1. Market Analysis, Insights and Forecast - by Production Analysis
- 8.2. Market Analysis, Insights and Forecast - by Consumption Analysis
- 8.3. Market Analysis, Insights and Forecast - by Import Market Analysis (Value & Volume)
- 8.4. Market Analysis, Insights and Forecast - by Export Market Analysis (Value & Volume)
- 8.5. Market Analysis, Insights and Forecast - by Price Trend Analysis
- 9. Asia Pacific PEMFC Market Analysis, Insights and Forecast, 2021-2033
- 9.1. Market Analysis, Insights and Forecast - by Production Analysis
- 9.2. Market Analysis, Insights and Forecast - by Consumption Analysis
- 9.3. Market Analysis, Insights and Forecast - by Import Market Analysis (Value & Volume)
- 9.4. Market Analysis, Insights and Forecast - by Export Market Analysis (Value & Volume)
- 9.5. Market Analysis, Insights and Forecast - by Price Trend Analysis
- 10. Rest of the World PEMFC Market Analysis, Insights and Forecast, 2021-2033
- 10.1. Market Analysis, Insights and Forecast - by Production Analysis
- 10.2. Market Analysis, Insights and Forecast - by Consumption Analysis
- 10.3. Market Analysis, Insights and Forecast - by Import Market Analysis (Value & Volume)
- 10.4. Market Analysis, Insights and Forecast - by Export Market Analysis (Value & Volume)
- 10.5. Market Analysis, Insights and Forecast - by Price Trend Analysis
- 11. Competitive Analysis
- 11.1. Company Profiles
- 11.1.1 Ballard Power Systems
- 11.1.1.1. Company Overview
- 11.1.1.2. Products
- 11.1.1.3. Company Financials
- 11.1.1.4. SWOT Analysis
- 11.1.2 ITM Power PLC
- 11.1.2.1. Company Overview
- 11.1.2.2. Products
- 11.1.2.3. Company Financials
- 11.1.2.4. SWOT Analysis
- 11.1.3 Toshiba Corporation
- 11.1.3.1. Company Overview
- 11.1.3.2. Products
- 11.1.3.3. Company Financials
- 11.1.3.4. SWOT Analysis
- 11.1.4 Intelligent Energy Limited*List Not Exhaustive
- 11.1.4.1. Company Overview
- 11.1.4.2. Products
- 11.1.4.3. Company Financials
- 11.1.4.4. SWOT Analysis
- 11.1.5 Plug Power Inc
- 11.1.5.1. Company Overview
- 11.1.5.2. Products
- 11.1.5.3. Company Financials
- 11.1.5.4. SWOT Analysis
- 11.1.6 Powercell Sweden AB
- 11.1.6.1. Company Overview
- 11.1.6.2. Products
- 11.1.6.3. Company Financials
- 11.1.6.4. SWOT Analysis
- 11.1.7 Bramble Energy
- 11.1.7.1. Company Overview
- 11.1.7.2. Products
- 11.1.7.3. Company Financials
- 11.1.7.4. SWOT Analysis
- 11.1.8 Cummins Inc
- 11.1.8.1. Company Overview
- 11.1.8.2. Products
- 11.1.8.3. Company Financials
- 11.1.8.4. SWOT Analysis
- 11.1.9 Bloom Energy
- 11.1.9.1. Company Overview
- 11.1.9.2. Products
- 11.1.9.3. Company Financials
- 11.1.9.4. SWOT Analysis
- 11.1.10 Hydrogenics (a Cummins Inc. company)
- 11.1.10.1. Company Overview
- 11.1.10.2. Products
- 11.1.10.3. Company Financials
- 11.1.10.4. SWOT Analysis
- 11.1.1 Ballard Power Systems
- 11.2. Market Entropy
- 11.2.1 Company's Key Areas Served
- 11.2.2 Recent Developments
- 11.3. Company Market Share Analysis 2025
- 11.3.1 Top 5 Companies Market Share Analysis
- 11.3.2 Top 3 Companies Market Share Analysis
- 11.4. List of Potential Customers
- 12. Research Methodology
List of Figures
- Figure 1: Global PEMFC Market Revenue Breakdown (Million, %) by Region 2025 & 2033
- Figure 2: Global PEMFC Market Volume Breakdown (Gigawatt, %) by Region 2025 & 2033
- Figure 3: North America PEMFC Market Revenue (Million), by Production Analysis 2025 & 2033
- Figure 4: North America PEMFC Market Volume (Gigawatt), by Production Analysis 2025 & 2033
- Figure 5: North America PEMFC Market Revenue Share (%), by Production Analysis 2025 & 2033
- Figure 6: North America PEMFC Market Volume Share (%), by Production Analysis 2025 & 2033
- Figure 7: North America PEMFC Market Revenue (Million), by Consumption Analysis 2025 & 2033
- Figure 8: North America PEMFC Market Volume (Gigawatt), by Consumption Analysis 2025 & 2033
- Figure 9: North America PEMFC Market Revenue Share (%), by Consumption Analysis 2025 & 2033
- Figure 10: North America PEMFC Market Volume Share (%), by Consumption Analysis 2025 & 2033
- Figure 11: North America PEMFC Market Revenue (Million), by Import Market Analysis (Value & Volume) 2025 & 2033
- Figure 12: North America PEMFC Market Volume (Gigawatt), by Import Market Analysis (Value & Volume) 2025 & 2033
- Figure 13: North America PEMFC Market Revenue Share (%), by Import Market Analysis (Value & Volume) 2025 & 2033
- Figure 14: North America PEMFC Market Volume Share (%), by Import Market Analysis (Value & Volume) 2025 & 2033
- Figure 15: North America PEMFC Market Revenue (Million), by Export Market Analysis (Value & Volume) 2025 & 2033
- Figure 16: North America PEMFC Market Volume (Gigawatt), by Export Market Analysis (Value & Volume) 2025 & 2033
- Figure 17: North America PEMFC Market Revenue Share (%), by Export Market Analysis (Value & Volume) 2025 & 2033
- Figure 18: North America PEMFC Market Volume Share (%), by Export Market Analysis (Value & Volume) 2025 & 2033
- Figure 19: North America PEMFC Market Revenue (Million), by Price Trend Analysis 2025 & 2033
- Figure 20: North America PEMFC Market Volume (Gigawatt), by Price Trend Analysis 2025 & 2033
- Figure 21: North America PEMFC Market Revenue Share (%), by Price Trend Analysis 2025 & 2033
- Figure 22: North America PEMFC Market Volume Share (%), by Price Trend Analysis 2025 & 2033
- Figure 23: North America PEMFC Market Revenue (Million), by Country 2025 & 2033
- Figure 24: North America PEMFC Market Volume (Gigawatt), by Country 2025 & 2033
- Figure 25: North America PEMFC Market Revenue Share (%), by Country 2025 & 2033
- Figure 26: North America PEMFC Market Volume Share (%), by Country 2025 & 2033
- Figure 27: Europe PEMFC Market Revenue (Million), by Production Analysis 2025 & 2033
- Figure 28: Europe PEMFC Market Volume (Gigawatt), by Production Analysis 2025 & 2033
- Figure 29: Europe PEMFC Market Revenue Share (%), by Production Analysis 2025 & 2033
- Figure 30: Europe PEMFC Market Volume Share (%), by Production Analysis 2025 & 2033
- Figure 31: Europe PEMFC Market Revenue (Million), by Consumption Analysis 2025 & 2033
- Figure 32: Europe PEMFC Market Volume (Gigawatt), by Consumption Analysis 2025 & 2033
- Figure 33: Europe PEMFC Market Revenue Share (%), by Consumption Analysis 2025 & 2033
- Figure 34: Europe PEMFC Market Volume Share (%), by Consumption Analysis 2025 & 2033
- Figure 35: Europe PEMFC Market Revenue (Million), by Import Market Analysis (Value & Volume) 2025 & 2033
- Figure 36: Europe PEMFC Market Volume (Gigawatt), by Import Market Analysis (Value & Volume) 2025 & 2033
- Figure 37: Europe PEMFC Market Revenue Share (%), by Import Market Analysis (Value & Volume) 2025 & 2033
- Figure 38: Europe PEMFC Market Volume Share (%), by Import Market Analysis (Value & Volume) 2025 & 2033
- Figure 39: Europe PEMFC Market Revenue (Million), by Export Market Analysis (Value & Volume) 2025 & 2033
- Figure 40: Europe PEMFC Market Volume (Gigawatt), by Export Market Analysis (Value & Volume) 2025 & 2033
- Figure 41: Europe PEMFC Market Revenue Share (%), by Export Market Analysis (Value & Volume) 2025 & 2033
- Figure 42: Europe PEMFC Market Volume Share (%), by Export Market Analysis (Value & Volume) 2025 & 2033
- Figure 43: Europe PEMFC Market Revenue (Million), by Price Trend Analysis 2025 & 2033
- Figure 44: Europe PEMFC Market Volume (Gigawatt), by Price Trend Analysis 2025 & 2033
- Figure 45: Europe PEMFC Market Revenue Share (%), by Price Trend Analysis 2025 & 2033
- Figure 46: Europe PEMFC Market Volume Share (%), by Price Trend Analysis 2025 & 2033
- Figure 47: Europe PEMFC Market Revenue (Million), by Country 2025 & 2033
- Figure 48: Europe PEMFC Market Volume (Gigawatt), by Country 2025 & 2033
- Figure 49: Europe PEMFC Market Revenue Share (%), by Country 2025 & 2033
- Figure 50: Europe PEMFC Market Volume Share (%), by Country 2025 & 2033
- Figure 51: Asia Pacific PEMFC Market Revenue (Million), by Production Analysis 2025 & 2033
- Figure 52: Asia Pacific PEMFC Market Volume (Gigawatt), by Production Analysis 2025 & 2033
- Figure 53: Asia Pacific PEMFC Market Revenue Share (%), by Production Analysis 2025 & 2033
- Figure 54: Asia Pacific PEMFC Market Volume Share (%), by Production Analysis 2025 & 2033
- Figure 55: Asia Pacific PEMFC Market Revenue (Million), by Consumption Analysis 2025 & 2033
- Figure 56: Asia Pacific PEMFC Market Volume (Gigawatt), by Consumption Analysis 2025 & 2033
- Figure 57: Asia Pacific PEMFC Market Revenue Share (%), by Consumption Analysis 2025 & 2033
- Figure 58: Asia Pacific PEMFC Market Volume Share (%), by Consumption Analysis 2025 & 2033
- Figure 59: Asia Pacific PEMFC Market Revenue (Million), by Import Market Analysis (Value & Volume) 2025 & 2033
- Figure 60: Asia Pacific PEMFC Market Volume (Gigawatt), by Import Market Analysis (Value & Volume) 2025 & 2033
- Figure 61: Asia Pacific PEMFC Market Revenue Share (%), by Import Market Analysis (Value & Volume) 2025 & 2033
- Figure 62: Asia Pacific PEMFC Market Volume Share (%), by Import Market Analysis (Value & Volume) 2025 & 2033
- Figure 63: Asia Pacific PEMFC Market Revenue (Million), by Export Market Analysis (Value & Volume) 2025 & 2033
- Figure 64: Asia Pacific PEMFC Market Volume (Gigawatt), by Export Market Analysis (Value & Volume) 2025 & 2033
- Figure 65: Asia Pacific PEMFC Market Revenue Share (%), by Export Market Analysis (Value & Volume) 2025 & 2033
- Figure 66: Asia Pacific PEMFC Market Volume Share (%), by Export Market Analysis (Value & Volume) 2025 & 2033
- Figure 67: Asia Pacific PEMFC Market Revenue (Million), by Price Trend Analysis 2025 & 2033
- Figure 68: Asia Pacific PEMFC Market Volume (Gigawatt), by Price Trend Analysis 2025 & 2033
- Figure 69: Asia Pacific PEMFC Market Revenue Share (%), by Price Trend Analysis 2025 & 2033
- Figure 70: Asia Pacific PEMFC Market Volume Share (%), by Price Trend Analysis 2025 & 2033
- Figure 71: Asia Pacific PEMFC Market Revenue (Million), by Country 2025 & 2033
- Figure 72: Asia Pacific PEMFC Market Volume (Gigawatt), by Country 2025 & 2033
- Figure 73: Asia Pacific PEMFC Market Revenue Share (%), by Country 2025 & 2033
- Figure 74: Asia Pacific PEMFC Market Volume Share (%), by Country 2025 & 2033
- Figure 75: Rest of the World PEMFC Market Revenue (Million), by Production Analysis 2025 & 2033
- Figure 76: Rest of the World PEMFC Market Volume (Gigawatt), by Production Analysis 2025 & 2033
- Figure 77: Rest of the World PEMFC Market Revenue Share (%), by Production Analysis 2025 & 2033
- Figure 78: Rest of the World PEMFC Market Volume Share (%), by Production Analysis 2025 & 2033
- Figure 79: Rest of the World PEMFC Market Revenue (Million), by Consumption Analysis 2025 & 2033
- Figure 80: Rest of the World PEMFC Market Volume (Gigawatt), by Consumption Analysis 2025 & 2033
- Figure 81: Rest of the World PEMFC Market Revenue Share (%), by Consumption Analysis 2025 & 2033
- Figure 82: Rest of the World PEMFC Market Volume Share (%), by Consumption Analysis 2025 & 2033
- Figure 83: Rest of the World PEMFC Market Revenue (Million), by Import Market Analysis (Value & Volume) 2025 & 2033
- Figure 84: Rest of the World PEMFC Market Volume (Gigawatt), by Import Market Analysis (Value & Volume) 2025 & 2033
- Figure 85: Rest of the World PEMFC Market Revenue Share (%), by Import Market Analysis (Value & Volume) 2025 & 2033
- Figure 86: Rest of the World PEMFC Market Volume Share (%), by Import Market Analysis (Value & Volume) 2025 & 2033
- Figure 87: Rest of the World PEMFC Market Revenue (Million), by Export Market Analysis (Value & Volume) 2025 & 2033
- Figure 88: Rest of the World PEMFC Market Volume (Gigawatt), by Export Market Analysis (Value & Volume) 2025 & 2033
- Figure 89: Rest of the World PEMFC Market Revenue Share (%), by Export Market Analysis (Value & Volume) 2025 & 2033
- Figure 90: Rest of the World PEMFC Market Volume Share (%), by Export Market Analysis (Value & Volume) 2025 & 2033
- Figure 91: Rest of the World PEMFC Market Revenue (Million), by Price Trend Analysis 2025 & 2033
- Figure 92: Rest of the World PEMFC Market Volume (Gigawatt), by Price Trend Analysis 2025 & 2033
- Figure 93: Rest of the World PEMFC Market Revenue Share (%), by Price Trend Analysis 2025 & 2033
- Figure 94: Rest of the World PEMFC Market Volume Share (%), by Price Trend Analysis 2025 & 2033
- Figure 95: Rest of the World PEMFC Market Revenue (Million), by Country 2025 & 2033
- Figure 96: Rest of the World PEMFC Market Volume (Gigawatt), by Country 2025 & 2033
- Figure 97: Rest of the World PEMFC Market Revenue Share (%), by Country 2025 & 2033
- Figure 98: Rest of the World PEMFC Market Volume Share (%), by Country 2025 & 2033
List of Tables
- Table 1: Global PEMFC Market Revenue Million Forecast, by Production Analysis 2020 & 2033
- Table 2: Global PEMFC Market Volume Gigawatt Forecast, by Production Analysis 2020 & 2033
- Table 3: Global PEMFC Market Revenue Million Forecast, by Consumption Analysis 2020 & 2033
- Table 4: Global PEMFC Market Volume Gigawatt Forecast, by Consumption Analysis 2020 & 2033
- Table 5: Global PEMFC Market Revenue Million Forecast, by Import Market Analysis (Value & Volume) 2020 & 2033
- Table 6: Global PEMFC Market Volume Gigawatt Forecast, by Import Market Analysis (Value & Volume) 2020 & 2033
- Table 7: Global PEMFC Market Revenue Million Forecast, by Export Market Analysis (Value & Volume) 2020 & 2033
- Table 8: Global PEMFC Market Volume Gigawatt Forecast, by Export Market Analysis (Value & Volume) 2020 & 2033
- Table 9: Global PEMFC Market Revenue Million Forecast, by Price Trend Analysis 2020 & 2033
- Table 10: Global PEMFC Market Volume Gigawatt Forecast, by Price Trend Analysis 2020 & 2033
- Table 11: Global PEMFC Market Revenue Million Forecast, by Region 2020 & 2033
- Table 12: Global PEMFC Market Volume Gigawatt Forecast, by Region 2020 & 2033
- Table 13: Global PEMFC Market Revenue Million Forecast, by Production Analysis 2020 & 2033
- Table 14: Global PEMFC Market Volume Gigawatt Forecast, by Production Analysis 2020 & 2033
- Table 15: Global PEMFC Market Revenue Million Forecast, by Consumption Analysis 2020 & 2033
- Table 16: Global PEMFC Market Volume Gigawatt Forecast, by Consumption Analysis 2020 & 2033
- Table 17: Global PEMFC Market Revenue Million Forecast, by Import Market Analysis (Value & Volume) 2020 & 2033
- Table 18: Global PEMFC Market Volume Gigawatt Forecast, by Import Market Analysis (Value & Volume) 2020 & 2033
- Table 19: Global PEMFC Market Revenue Million Forecast, by Export Market Analysis (Value & Volume) 2020 & 2033
- Table 20: Global PEMFC Market Volume Gigawatt Forecast, by Export Market Analysis (Value & Volume) 2020 & 2033
- Table 21: Global PEMFC Market Revenue Million Forecast, by Price Trend Analysis 2020 & 2033
- Table 22: Global PEMFC Market Volume Gigawatt Forecast, by Price Trend Analysis 2020 & 2033
- Table 23: Global PEMFC Market Revenue Million Forecast, by Country 2020 & 2033
- Table 24: Global PEMFC Market Volume Gigawatt Forecast, by Country 2020 & 2033
- Table 25: Global PEMFC Market Revenue Million Forecast, by Production Analysis 2020 & 2033
- Table 26: Global PEMFC Market Volume Gigawatt Forecast, by Production Analysis 2020 & 2033
- Table 27: Global PEMFC Market Revenue Million Forecast, by Consumption Analysis 2020 & 2033
- Table 28: Global PEMFC Market Volume Gigawatt Forecast, by Consumption Analysis 2020 & 2033
- Table 29: Global PEMFC Market Revenue Million Forecast, by Import Market Analysis (Value & Volume) 2020 & 2033
- Table 30: Global PEMFC Market Volume Gigawatt Forecast, by Import Market Analysis (Value & Volume) 2020 & 2033
- Table 31: Global PEMFC Market Revenue Million Forecast, by Export Market Analysis (Value & Volume) 2020 & 2033
- Table 32: Global PEMFC Market Volume Gigawatt Forecast, by Export Market Analysis (Value & Volume) 2020 & 2033
- Table 33: Global PEMFC Market Revenue Million Forecast, by Price Trend Analysis 2020 & 2033
- Table 34: Global PEMFC Market Volume Gigawatt Forecast, by Price Trend Analysis 2020 & 2033
- Table 35: Global PEMFC Market Revenue Million Forecast, by Country 2020 & 2033
- Table 36: Global PEMFC Market Volume Gigawatt Forecast, by Country 2020 & 2033
- Table 37: Global PEMFC Market Revenue Million Forecast, by Production Analysis 2020 & 2033
- Table 38: Global PEMFC Market Volume Gigawatt Forecast, by Production Analysis 2020 & 2033
- Table 39: Global PEMFC Market Revenue Million Forecast, by Consumption Analysis 2020 & 2033
- Table 40: Global PEMFC Market Volume Gigawatt Forecast, by Consumption Analysis 2020 & 2033
- Table 41: Global PEMFC Market Revenue Million Forecast, by Import Market Analysis (Value & Volume) 2020 & 2033
- Table 42: Global PEMFC Market Volume Gigawatt Forecast, by Import Market Analysis (Value & Volume) 2020 & 2033
- Table 43: Global PEMFC Market Revenue Million Forecast, by Export Market Analysis (Value & Volume) 2020 & 2033
- Table 44: Global PEMFC Market Volume Gigawatt Forecast, by Export Market Analysis (Value & Volume) 2020 & 2033
- Table 45: Global PEMFC Market Revenue Million Forecast, by Price Trend Analysis 2020 & 2033
- Table 46: Global PEMFC Market Volume Gigawatt Forecast, by Price Trend Analysis 2020 & 2033
- Table 47: Global PEMFC Market Revenue Million Forecast, by Country 2020 & 2033
- Table 48: Global PEMFC Market Volume Gigawatt Forecast, by Country 2020 & 2033
- Table 49: Global PEMFC Market Revenue Million Forecast, by Production Analysis 2020 & 2033
- Table 50: Global PEMFC Market Volume Gigawatt Forecast, by Production Analysis 2020 & 2033
- Table 51: Global PEMFC Market Revenue Million Forecast, by Consumption Analysis 2020 & 2033
- Table 52: Global PEMFC Market Volume Gigawatt Forecast, by Consumption Analysis 2020 & 2033
- Table 53: Global PEMFC Market Revenue Million Forecast, by Import Market Analysis (Value & Volume) 2020 & 2033
- Table 54: Global PEMFC Market Volume Gigawatt Forecast, by Import Market Analysis (Value & Volume) 2020 & 2033
- Table 55: Global PEMFC Market Revenue Million Forecast, by Export Market Analysis (Value & Volume) 2020 & 2033
- Table 56: Global PEMFC Market Volume Gigawatt Forecast, by Export Market Analysis (Value & Volume) 2020 & 2033
- Table 57: Global PEMFC Market Revenue Million Forecast, by Price Trend Analysis 2020 & 2033
- Table 58: Global PEMFC Market Volume Gigawatt Forecast, by Price Trend Analysis 2020 & 2033
- Table 59: Global PEMFC Market Revenue Million Forecast, by Country 2020 & 2033
- Table 60: Global PEMFC Market Volume Gigawatt Forecast, by Country 2020 & 2033
Frequently Asked Questions
1. What is the projected Compound Annual Growth Rate (CAGR) of the PEMFC Market?
The projected CAGR is approximately 18.43%.
2. Which companies are prominent players in the PEMFC Market?
Key companies in the market include Ballard Power Systems, ITM Power PLC, Toshiba Corporation, Intelligent Energy Limited*List Not Exhaustive, Plug Power Inc, Powercell Sweden AB, Bramble Energy, Cummins Inc, Bloom Energy, Hydrogenics (a Cummins Inc. company).
3. What are the main segments of the PEMFC Market?
The market segments include Production Analysis, Consumption Analysis, Import Market Analysis (Value & Volume), Export Market Analysis (Value & Volume), Price Trend Analysis.
4. Can you provide details about the market size?
The market size is estimated to be USD 3.58 Million as of 2022.
5. What are some drivers contributing to market growth?
4.; Growing Demand for Solar Energy4.; Reducing Solar Panel Costs and Associated Components for Solar Projects.
6. What are the notable trends driving market growth?
Government Initiatives and Growing Private Investments are Expected to Drive the Market.
7. Are there any restraints impacting market growth?
4.; Availability of Pure Silicon to make Solar PV Cells.
8. Can you provide examples of recent developments in the market?
August 2022: The National Renewable Energy Laboratory (NREL) began collaborating with Toyota Motor North America (Toyota) through a cooperative research and development agreement to build, install, and evaluate a 1-megawatt (MW) proton exchange membrane (PEM) fuel cell power generation system at NREL's Flatirons Campus.
9. What pricing options are available for accessing the report?
Pricing options include single-user, multi-user, and enterprise licenses priced at USD 4750, USD 5250, and USD 8750 respectively.
10. Is the market size provided in terms of value or volume?
The market size is provided in terms of value, measured in Million and volume, measured in Gigawatt.
11. Are there any specific market keywords associated with the report?
Yes, the market keyword associated with the report is "PEMFC Market," which aids in identifying and referencing the specific market segment covered.
12. How do I determine which pricing option suits my needs best?
The pricing options vary based on user requirements and access needs. Individual users may opt for single-user licenses, while businesses requiring broader access may choose multi-user or enterprise licenses for cost-effective access to the report.
13. Are there any additional resources or data provided in the PEMFC Market report?
While the report offers comprehensive insights, it's advisable to review the specific contents or supplementary materials provided to ascertain if additional resources or data are available.
14. How can I stay updated on further developments or reports in the PEMFC Market?
To stay informed about further developments, trends, and reports in the PEMFC Market, consider subscribing to industry newsletters, following relevant companies and organizations, or regularly checking reputable industry news sources and publications.
Methodology
Step 1 - Identification of Relevant Samples Size from Population Database


Step 2 - Approaches for Defining Global Market Size (Value, Volume* & Price*)

Note*: In applicable scenarios
Step 3 - Data Sources
Primary Research
- Web Analytics
- Survey Reports
- Research Institute
- Latest Research Reports
- Opinion Leaders
Secondary Research
- Annual Reports
- White Paper
- Latest Press Release
- Industry Association
- Paid Database
- Investor Presentations

Step 4 - Data Triangulation
Involves using different sources of information in order to increase the validity of a study
These sources are likely to be stakeholders in a program - participants, other researchers, program staff, other community members, and so on.
Then we put all data in single framework & apply various statistical tools to find out the dynamic on the market.
During the analysis stage, feedback from the stakeholder groups would be compared to determine areas of agreement as well as areas of divergence