

Key Insights
The global pea starch market is poised for robust expansion, projecting a market size of USD 194.32 million in 2025, with a compelling Compound Annual Growth Rate (CAGR) of 8.33% expected to extend through 2033. This significant growth is propelled by a confluence of factors, primarily driven by the escalating demand for plant-based and clean-label ingredients across the food and beverage sector. Consumers are increasingly seeking healthier alternatives, and pea starch, with its non-GMO and allergen-free properties, perfectly aligns with these preferences. Its versatility as a functional ingredient, offering excellent thickening, binding, and texturizing capabilities, makes it indispensable in a wide array of applications, including bakery products, snacks, cereals, soups, sauces, and dairy alternatives. Furthermore, the burgeoning animal feed and pet food industries, coupled with a growing appreciation for natural ingredients in personal care and cosmetics, are contributing substantially to market momentum.

Pea Starch Industry Market Size (In Million)
The market landscape is characterized by a dynamic interplay of evolving consumer choices and strategic industry advancements. While the organic segment is anticipated to witness particularly strong growth due to increasing consumer preference for sustainably sourced products, the conventional segment continues to maintain a significant market share. Emerging trends such as the development of novel pea starch derivatives with enhanced functionalities and the expansion of production capacities by key players are shaping market dynamics. However, certain challenges, including price volatility of raw materials and the presence of established starch alternatives, necessitate strategic navigation for sustained growth. Despite these considerations, the inherent advantages of pea starch, its adaptability to diverse applications, and the overarching trend towards healthier, sustainable food options firmly position it for continued upward trajectory in the coming years.

Pea Starch Industry Company Market Share
This report offers an in-depth analysis of the global Pea Starch Industry, exploring market dynamics, growth trends, regional dominance, product landscape, key drivers, barriers, opportunities, and future outlook. With a study period spanning from 2019 to 2033, including a base year of 2025 and a forecast period from 2025–2033, this comprehensive report provides actionable insights for stakeholders seeking to capitalize on the burgeoning plant-based ingredients market.
Pea Starch Industry Market Dynamics & Structure
The pea starch market is characterized by a moderately consolidated structure, with key players focusing on technological innovation and strategic expansions. Market concentration is influenced by the R&D capabilities and production capacities of leading manufacturers like Roquette Freres and Ingredion Incorporated, who are actively investing in advanced processing technologies to enhance product purity and functionality. Technological innovation is a primary driver, particularly in developing modified pea starches with tailored functionalities for specific applications. Regulatory frameworks, while generally supportive of plant-based ingredients, can vary by region, impacting import/export dynamics and product certification. Competitive product substitutes include other starches like corn, potato, and tapioca starch, but pea starch's unique nutritional profile and clean-label appeal are creating differentiation. End-user demographics are shifting towards health-conscious consumers and those seeking gluten-free and non-GMO options, driving demand in food and beverage applications. Mergers and acquisitions (M&A) are a significant trend, with companies seeking to expand their product portfolios and geographical reach. For instance, a recent M&A deal in the parent market valued at approximately $500 million signifies the growing consolidation and investment in this sector. Innovation barriers include the capital-intensive nature of advanced starch modification technologies and the need for robust supply chain management to ensure consistent raw material quality.
- Market Concentration: Moderately consolidated with a few dominant players.
- Technological Innovation Drivers: Enhanced functionality, purity, and sustainability of modified pea starches.
- Regulatory Frameworks: Generally favorable for plant-based ingredients, with regional variations.
- Competitive Product Substitutes: Corn starch, potato starch, tapioca starch.
- End-User Demographics: Growing demand from health-conscious consumers, vegans, and those with dietary restrictions.
- M&A Trends: Active consolidation to expand product offerings and market access.
- Innovation Barriers: High R&D costs, complex processing technologies, and supply chain complexities.
Pea Starch Industry Growth Trends & Insights
The global pea starch market is poised for robust growth, projected to expand at a Compound Annual Growth Rate (CAGR) of approximately 6.8% from 2025 to 2033, reaching an estimated market size of $5,900 million by 2033. This growth trajectory is underpinned by several significant trends, including the escalating consumer preference for plant-based and gluten-free food products, a direct response to growing health consciousness and dietary awareness. The "clean label" movement further amplifies the demand for natural and minimally processed ingredients like pea starch. Technological advancements in pea starch processing are leading to the development of highly functional ingredients with superior texturizing, binding, and gelling properties, expanding their applicability beyond traditional uses. This innovation is crucial for meeting the evolving demands of the food and beverage industry, particularly in sectors like bakery products, where pea starch can improve texture and shelf-life, and in dairy alternatives, where it acts as a stabilizer and emulsifier.
The parent market for plant-based proteins and starches is experiencing a surge, with pea starch carving out a significant niche within it. The adoption rates for pea starch are steadily increasing across various applications as manufacturers recognize its versatility and sustainability benefits compared to conventional alternatives. For example, the child market segment of "Meat and Meat Products" is seeing a 7.5% year-on-year increase in the adoption of pea starch as a binding agent and texturizer in plant-based meat alternatives. Furthermore, the animal feed and pet food industries are increasingly incorporating pea starch due to its digestible nature and nutritional value, contributing to market expansion. The personal care and cosmetics sector is also emerging as a significant growth avenue, leveraging pea starch's natural properties for skincare and haircare formulations. Consumer behavior shifts towards sustainable and ethically sourced products are directly benefiting the pea starch industry, as peas are a more sustainable crop compared to many other starch sources, requiring less water and nitrogen fertilizer. The market penetration of pea starch in the nascent plant-based confectionery market is predicted to reach 15% by 2028, showcasing its potential to disrupt traditional ingredient landscapes.
Dominant Regions, Countries, or Segments in Pea Starch Industry
North America currently holds a dominant position in the global pea starch market, driven by robust consumer demand for plant-based and clean-label food products, coupled with significant investments in agricultural innovation and processing infrastructure. The United States, in particular, accounts for approximately 35% of the global market share, fueled by a well-established food and beverage industry and a progressive regulatory environment that encourages the adoption of novel ingredients. Economic policies in the region actively support the growth of sustainable agriculture and food processing, creating a favorable landscape for pea starch manufacturers.
Within the segment analysis, the "Food and Beverage" application category is the largest revenue generator, contributing over 70% of the total market value. Within this broad category, "Bakery Products" and "Snacks and Cereals" represent the most significant child markets, with a combined market share of approximately 45%. The increasing popularity of gluten-free baked goods and extruded snacks, where pea starch provides excellent texture, binding, and palatability, is the primary growth driver. The "Meat and Meat Products" segment, particularly in the context of plant-based meat alternatives, is experiencing the highest growth rate at an estimated 8.2% CAGR, as pea starch offers crucial texturizing and binding functionalities.
The "Organic" source segment is witnessing a significantly higher growth rate (approximately 7.9% CAGR) compared to "Conventional" sources (around 5.5% CAGR), reflecting a strong consumer preference for sustainably produced and non-GMO ingredients. This trend is particularly pronounced in North America and Europe. Key drivers for regional dominance include advanced R&D capabilities, a strong presence of major players like Ingredion Incorporated and Vestkorn Milling AS, and high disposable incomes that support the consumption of premium, health-oriented food products. Europe, with countries like Germany and the UK leading the adoption, is the second-largest market, showing a substantial CAGR of 6.5% driven by similar consumer trends and increasing investment in plant-based food innovation. Asia-Pacific is an emerging market with high growth potential, expected to grow at a CAGR of 7.1%, propelled by rising health consciousness and increasing demand for processed foods.
Pea Starch Industry Product Landscape
The pea starch product landscape is evolving with a focus on enhanced functionality and sustainability. Innovations include modified pea starches offering improved thermal stability, viscosity control, and gelation properties for a wider range of food applications. Products like Ingredion's Purity P 1002 pea starch exemplify this trend, providing versatility for plant-based cheese, confectionery, and gluten-free baked goods with a clean-label appeal. Unique selling propositions often revolve around gluten-free, non-GMO, and allergen-free attributes, catering to specific dietary needs. Technological advancements in enzymatic and physical modification processes are creating specialized pea starches with tailored textures and functionalities, expanding their use beyond basic thickening to sophisticated texturizing and emulsifying roles in dairy alternatives, sauces, and processed meats. The parent market for plant-based ingredients is witnessing a consistent stream of such product launches.
Key Drivers, Barriers & Challenges in Pea Starch Industry
Key Drivers: The pea starch industry is propelled by several critical factors. A primary driver is the escalating global demand for plant-based and alternative protein ingredients, fueled by growing health consciousness, ethical considerations, and environmental sustainability awareness among consumers. The "clean label" trend, favoring natural, recognizable ingredients, further boosts pea starch adoption. Technological advancements in processing and modification are yielding starches with enhanced functionalities, making them suitable for a broader array of applications, from dairy alternatives to gluten-free baked goods. Government initiatives promoting sustainable agriculture and plant-based diets also play a significant role. The parent market for plant-based alternatives is experiencing substantial growth, directly benefiting pea starch.
Barriers & Challenges: Despite its promising growth, the pea starch industry faces certain challenges. Supply chain volatility, including fluctuations in pea crop yields due to weather patterns and disease, can impact raw material availability and pricing. The capital-intensive nature of advanced starch modification technologies presents a barrier for smaller players. Competition from established starches like corn and potato starch, which are often more cost-effective in certain applications, remains a significant hurdle. Regulatory complexities in different regions regarding food additive approvals and labeling can also pose challenges. Furthermore, consumer perception and acceptance of novel ingredients can influence market penetration, requiring continuous education and marketing efforts. The estimated cost impact of supply chain disruptions on the pea starch market is around $150 million annually.
Emerging Opportunities in Pea Starch Industry
Emerging opportunities in the pea starch industry are multifaceted and hold significant potential for market expansion. The burgeoning plant-based food sector, particularly in categories like dairy alternatives, plant-based meats, and egg substitutes, presents a substantial growth avenue where pea starch's textural and binding properties are highly valued. The increasing demand for gluten-free products, driven by health trends and celiac disease awareness, opens up opportunities in bakery, confectionery, and snack applications. Furthermore, the personal care and cosmetics industry is increasingly seeking natural and sustainable ingredients, offering pea starch opportunities in formulations for skincare, haircare, and color cosmetics. Untapped markets in developing economies, where the awareness and demand for plant-based options are growing, represent significant future growth potential. The parent market for food ingredients is actively exploring these niches.
Growth Accelerators in the Pea Starch Industry Industry
The long-term growth of the pea starch industry is being accelerated by several key factors. Continuous investment in research and development by key players is leading to the creation of highly functionalized pea starches with tailored properties for niche applications, driving innovation and market penetration. Strategic partnerships and collaborations between ingredient manufacturers, food processors, and research institutions are fostering the development of new products and accelerating market adoption. Expansion into new geographical markets, particularly in Asia-Pacific and Latin America, where the demand for plant-based alternatives is rapidly rising, is a significant growth accelerator. The development of sustainable sourcing and production practices is not only meeting consumer demand but also enhancing the industry's appeal and long-term viability. The estimated market expansion in emerging economies is projected to contribute an additional $1,000 million to the global pea starch market by 2030.
Key Players Shaping the Pea Starch Industry Market
- Vestkorn Milling AS
- Groupe Emsland
- The Scoular Company
- Axiom Foods Inc
- Meelunie BV
- Ingredion Incorporated
- Cosucra- Groupe Warcoing
- Roquette Freres
- Puris Foods
- Yantai Shuangta Food Co Ltd
Notable Milestones in Pea Starch Industry Sector
- October 2022: Roquette Freres, a plant-based ingredients company, launched a new line of organic pea ingredients, including pea starch and organic pea protein, available in North America, Mexico, and Europe. This expansion significantly boosted the availability and adoption of organic pea ingredients.
- May 2021: Gillco Ingredients and Cosucra Inc. entered a distribution agreement. Gillco began distributing specialty ingredients like Nastar native pea starch to end customers across multiple consumer sectors in the United States, enhancing market reach.
- March 2021: Ingredion added two new ingredients to its plant-based portfolio: VitessensePulse 1853 pea protein isolate and Purity P 1002 pea starch. Both ingredients are 100% sustainably sourced from North American farms. Purity P 1002 native pea starch offers versatility and clean-label appeal for applications such as plant-based cheese, gelatin-free confectionery, and gluten-free baked goods, demonstrating innovation in product development and sustainable sourcing.
In-Depth Pea Starch Industry Market Outlook
The future outlook for the pea starch industry is exceptionally bright, driven by persistent and accelerating trends in health, wellness, and sustainability. Growth accelerators such as continuous product innovation, the expansion of plant-based food categories, and increasing consumer awareness about the benefits of non-GMO and gluten-free ingredients will propel the market forward. Strategic opportunities lie in capitalizing on the demand for clean-label ingredients in emerging markets and further diversifying applications within the personal care and industrial sectors. The market is expected to see continued investment in R&D, leading to more specialized and functional pea starch derivatives, thus solidifying its position as a key ingredient in the global food and ingredient landscape. The estimated future market potential, building on current growth trajectories, suggests a sustained upward trend with significant opportunities for market leaders and new entrants alike.
Pea Starch Industry Segmentation
-
1. Source
- 1.1. Organic
- 1.2. Conventional
-
2. Application
-
2.1. Food and Beverage
- 2.1.1. Bakery Products
- 2.1.2. Soups and Sauces
- 2.1.3. Snacks and Cereals
- 2.1.4. Meat and Meat Products
- 2.1.5. Dairy
- 2.1.6. Other Food and Beverage Applications
- 2.2. Animal Feed and Pet Food
- 2.3. Personal Care and Cosmetics
-
2.1. Food and Beverage
Pea Starch Industry Segmentation By Geography
-
1. North America
- 1.1. United States
- 1.2. Canada
- 1.3. Mexico
- 1.4. Rest of North America
-
2. Europe
- 2.1. United Kingdom
- 2.2. Germany
- 2.3. Spain
- 2.4. France
- 2.5. Italy
- 2.6. Russia
- 2.7. Rest of Europe
-
3. Asia Pacific
- 3.1. China
- 3.2. Japan
- 3.3. India
- 3.4. Australia
- 3.5. Rest of Asia Pacific
-
4. South America
- 4.1. Brazil
- 4.2. Argentina
- 4.3. Rest of South America
-
5. Middle East and Africa
- 5.1. Saudi Arabia
- 5.2. South Africa
- 5.3. Rest of Middle East and Africa
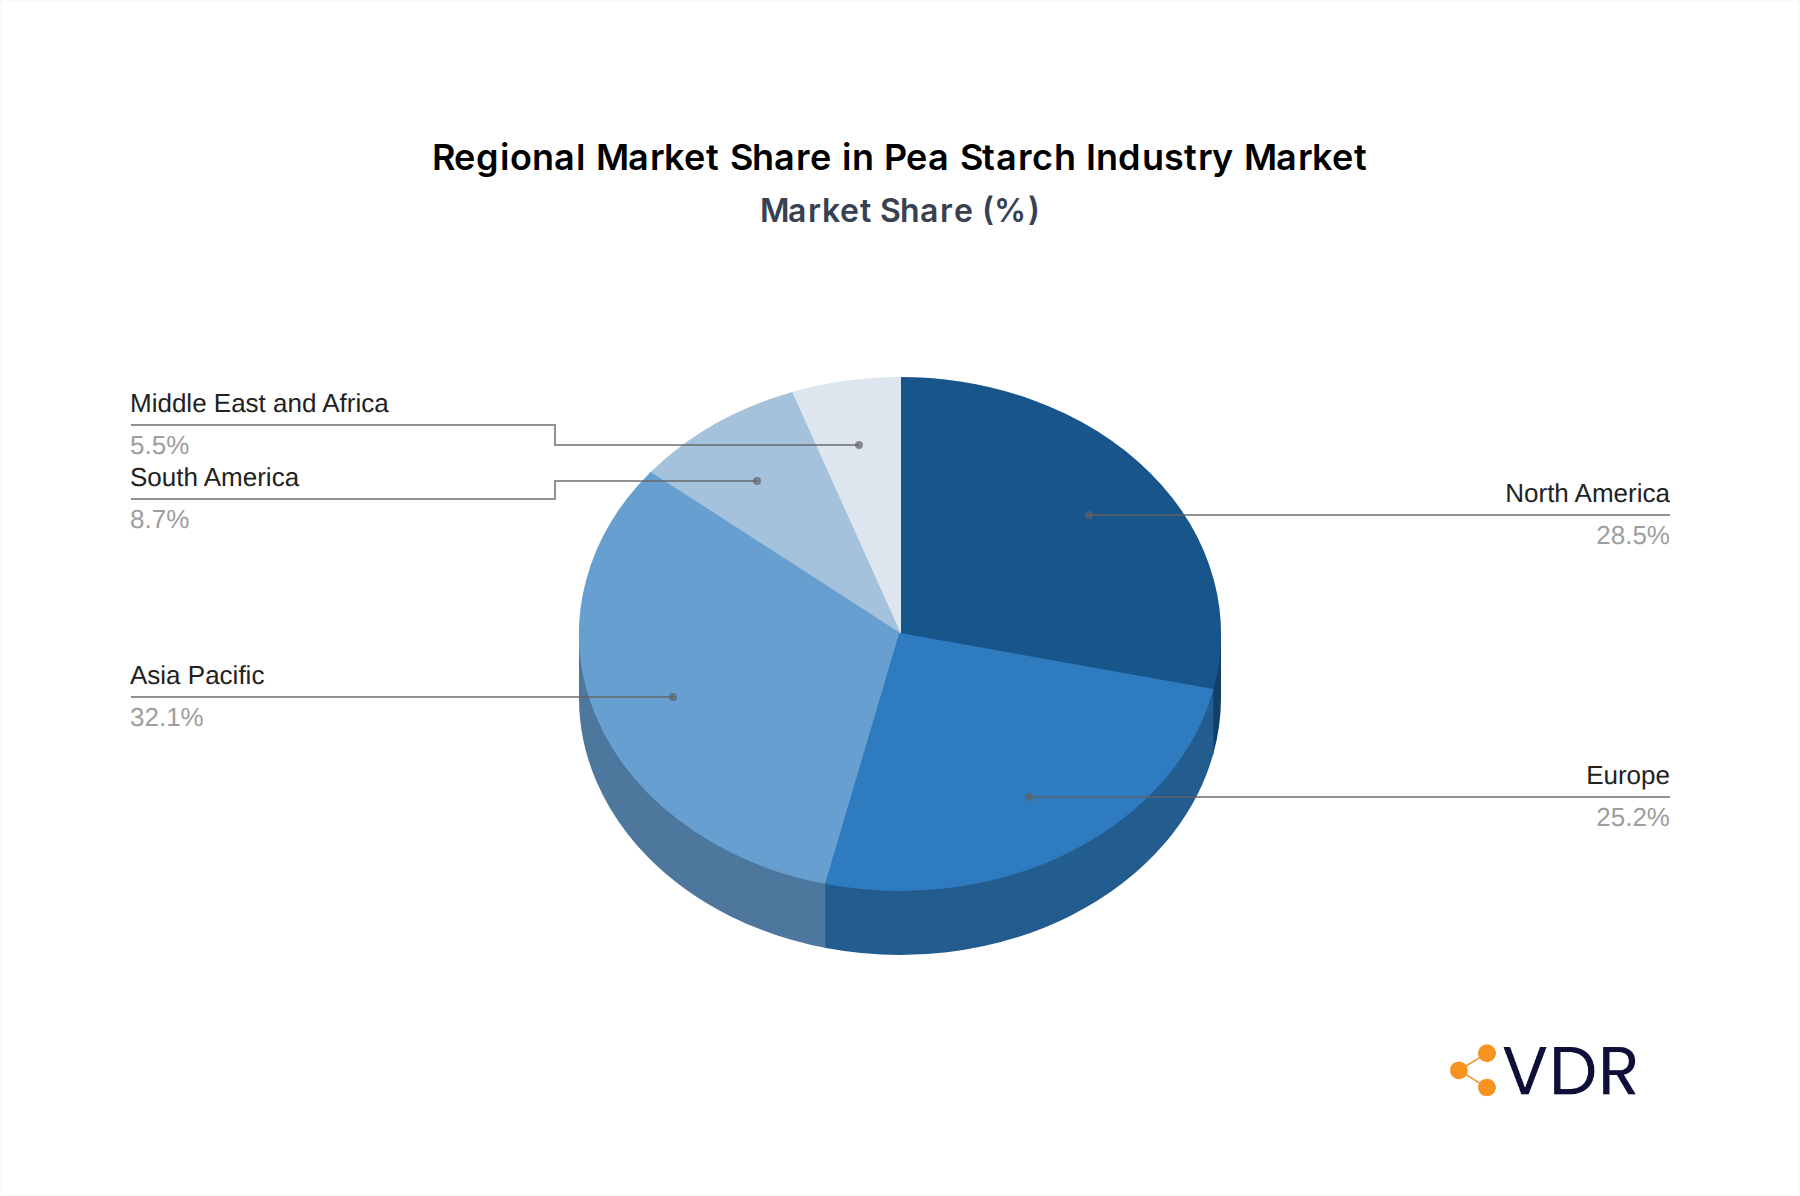
Pea Starch Industry Regional Market Share
Geographic Coverage of Pea Starch Industry
Pea Starch Industry REPORT HIGHLIGHTS
| Aspects | Details |
|---|---|
| Study Period | 2020-2034 |
| Base Year | 2025 |
| Estimated Year | 2026 |
| Forecast Period | 2026-2034 |
| Historical Period | 2020-2025 |
| Growth Rate | CAGR of 8.33% from 2020-2034 |
| Segmentation |
|
Table of Contents
- 1. Introduction
- 1.1. Research Scope
- 1.2. Market Segmentation
- 1.3. Research Objective
- 1.4. Definitions and Assumptions
- 2. Executive Summary
- 2.1. Market Snapshot
- 3. Market Dynamics
- 3.1. Market Drivers
- 3.2. Market Restrains
- 3.3. Market Trends
- 3.4. Market Opportunities
- 4. Market Factor Analysis
- 4.1. Porters Five Forces
- 4.1.1. Bargaining Power of Suppliers
- 4.1.2. Bargaining Power of Buyers
- 4.1.3. Threat of New Entrants
- 4.1.4. Threat of Substitutes
- 4.1.5. Competitive Rivalry
- 4.2. PESTEL analysis
- 4.3. BCG Analysis
- 4.3.1. Stars (High Growth, High Market Share)
- 4.3.2. Cash Cows (Low Growth, High Market Share)
- 4.3.3. Question Mark (High Growth, Low Market Share)
- 4.3.4. Dogs (Low Growth, Low Market Share)
- 4.4. Ansoff Matrix Analysis
- 4.5. Supply Chain Analysis
- 4.6. Regulatory Landscape
- 4.7. Current Market Potential and Opportunity Assessment (TAM–SAM–SOM Framework)
- 4.8. VDR Analyst Note
- 4.1. Porters Five Forces
- 5. Market Analysis, Insights and Forecast 2021-2033
- 5.1. Market Analysis, Insights and Forecast - by Source
- 5.1.1. Organic
- 5.1.2. Conventional
- 5.2. Market Analysis, Insights and Forecast - by Application
- 5.2.1. Food and Beverage
- 5.2.1.1. Bakery Products
- 5.2.1.2. Soups and Sauces
- 5.2.1.3. Snacks and Cereals
- 5.2.1.4. Meat and Meat Products
- 5.2.1.5. Dairy
- 5.2.1.6. Other Food and Beverage Applications
- 5.2.2. Animal Feed and Pet Food
- 5.2.3. Personal Care and Cosmetics
- 5.2.1. Food and Beverage
- 5.3. Market Analysis, Insights and Forecast - by Region
- 5.3.1. North America
- 5.3.2. Europe
- 5.3.3. Asia Pacific
- 5.3.4. South America
- 5.3.5. Middle East and Africa
- 5.1. Market Analysis, Insights and Forecast - by Source
- 6. Global Pea Starch Industry Analysis, Insights and Forecast, 2021-2033
- 6.1. Market Analysis, Insights and Forecast - by Source
- 6.1.1. Organic
- 6.1.2. Conventional
- 6.2. Market Analysis, Insights and Forecast - by Application
- 6.2.1. Food and Beverage
- 6.2.1.1. Bakery Products
- 6.2.1.2. Soups and Sauces
- 6.2.1.3. Snacks and Cereals
- 6.2.1.4. Meat and Meat Products
- 6.2.1.5. Dairy
- 6.2.1.6. Other Food and Beverage Applications
- 6.2.2. Animal Feed and Pet Food
- 6.2.3. Personal Care and Cosmetics
- 6.2.1. Food and Beverage
- 6.1. Market Analysis, Insights and Forecast - by Source
- 7. North America Pea Starch Industry Analysis, Insights and Forecast, 2021-2033
- 7.1. Market Analysis, Insights and Forecast - by Source
- 7.1.1. Organic
- 7.1.2. Conventional
- 7.2. Market Analysis, Insights and Forecast - by Application
- 7.2.1. Food and Beverage
- 7.2.1.1. Bakery Products
- 7.2.1.2. Soups and Sauces
- 7.2.1.3. Snacks and Cereals
- 7.2.1.4. Meat and Meat Products
- 7.2.1.5. Dairy
- 7.2.1.6. Other Food and Beverage Applications
- 7.2.2. Animal Feed and Pet Food
- 7.2.3. Personal Care and Cosmetics
- 7.2.1. Food and Beverage
- 7.1. Market Analysis, Insights and Forecast - by Source
- 8. Europe Pea Starch Industry Analysis, Insights and Forecast, 2021-2033
- 8.1. Market Analysis, Insights and Forecast - by Source
- 8.1.1. Organic
- 8.1.2. Conventional
- 8.2. Market Analysis, Insights and Forecast - by Application
- 8.2.1. Food and Beverage
- 8.2.1.1. Bakery Products
- 8.2.1.2. Soups and Sauces
- 8.2.1.3. Snacks and Cereals
- 8.2.1.4. Meat and Meat Products
- 8.2.1.5. Dairy
- 8.2.1.6. Other Food and Beverage Applications
- 8.2.2. Animal Feed and Pet Food
- 8.2.3. Personal Care and Cosmetics
- 8.2.1. Food and Beverage
- 8.1. Market Analysis, Insights and Forecast - by Source
- 9. Asia Pacific Pea Starch Industry Analysis, Insights and Forecast, 2021-2033
- 9.1. Market Analysis, Insights and Forecast - by Source
- 9.1.1. Organic
- 9.1.2. Conventional
- 9.2. Market Analysis, Insights and Forecast - by Application
- 9.2.1. Food and Beverage
- 9.2.1.1. Bakery Products
- 9.2.1.2. Soups and Sauces
- 9.2.1.3. Snacks and Cereals
- 9.2.1.4. Meat and Meat Products
- 9.2.1.5. Dairy
- 9.2.1.6. Other Food and Beverage Applications
- 9.2.2. Animal Feed and Pet Food
- 9.2.3. Personal Care and Cosmetics
- 9.2.1. Food and Beverage
- 9.1. Market Analysis, Insights and Forecast - by Source
- 10. South America Pea Starch Industry Analysis, Insights and Forecast, 2021-2033
- 10.1. Market Analysis, Insights and Forecast - by Source
- 10.1.1. Organic
- 10.1.2. Conventional
- 10.2. Market Analysis, Insights and Forecast - by Application
- 10.2.1. Food and Beverage
- 10.2.1.1. Bakery Products
- 10.2.1.2. Soups and Sauces
- 10.2.1.3. Snacks and Cereals
- 10.2.1.4. Meat and Meat Products
- 10.2.1.5. Dairy
- 10.2.1.6. Other Food and Beverage Applications
- 10.2.2. Animal Feed and Pet Food
- 10.2.3. Personal Care and Cosmetics
- 10.2.1. Food and Beverage
- 10.1. Market Analysis, Insights and Forecast - by Source
- 11. Middle East and Africa Pea Starch Industry Analysis, Insights and Forecast, 2021-2033
- 11.1. Market Analysis, Insights and Forecast - by Source
- 11.1.1. Organic
- 11.1.2. Conventional
- 11.2. Market Analysis, Insights and Forecast - by Application
- 11.2.1. Food and Beverage
- 11.2.1.1. Bakery Products
- 11.2.1.2. Soups and Sauces
- 11.2.1.3. Snacks and Cereals
- 11.2.1.4. Meat and Meat Products
- 11.2.1.5. Dairy
- 11.2.1.6. Other Food and Beverage Applications
- 11.2.2. Animal Feed and Pet Food
- 11.2.3. Personal Care and Cosmetics
- 11.2.1. Food and Beverage
- 11.1. Market Analysis, Insights and Forecast - by Source
- 12. Competitive Analysis
- 12.1. Company Profiles
- 12.1.1 Vestkorn Milling AS
- 12.1.1.1. Company Overview
- 12.1.1.2. Products
- 12.1.1.3. Company Financials
- 12.1.1.4. SWOT Analysis
- 12.1.2 Groupe Emsland
- 12.1.2.1. Company Overview
- 12.1.2.2. Products
- 12.1.2.3. Company Financials
- 12.1.2.4. SWOT Analysis
- 12.1.3 The Scoular Company
- 12.1.3.1. Company Overview
- 12.1.3.2. Products
- 12.1.3.3. Company Financials
- 12.1.3.4. SWOT Analysis
- 12.1.4 Axiom Foods Inc
- 12.1.4.1. Company Overview
- 12.1.4.2. Products
- 12.1.4.3. Company Financials
- 12.1.4.4. SWOT Analysis
- 12.1.5 Meelunie BV
- 12.1.5.1. Company Overview
- 12.1.5.2. Products
- 12.1.5.3. Company Financials
- 12.1.5.4. SWOT Analysis
- 12.1.6 Ingredion Incorporated
- 12.1.6.1. Company Overview
- 12.1.6.2. Products
- 12.1.6.3. Company Financials
- 12.1.6.4. SWOT Analysis
- 12.1.7 Cosucra- Groupe Warcoing
- 12.1.7.1. Company Overview
- 12.1.7.2. Products
- 12.1.7.3. Company Financials
- 12.1.7.4. SWOT Analysis
- 12.1.8 Roquette Freres
- 12.1.8.1. Company Overview
- 12.1.8.2. Products
- 12.1.8.3. Company Financials
- 12.1.8.4. SWOT Analysis
- 12.1.9 Puris Foods*List Not Exhaustive
- 12.1.9.1. Company Overview
- 12.1.9.2. Products
- 12.1.9.3. Company Financials
- 12.1.9.4. SWOT Analysis
- 12.1.10 Yantai Shuangta Food Co Ltd
- 12.1.10.1. Company Overview
- 12.1.10.2. Products
- 12.1.10.3. Company Financials
- 12.1.10.4. SWOT Analysis
- 12.1.1 Vestkorn Milling AS
- 12.2. Market Entropy
- 12.2.1 Company's Key Areas Served
- 12.2.2 Recent Developments
- 12.3. Company Market Share Analysis 2025
- 12.3.1 Top 5 Companies Market Share Analysis
- 12.3.2 Top 3 Companies Market Share Analysis
- 12.4. List of Potential Customers
- 13. Research Methodology
List of Figures
- Figure 1: Global Pea Starch Industry Revenue Breakdown (million, %) by Region 2025 & 2033
- Figure 2: North America Pea Starch Industry Revenue (million), by Source 2025 & 2033
- Figure 3: North America Pea Starch Industry Revenue Share (%), by Source 2025 & 2033
- Figure 4: North America Pea Starch Industry Revenue (million), by Application 2025 & 2033
- Figure 5: North America Pea Starch Industry Revenue Share (%), by Application 2025 & 2033
- Figure 6: North America Pea Starch Industry Revenue (million), by Country 2025 & 2033
- Figure 7: North America Pea Starch Industry Revenue Share (%), by Country 2025 & 2033
- Figure 8: Europe Pea Starch Industry Revenue (million), by Source 2025 & 2033
- Figure 9: Europe Pea Starch Industry Revenue Share (%), by Source 2025 & 2033
- Figure 10: Europe Pea Starch Industry Revenue (million), by Application 2025 & 2033
- Figure 11: Europe Pea Starch Industry Revenue Share (%), by Application 2025 & 2033
- Figure 12: Europe Pea Starch Industry Revenue (million), by Country 2025 & 2033
- Figure 13: Europe Pea Starch Industry Revenue Share (%), by Country 2025 & 2033
- Figure 14: Asia Pacific Pea Starch Industry Revenue (million), by Source 2025 & 2033
- Figure 15: Asia Pacific Pea Starch Industry Revenue Share (%), by Source 2025 & 2033
- Figure 16: Asia Pacific Pea Starch Industry Revenue (million), by Application 2025 & 2033
- Figure 17: Asia Pacific Pea Starch Industry Revenue Share (%), by Application 2025 & 2033
- Figure 18: Asia Pacific Pea Starch Industry Revenue (million), by Country 2025 & 2033
- Figure 19: Asia Pacific Pea Starch Industry Revenue Share (%), by Country 2025 & 2033
- Figure 20: South America Pea Starch Industry Revenue (million), by Source 2025 & 2033
- Figure 21: South America Pea Starch Industry Revenue Share (%), by Source 2025 & 2033
- Figure 22: South America Pea Starch Industry Revenue (million), by Application 2025 & 2033
- Figure 23: South America Pea Starch Industry Revenue Share (%), by Application 2025 & 2033
- Figure 24: South America Pea Starch Industry Revenue (million), by Country 2025 & 2033
- Figure 25: South America Pea Starch Industry Revenue Share (%), by Country 2025 & 2033
- Figure 26: Middle East and Africa Pea Starch Industry Revenue (million), by Source 2025 & 2033
- Figure 27: Middle East and Africa Pea Starch Industry Revenue Share (%), by Source 2025 & 2033
- Figure 28: Middle East and Africa Pea Starch Industry Revenue (million), by Application 2025 & 2033
- Figure 29: Middle East and Africa Pea Starch Industry Revenue Share (%), by Application 2025 & 2033
- Figure 30: Middle East and Africa Pea Starch Industry Revenue (million), by Country 2025 & 2033
- Figure 31: Middle East and Africa Pea Starch Industry Revenue Share (%), by Country 2025 & 2033
List of Tables
- Table 1: Global Pea Starch Industry Revenue million Forecast, by Source 2020 & 2033
- Table 2: Global Pea Starch Industry Revenue million Forecast, by Application 2020 & 2033
- Table 3: Global Pea Starch Industry Revenue million Forecast, by Region 2020 & 2033
- Table 4: Global Pea Starch Industry Revenue million Forecast, by Source 2020 & 2033
- Table 5: Global Pea Starch Industry Revenue million Forecast, by Application 2020 & 2033
- Table 6: Global Pea Starch Industry Revenue million Forecast, by Country 2020 & 2033
- Table 7: United States Pea Starch Industry Revenue (million) Forecast, by Application 2020 & 2033
- Table 8: Canada Pea Starch Industry Revenue (million) Forecast, by Application 2020 & 2033
- Table 9: Mexico Pea Starch Industry Revenue (million) Forecast, by Application 2020 & 2033
- Table 10: Rest of North America Pea Starch Industry Revenue (million) Forecast, by Application 2020 & 2033
- Table 11: Global Pea Starch Industry Revenue million Forecast, by Source 2020 & 2033
- Table 12: Global Pea Starch Industry Revenue million Forecast, by Application 2020 & 2033
- Table 13: Global Pea Starch Industry Revenue million Forecast, by Country 2020 & 2033
- Table 14: United Kingdom Pea Starch Industry Revenue (million) Forecast, by Application 2020 & 2033
- Table 15: Germany Pea Starch Industry Revenue (million) Forecast, by Application 2020 & 2033
- Table 16: Spain Pea Starch Industry Revenue (million) Forecast, by Application 2020 & 2033
- Table 17: France Pea Starch Industry Revenue (million) Forecast, by Application 2020 & 2033
- Table 18: Italy Pea Starch Industry Revenue (million) Forecast, by Application 2020 & 2033
- Table 19: Russia Pea Starch Industry Revenue (million) Forecast, by Application 2020 & 2033
- Table 20: Rest of Europe Pea Starch Industry Revenue (million) Forecast, by Application 2020 & 2033
- Table 21: Global Pea Starch Industry Revenue million Forecast, by Source 2020 & 2033
- Table 22: Global Pea Starch Industry Revenue million Forecast, by Application 2020 & 2033
- Table 23: Global Pea Starch Industry Revenue million Forecast, by Country 2020 & 2033
- Table 24: China Pea Starch Industry Revenue (million) Forecast, by Application 2020 & 2033
- Table 25: Japan Pea Starch Industry Revenue (million) Forecast, by Application 2020 & 2033
- Table 26: India Pea Starch Industry Revenue (million) Forecast, by Application 2020 & 2033
- Table 27: Australia Pea Starch Industry Revenue (million) Forecast, by Application 2020 & 2033
- Table 28: Rest of Asia Pacific Pea Starch Industry Revenue (million) Forecast, by Application 2020 & 2033
- Table 29: Global Pea Starch Industry Revenue million Forecast, by Source 2020 & 2033
- Table 30: Global Pea Starch Industry Revenue million Forecast, by Application 2020 & 2033
- Table 31: Global Pea Starch Industry Revenue million Forecast, by Country 2020 & 2033
- Table 32: Brazil Pea Starch Industry Revenue (million) Forecast, by Application 2020 & 2033
- Table 33: Argentina Pea Starch Industry Revenue (million) Forecast, by Application 2020 & 2033
- Table 34: Rest of South America Pea Starch Industry Revenue (million) Forecast, by Application 2020 & 2033
- Table 35: Global Pea Starch Industry Revenue million Forecast, by Source 2020 & 2033
- Table 36: Global Pea Starch Industry Revenue million Forecast, by Application 2020 & 2033
- Table 37: Global Pea Starch Industry Revenue million Forecast, by Country 2020 & 2033
- Table 38: Saudi Arabia Pea Starch Industry Revenue (million) Forecast, by Application 2020 & 2033
- Table 39: South Africa Pea Starch Industry Revenue (million) Forecast, by Application 2020 & 2033
- Table 40: Rest of Middle East and Africa Pea Starch Industry Revenue (million) Forecast, by Application 2020 & 2033
Frequently Asked Questions
1. What is the projected Compound Annual Growth Rate (CAGR) of the Pea Starch Industry?
The projected CAGR is approximately 8.33%.
2. Which companies are prominent players in the Pea Starch Industry?
Key companies in the market include Vestkorn Milling AS, Groupe Emsland, The Scoular Company, Axiom Foods Inc, Meelunie BV, Ingredion Incorporated, Cosucra- Groupe Warcoing, Roquette Freres, Puris Foods*List Not Exhaustive, Yantai Shuangta Food Co Ltd.
3. What are the main segments of the Pea Starch Industry?
The market segments include Source, Application.
4. Can you provide details about the market size?
The market size is estimated to be USD 194.32 million as of 2022.
5. What are some drivers contributing to market growth?
Growing Awareness About Insect & Other Alternative Proteins; Increasing Applications Surge Demand for Insect Protein.
6. What are the notable trends driving market growth?
Consumer Preference for Free-from Food is Driving the Pea Starch Demand.
7. Are there any restraints impacting market growth?
Augmenting Market Penetration of Other Proteins.
8. Can you provide examples of recent developments in the market?
In October 2022, Roquette Freres, a plant-based ingredients company, launched a new line of organic pea ingredients, i.e., pea starch and organic pea protein. The products are available in North America, Mexico, and Europe.
9. What pricing options are available for accessing the report?
Pricing options include single-user, multi-user, and enterprise licenses priced at USD 4750, USD 5250, and USD 8750 respectively.
10. Is the market size provided in terms of value or volume?
The market size is provided in terms of value, measured in million.
11. Are there any specific market keywords associated with the report?
Yes, the market keyword associated with the report is "Pea Starch Industry," which aids in identifying and referencing the specific market segment covered.
12. How do I determine which pricing option suits my needs best?
The pricing options vary based on user requirements and access needs. Individual users may opt for single-user licenses, while businesses requiring broader access may choose multi-user or enterprise licenses for cost-effective access to the report.
13. Are there any additional resources or data provided in the Pea Starch Industry report?
While the report offers comprehensive insights, it's advisable to review the specific contents or supplementary materials provided to ascertain if additional resources or data are available.
14. How can I stay updated on further developments or reports in the Pea Starch Industry?
To stay informed about further developments, trends, and reports in the Pea Starch Industry, consider subscribing to industry newsletters, following relevant companies and organizations, or regularly checking reputable industry news sources and publications.
Methodology
Step 1 - Identification of Relevant Samples Size from Population Database


Step 2 - Approaches for Defining Global Market Size (Value, Volume* & Price*)

Note*: In applicable scenarios
Step 3 - Data Sources
Primary Research
- Web Analytics
- Survey Reports
- Research Institute
- Latest Research Reports
- Opinion Leaders
Secondary Research
- Annual Reports
- White Paper
- Latest Press Release
- Industry Association
- Paid Database
- Investor Presentations

Step 4 - Data Triangulation
Involves using different sources of information in order to increase the validity of a study
These sources are likely to be stakeholders in a program - participants, other researchers, program staff, other community members, and so on.
Then we put all data in single framework & apply various statistical tools to find out the dynamic on the market.
During the analysis stage, feedback from the stakeholder groups would be compared to determine areas of agreement as well as areas of divergence