
Key Insights
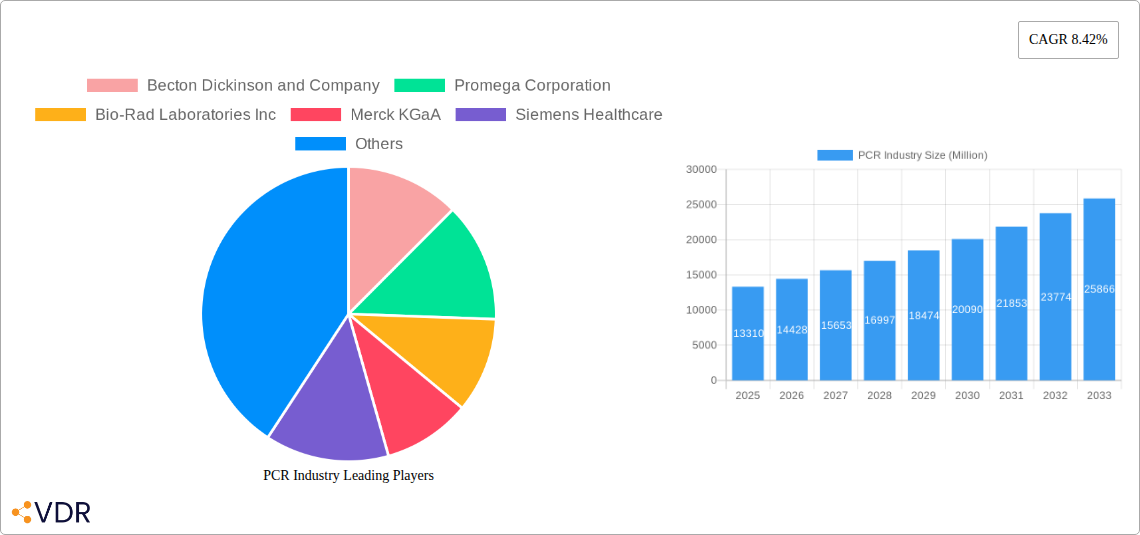
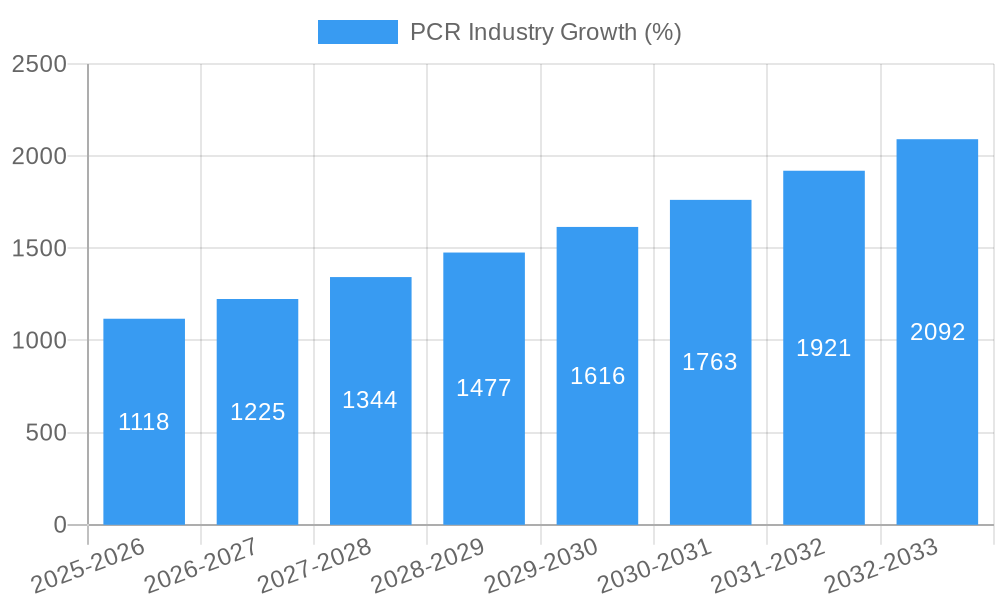
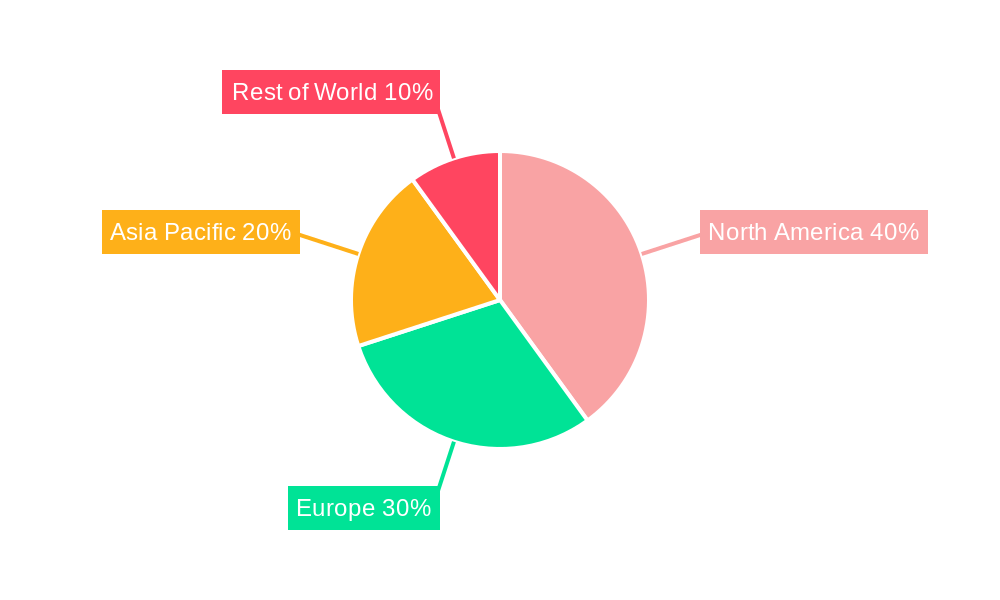
The Polymerase Chain Reaction (PCR) industry, valued at $13.31 billion in 2025, is experiencing robust growth, projected to expand at a compound annual growth rate (CAGR) of 8.42% from 2025 to 2033. This expansion is driven by several key factors. The increasing prevalence of infectious diseases globally necessitates rapid and accurate diagnostic tools, fueling demand for PCR-based testing. Advancements in PCR technology, such as real-time PCR and digital PCR, are enhancing sensitivity, speed, and automation, further boosting market growth. The rising adoption of PCR in life science research for genetic analysis, drug discovery, and personalized medicine is another significant driver. Furthermore, the expanding industrial applications of PCR in food safety testing and environmental monitoring contribute to market expansion. While the initial investment in sophisticated PCR instruments can be high, the overall cost-effectiveness compared to alternative diagnostic methods and the increasing availability of user-friendly systems are mitigating this restraint. The market is segmented by application (clinical diagnostics, life science research, industrial applications), end-user (academic institutes, clinical labs, pharmaceutical companies), and product (instruments, reagents, software). The strong presence of established players like Thermo Fisher Scientific, Bio-Rad, and Roche, coupled with the emergence of innovative companies, ensures a competitive and dynamic market landscape. Geographical distribution reveals significant market shares for North America and Europe, although Asia-Pacific is expected to experience substantial growth due to rising healthcare expenditure and increasing adoption of advanced technologies.
The forecast period (2025-2033) anticipates continued strong growth, driven by factors like the ongoing development of point-of-care PCR devices, expanding applications in oncology and personalized medicine, and government initiatives promoting infectious disease surveillance. However, challenges such as regulatory hurdles in certain regions and the potential impact of technological disruptions from newer diagnostic platforms need to be considered. The competitive landscape is characterized by both established players and emerging companies, leading to innovations and price competition. This dynamic will likely shape the market’s future, with a continued focus on improving the efficiency, affordability, and accessibility of PCR technology across various settings. The market is poised for sustained growth, making it an attractive sector for investment and innovation.
PCR Industry Market Report: 2019-2033
This comprehensive report provides a detailed analysis of the PCR (Polymerase Chain Reaction) industry, encompassing market dynamics, growth trends, regional segmentation, product landscape, key players, and future outlook. The report covers the period from 2019 to 2033, with a focus on the 2025-2033 forecast period. The study includes a detailed examination of the parent market (Diagnostics Market) and child markets (Clinical Diagnostics, Life Science Research, and Industrial Applications). The total market value is expected to reach xx Million units by 2033.
PCR Industry Market Dynamics & Structure
The PCR industry is characterized by a moderately consolidated market structure with several major players holding significant market share. Technological innovation, particularly in real-time PCR systems and next-generation sequencing technologies, is a key driver of market growth. Stringent regulatory frameworks, particularly concerning diagnostic applications, influence product development and market access. Competitive pressures from substitute technologies, such as CRISPR-Cas9 gene editing, are also impacting market dynamics. The end-user demographic is diverse, spanning academic institutions, clinical diagnostics labs, pharmaceutical and biotechnology companies, and industrial users. M&A activity has been moderate, with larger companies acquiring smaller innovative firms to expand their product portfolios and technological capabilities.
- Market Concentration: Moderately consolidated, with top 10 players holding approximately xx% of market share in 2024.
- Technological Innovation: Real-time PCR, multiplex PCR, and digital PCR are driving growth.
- Regulatory Framework: Stringent regulations in clinical diagnostics impact market access.
- Competitive Substitutes: Next-generation sequencing (NGS) and CRISPR-Cas9 pose competitive threats.
- End-User Demographics: Diverse, encompassing research, clinical diagnostics, and industrial applications.
- M&A Activity: Moderate level of acquisitions, focused on technology expansion.
PCR Industry Growth Trends & Insights
The PCR market experienced significant growth between 2019 and 2024, driven by increasing demand for rapid and accurate diagnostics, advancements in research applications, and rising investments in life sciences. The market size is projected to grow at a Compound Annual Growth Rate (CAGR) of xx% from 2025 to 2033. This growth is fueled by technological disruptions, including the development of more sensitive and specific PCR assays, portable PCR devices, and automated systems. Consumer behavior is shifting towards preference for faster turnaround times, higher throughput, and integrated solutions. Market penetration is increasing across diverse applications, driven by improved accessibility and affordability.
Dominant Regions, Countries, or Segments in PCR Industry
North America and Europe currently dominate the PCR market, driven by strong research infrastructure, high healthcare expenditure, and a robust regulatory environment. Within applications, clinical diagnostics holds the largest market share, followed by life science research. Clinical diagnostic labs and hospitals represent the largest end-user segment. The high growth potential lies in emerging markets in Asia-Pacific and Latin America, driven by increasing healthcare investments and rising infectious disease prevalence.
- Key Drivers: Strong research infrastructure (North America & Europe), High healthcare spending, Stringent regulatory frameworks, Growing infectious disease prevalence (Asia-Pacific & Latin America).
- Dominant Segments: Clinical Diagnostics (Application), Clinical Diagnostics Labs and Hospitals (End-User), Instruments & Reagents (Product).
PCR Industry Product Landscape
The PCR industry offers a diverse range of products, including instruments (real-time PCR systems, thermocyclers), reagents and consumables (primers, probes, master mixes), and software for data analysis. Recent innovations include microfluidic PCR devices for point-of-care diagnostics and high-throughput screening systems for large-scale research applications. Unique selling propositions include increased sensitivity, specificity, speed, and ease of use. Technological advancements are focused on improving assay performance, automation, and data integration.
Key Drivers, Barriers & Challenges in PCR Industry
Key Drivers: Technological advancements (e.g., digital PCR, multiplex PCR), rising prevalence of infectious diseases, increasing demand for rapid diagnostics, growing investment in life science research.
Challenges & Restraints: High initial investment costs for instruments, stringent regulatory requirements, potential for cross-contamination, competition from alternative technologies (e.g., NGS), supply chain disruptions impacting reagent availability. The impact of supply chain issues on reagent costs is estimated to be xx% in 2024.
Emerging Opportunities in PCR Industry
Emerging opportunities include the development of personalized medicine applications using PCR, point-of-care diagnostics, and the integration of PCR technology with other analytical platforms. Untapped markets exist in low- and middle-income countries, where access to affordable diagnostics is limited. Evolving consumer preferences are driving demand for rapid and user-friendly PCR tests for home use.
Growth Accelerators in the PCR Industry
Long-term growth is driven by the continued development of innovative PCR technologies, strategic collaborations between instrument manufacturers and reagent suppliers, and market expansion into emerging economies. Technological breakthroughs, like advanced microfluidics and improved data analysis software, are improving efficiency and capabilities.
Key Players Shaping the PCR Industry Market
- Becton Dickinson and Company
- Promega Corporation
- Bio-Rad Laboratories Inc
- Merck KGaA
- Siemens Healthcare
- QuantuMDx Group Ltd
- Thermo Fisher Scientific Inc
- Abbott Laboratories
- Danaher Corporation
- Agilent Technologies Inc
- Eppendorf
- bioMerieux SA
- PerkinElmer Inc
- QIAGEN
Notable Milestones in PCR Industry Sector
- November 2022: Cepheid launched Xpert Xpress MVP, a multiplexed PCR test for BV, vulvovaginal candidiasis, and trichomoniasis. This significantly improved the accuracy and speed of diagnosis for these conditions.
- November 2022: PCR Biosystems launched a new family of qPCR reagent mixes (Clara Probe Mix, Clara Probe 1-Step Mix, and Clara HRM Mix), enhancing the versatility and performance of qPCR assays.
In-Depth PCR Industry Market Outlook
The PCR industry is poised for significant growth over the next decade, driven by technological advancements, increasing healthcare spending, and the growing need for rapid and accurate diagnostic testing. Strategic partnerships, focused research and development, and expansion into new applications will further shape the future of this dynamic market. The potential for point-of-care diagnostics and personalized medicine applications represents significant long-term opportunities.
PCR Industry Segmentation
-
1. Product
-
1.1. Instruments
- 1.1.1. Standard PCR Systems
- 1.1.2. Digital PCR Systems
- 1.1.3. Real-time PCR Systems
- 1.2. Reagents and Consumables
- 1.3. Software
-
1.1. Instruments
-
2. Application
- 2.1. Clinical Diagnostics
- 2.2. Life Science Research and Industrial Applications
- 2.3. Other Applications
-
3. End User
- 3.1. Academic Institutes
- 3.2. Clinical Diagnostics Labs and Hospitals
- 3.3. Pharmaceutical and Biotechnology Industries
- 3.4. Other End Users
PCR Industry Segmentation By Geography
-
1. North America
- 1.1. United States
- 1.2. Canada
- 1.3. Mexico
-
2. Europe
- 2.1. Germany
- 2.2. United Kingdom
- 2.3. France
- 2.4. Italy
- 2.5. Spain
- 2.6. Rest of Europe
-
3. Asia Pacific
- 3.1. China
- 3.2. Japan
- 3.3. India
- 3.4. Australia
- 3.5. South Korea
- 3.6. Rest of Asia Pacific
-
4. Middle East and Africa
- 4.1. GCC
- 4.2. South Africa
- 4.3. Rest of Middle East and Africa
-
5. South America
- 5.1. Brazil
- 5.2. Argentina
- 5.3. Rest of South America
PCR Industry REPORT HIGHLIGHTS
| Aspects | Details |
|---|---|
| Study Period | 2019-2033 |
| Base Year | 2024 |
| Estimated Year | 2025 |
| Forecast Period | 2025-2033 |
| Historical Period | 2019-2024 |
| Growth Rate | CAGR of 8.42% from 2019-2033 |
| Segmentation |
|
Table of Contents
- 1. Introduction
- 1.1. Research Scope
- 1.2. Market Segmentation
- 1.3. Research Methodology
- 1.4. Definitions and Assumptions
- 2. Executive Summary
- 2.1. Introduction
- 3. Market Dynamics
- 3.1. Introduction
- 3.2. Market Drivers
- 3.2.1. Increasing Application in Clinical Diagnostics; Rising Demand for Personalized and Precision Medicines; Technological Advancements and Applications in Drug Development
- 3.3. Market Restrains
- 3.3.1. High Cost of Instruments; Emergence of Alternative Technologies
- 3.4. Market Trends
- 3.4.1. Clinical Diagnostics Segment is Expected to Witness a Significant Growth Over the Forecast Period
- 4. Market Factor Analysis
- 4.1. Porters Five Forces
- 4.2. Supply/Value Chain
- 4.3. PESTEL analysis
- 4.4. Market Entropy
- 4.5. Patent/Trademark Analysis
- 5. Global PCR Industry Analysis, Insights and Forecast, 2019-2031
- 5.1. Market Analysis, Insights and Forecast - by Product
- 5.1.1. Instruments
- 5.1.1.1. Standard PCR Systems
- 5.1.1.2. Digital PCR Systems
- 5.1.1.3. Real-time PCR Systems
- 5.1.2. Reagents and Consumables
- 5.1.3. Software
- 5.1.1. Instruments
- 5.2. Market Analysis, Insights and Forecast - by Application
- 5.2.1. Clinical Diagnostics
- 5.2.2. Life Science Research and Industrial Applications
- 5.2.3. Other Applications
- 5.3. Market Analysis, Insights and Forecast - by End User
- 5.3.1. Academic Institutes
- 5.3.2. Clinical Diagnostics Labs and Hospitals
- 5.3.3. Pharmaceutical and Biotechnology Industries
- 5.3.4. Other End Users
- 5.4. Market Analysis, Insights and Forecast - by Region
- 5.4.1. North America
- 5.4.2. Europe
- 5.4.3. Asia Pacific
- 5.4.4. Middle East and Africa
- 5.4.5. South America
- 5.1. Market Analysis, Insights and Forecast - by Product
- 6. North America PCR Industry Analysis, Insights and Forecast, 2019-2031
- 6.1. Market Analysis, Insights and Forecast - by Product
- 6.1.1. Instruments
- 6.1.1.1. Standard PCR Systems
- 6.1.1.2. Digital PCR Systems
- 6.1.1.3. Real-time PCR Systems
- 6.1.2. Reagents and Consumables
- 6.1.3. Software
- 6.1.1. Instruments
- 6.2. Market Analysis, Insights and Forecast - by Application
- 6.2.1. Clinical Diagnostics
- 6.2.2. Life Science Research and Industrial Applications
- 6.2.3. Other Applications
- 6.3. Market Analysis, Insights and Forecast - by End User
- 6.3.1. Academic Institutes
- 6.3.2. Clinical Diagnostics Labs and Hospitals
- 6.3.3. Pharmaceutical and Biotechnology Industries
- 6.3.4. Other End Users
- 6.1. Market Analysis, Insights and Forecast - by Product
- 7. Europe PCR Industry Analysis, Insights and Forecast, 2019-2031
- 7.1. Market Analysis, Insights and Forecast - by Product
- 7.1.1. Instruments
- 7.1.1.1. Standard PCR Systems
- 7.1.1.2. Digital PCR Systems
- 7.1.1.3. Real-time PCR Systems
- 7.1.2. Reagents and Consumables
- 7.1.3. Software
- 7.1.1. Instruments
- 7.2. Market Analysis, Insights and Forecast - by Application
- 7.2.1. Clinical Diagnostics
- 7.2.2. Life Science Research and Industrial Applications
- 7.2.3. Other Applications
- 7.3. Market Analysis, Insights and Forecast - by End User
- 7.3.1. Academic Institutes
- 7.3.2. Clinical Diagnostics Labs and Hospitals
- 7.3.3. Pharmaceutical and Biotechnology Industries
- 7.3.4. Other End Users
- 7.1. Market Analysis, Insights and Forecast - by Product
- 8. Asia Pacific PCR Industry Analysis, Insights and Forecast, 2019-2031
- 8.1. Market Analysis, Insights and Forecast - by Product
- 8.1.1. Instruments
- 8.1.1.1. Standard PCR Systems
- 8.1.1.2. Digital PCR Systems
- 8.1.1.3. Real-time PCR Systems
- 8.1.2. Reagents and Consumables
- 8.1.3. Software
- 8.1.1. Instruments
- 8.2. Market Analysis, Insights and Forecast - by Application
- 8.2.1. Clinical Diagnostics
- 8.2.2. Life Science Research and Industrial Applications
- 8.2.3. Other Applications
- 8.3. Market Analysis, Insights and Forecast - by End User
- 8.3.1. Academic Institutes
- 8.3.2. Clinical Diagnostics Labs and Hospitals
- 8.3.3. Pharmaceutical and Biotechnology Industries
- 8.3.4. Other End Users
- 8.1. Market Analysis, Insights and Forecast - by Product
- 9. Middle East and Africa PCR Industry Analysis, Insights and Forecast, 2019-2031
- 9.1. Market Analysis, Insights and Forecast - by Product
- 9.1.1. Instruments
- 9.1.1.1. Standard PCR Systems
- 9.1.1.2. Digital PCR Systems
- 9.1.1.3. Real-time PCR Systems
- 9.1.2. Reagents and Consumables
- 9.1.3. Software
- 9.1.1. Instruments
- 9.2. Market Analysis, Insights and Forecast - by Application
- 9.2.1. Clinical Diagnostics
- 9.2.2. Life Science Research and Industrial Applications
- 9.2.3. Other Applications
- 9.3. Market Analysis, Insights and Forecast - by End User
- 9.3.1. Academic Institutes
- 9.3.2. Clinical Diagnostics Labs and Hospitals
- 9.3.3. Pharmaceutical and Biotechnology Industries
- 9.3.4. Other End Users
- 9.1. Market Analysis, Insights and Forecast - by Product
- 10. South America PCR Industry Analysis, Insights and Forecast, 2019-2031
- 10.1. Market Analysis, Insights and Forecast - by Product
- 10.1.1. Instruments
- 10.1.1.1. Standard PCR Systems
- 10.1.1.2. Digital PCR Systems
- 10.1.1.3. Real-time PCR Systems
- 10.1.2. Reagents and Consumables
- 10.1.3. Software
- 10.1.1. Instruments
- 10.2. Market Analysis, Insights and Forecast - by Application
- 10.2.1. Clinical Diagnostics
- 10.2.2. Life Science Research and Industrial Applications
- 10.2.3. Other Applications
- 10.3. Market Analysis, Insights and Forecast - by End User
- 10.3.1. Academic Institutes
- 10.3.2. Clinical Diagnostics Labs and Hospitals
- 10.3.3. Pharmaceutical and Biotechnology Industries
- 10.3.4. Other End Users
- 10.1. Market Analysis, Insights and Forecast - by Product
- 11. North Americ PCR Industry Analysis, Insights and Forecast, 2019-2031
- 11.1. Market Analysis, Insights and Forecast - By Country/Sub-region
- 11.1.1 United States
- 11.1.2 Canada
- 11.1.3 Mexico
- 12. South America PCR Industry Analysis, Insights and Forecast, 2019-2031
- 12.1. Market Analysis, Insights and Forecast - By Country/Sub-region
- 12.1.1 Brazil
- 12.1.2 Mexico
- 12.1.3 Rest of South America
- 13. Europe PCR Industry Analysis, Insights and Forecast, 2019-2031
- 13.1. Market Analysis, Insights and Forecast - By Country/Sub-region
- 13.1.1 Germany
- 13.1.2 United Kingdom
- 13.1.3 France
- 13.1.4 Italy
- 13.1.5 Spain
- 13.1.6 Rest of Europe
- 14. Asia Pacific PCR Industry Analysis, Insights and Forecast, 2019-2031
- 14.1. Market Analysis, Insights and Forecast - By Country/Sub-region
- 14.1.1 China
- 14.1.2 Japan
- 14.1.3 India
- 14.1.4 South Korea
- 14.1.5 Taiwan
- 14.1.6 Australia
- 14.1.7 Rest of Asia-Pacific
- 15. MEA PCR Industry Analysis, Insights and Forecast, 2019-2031
- 15.1. Market Analysis, Insights and Forecast - By Country/Sub-region
- 15.1.1 Middle East
- 15.1.2 Africa
- 16. Competitive Analysis
- 16.1. Global Market Share Analysis 2024
- 16.2. Company Profiles
- 16.2.1 Becton Dickinson and Company
- 16.2.1.1. Overview
- 16.2.1.2. Products
- 16.2.1.3. SWOT Analysis
- 16.2.1.4. Recent Developments
- 16.2.1.5. Financials (Based on Availability)
- 16.2.2 Promega Corporation
- 16.2.2.1. Overview
- 16.2.2.2. Products
- 16.2.2.3. SWOT Analysis
- 16.2.2.4. Recent Developments
- 16.2.2.5. Financials (Based on Availability)
- 16.2.3 Bio-Rad Laboratories Inc
- 16.2.3.1. Overview
- 16.2.3.2. Products
- 16.2.3.3. SWOT Analysis
- 16.2.3.4. Recent Developments
- 16.2.3.5. Financials (Based on Availability)
- 16.2.4 Merck KGaA
- 16.2.4.1. Overview
- 16.2.4.2. Products
- 16.2.4.3. SWOT Analysis
- 16.2.4.4. Recent Developments
- 16.2.4.5. Financials (Based on Availability)
- 16.2.5 Siemens Healthcare
- 16.2.5.1. Overview
- 16.2.5.2. Products
- 16.2.5.3. SWOT Analysis
- 16.2.5.4. Recent Developments
- 16.2.5.5. Financials (Based on Availability)
- 16.2.6 QuantuMDx Group Ltd
- 16.2.6.1. Overview
- 16.2.6.2. Products
- 16.2.6.3. SWOT Analysis
- 16.2.6.4. Recent Developments
- 16.2.6.5. Financials (Based on Availability)
- 16.2.7 Thermo Fisher Scientific Inc
- 16.2.7.1. Overview
- 16.2.7.2. Products
- 16.2.7.3. SWOT Analysis
- 16.2.7.4. Recent Developments
- 16.2.7.5. Financials (Based on Availability)
- 16.2.8 Abbott Laboratories
- 16.2.8.1. Overview
- 16.2.8.2. Products
- 16.2.8.3. SWOT Analysis
- 16.2.8.4. Recent Developments
- 16.2.8.5. Financials (Based on Availability)
- 16.2.9 Danaher Corporation
- 16.2.9.1. Overview
- 16.2.9.2. Products
- 16.2.9.3. SWOT Analysis
- 16.2.9.4. Recent Developments
- 16.2.9.5. Financials (Based on Availability)
- 16.2.10 Agilent Technologies Inc
- 16.2.10.1. Overview
- 16.2.10.2. Products
- 16.2.10.3. SWOT Analysis
- 16.2.10.4. Recent Developments
- 16.2.10.5. Financials (Based on Availability)
- 16.2.11 Eppendorf*List Not Exhaustive
- 16.2.11.1. Overview
- 16.2.11.2. Products
- 16.2.11.3. SWOT Analysis
- 16.2.11.4. Recent Developments
- 16.2.11.5. Financials (Based on Availability)
- 16.2.12 bioMerieux SA
- 16.2.12.1. Overview
- 16.2.12.2. Products
- 16.2.12.3. SWOT Analysis
- 16.2.12.4. Recent Developments
- 16.2.12.5. Financials (Based on Availability)
- 16.2.13 PerkinElmer Inc
- 16.2.13.1. Overview
- 16.2.13.2. Products
- 16.2.13.3. SWOT Analysis
- 16.2.13.4. Recent Developments
- 16.2.13.5. Financials (Based on Availability)
- 16.2.14 QIAGEN
- 16.2.14.1. Overview
- 16.2.14.2. Products
- 16.2.14.3. SWOT Analysis
- 16.2.14.4. Recent Developments
- 16.2.14.5. Financials (Based on Availability)
- 16.2.1 Becton Dickinson and Company
List of Figures
- Figure 1: Global PCR Industry Revenue Breakdown (Million, %) by Region 2024 & 2032
- Figure 2: North Americ PCR Industry Revenue (Million), by Country 2024 & 2032
- Figure 3: North Americ PCR Industry Revenue Share (%), by Country 2024 & 2032
- Figure 4: South America PCR Industry Revenue (Million), by Country 2024 & 2032
- Figure 5: South America PCR Industry Revenue Share (%), by Country 2024 & 2032
- Figure 6: Europe PCR Industry Revenue (Million), by Country 2024 & 2032
- Figure 7: Europe PCR Industry Revenue Share (%), by Country 2024 & 2032
- Figure 8: Asia Pacific PCR Industry Revenue (Million), by Country 2024 & 2032
- Figure 9: Asia Pacific PCR Industry Revenue Share (%), by Country 2024 & 2032
- Figure 10: MEA PCR Industry Revenue (Million), by Country 2024 & 2032
- Figure 11: MEA PCR Industry Revenue Share (%), by Country 2024 & 2032
- Figure 12: North America PCR Industry Revenue (Million), by Product 2024 & 2032
- Figure 13: North America PCR Industry Revenue Share (%), by Product 2024 & 2032
- Figure 14: North America PCR Industry Revenue (Million), by Application 2024 & 2032
- Figure 15: North America PCR Industry Revenue Share (%), by Application 2024 & 2032
- Figure 16: North America PCR Industry Revenue (Million), by End User 2024 & 2032
- Figure 17: North America PCR Industry Revenue Share (%), by End User 2024 & 2032
- Figure 18: North America PCR Industry Revenue (Million), by Country 2024 & 2032
- Figure 19: North America PCR Industry Revenue Share (%), by Country 2024 & 2032
- Figure 20: Europe PCR Industry Revenue (Million), by Product 2024 & 2032
- Figure 21: Europe PCR Industry Revenue Share (%), by Product 2024 & 2032
- Figure 22: Europe PCR Industry Revenue (Million), by Application 2024 & 2032
- Figure 23: Europe PCR Industry Revenue Share (%), by Application 2024 & 2032
- Figure 24: Europe PCR Industry Revenue (Million), by End User 2024 & 2032
- Figure 25: Europe PCR Industry Revenue Share (%), by End User 2024 & 2032
- Figure 26: Europe PCR Industry Revenue (Million), by Country 2024 & 2032
- Figure 27: Europe PCR Industry Revenue Share (%), by Country 2024 & 2032
- Figure 28: Asia Pacific PCR Industry Revenue (Million), by Product 2024 & 2032
- Figure 29: Asia Pacific PCR Industry Revenue Share (%), by Product 2024 & 2032
- Figure 30: Asia Pacific PCR Industry Revenue (Million), by Application 2024 & 2032
- Figure 31: Asia Pacific PCR Industry Revenue Share (%), by Application 2024 & 2032
- Figure 32: Asia Pacific PCR Industry Revenue (Million), by End User 2024 & 2032
- Figure 33: Asia Pacific PCR Industry Revenue Share (%), by End User 2024 & 2032
- Figure 34: Asia Pacific PCR Industry Revenue (Million), by Country 2024 & 2032
- Figure 35: Asia Pacific PCR Industry Revenue Share (%), by Country 2024 & 2032
- Figure 36: Middle East and Africa PCR Industry Revenue (Million), by Product 2024 & 2032
- Figure 37: Middle East and Africa PCR Industry Revenue Share (%), by Product 2024 & 2032
- Figure 38: Middle East and Africa PCR Industry Revenue (Million), by Application 2024 & 2032
- Figure 39: Middle East and Africa PCR Industry Revenue Share (%), by Application 2024 & 2032
- Figure 40: Middle East and Africa PCR Industry Revenue (Million), by End User 2024 & 2032
- Figure 41: Middle East and Africa PCR Industry Revenue Share (%), by End User 2024 & 2032
- Figure 42: Middle East and Africa PCR Industry Revenue (Million), by Country 2024 & 2032
- Figure 43: Middle East and Africa PCR Industry Revenue Share (%), by Country 2024 & 2032
- Figure 44: South America PCR Industry Revenue (Million), by Product 2024 & 2032
- Figure 45: South America PCR Industry Revenue Share (%), by Product 2024 & 2032
- Figure 46: South America PCR Industry Revenue (Million), by Application 2024 & 2032
- Figure 47: South America PCR Industry Revenue Share (%), by Application 2024 & 2032
- Figure 48: South America PCR Industry Revenue (Million), by End User 2024 & 2032
- Figure 49: South America PCR Industry Revenue Share (%), by End User 2024 & 2032
- Figure 50: South America PCR Industry Revenue (Million), by Country 2024 & 2032
- Figure 51: South America PCR Industry Revenue Share (%), by Country 2024 & 2032
List of Tables
- Table 1: Global PCR Industry Revenue Million Forecast, by Region 2019 & 2032
- Table 2: Global PCR Industry Revenue Million Forecast, by Product 2019 & 2032
- Table 3: Global PCR Industry Revenue Million Forecast, by Application 2019 & 2032
- Table 4: Global PCR Industry Revenue Million Forecast, by End User 2019 & 2032
- Table 5: Global PCR Industry Revenue Million Forecast, by Region 2019 & 2032
- Table 6: Global PCR Industry Revenue Million Forecast, by Country 2019 & 2032
- Table 7: United States PCR Industry Revenue (Million) Forecast, by Application 2019 & 2032
- Table 8: Canada PCR Industry Revenue (Million) Forecast, by Application 2019 & 2032
- Table 9: Mexico PCR Industry Revenue (Million) Forecast, by Application 2019 & 2032
- Table 10: Global PCR Industry Revenue Million Forecast, by Country 2019 & 2032
- Table 11: Brazil PCR Industry Revenue (Million) Forecast, by Application 2019 & 2032
- Table 12: Mexico PCR Industry Revenue (Million) Forecast, by Application 2019 & 2032
- Table 13: Rest of South America PCR Industry Revenue (Million) Forecast, by Application 2019 & 2032
- Table 14: Global PCR Industry Revenue Million Forecast, by Country 2019 & 2032
- Table 15: Germany PCR Industry Revenue (Million) Forecast, by Application 2019 & 2032
- Table 16: United Kingdom PCR Industry Revenue (Million) Forecast, by Application 2019 & 2032
- Table 17: France PCR Industry Revenue (Million) Forecast, by Application 2019 & 2032
- Table 18: Italy PCR Industry Revenue (Million) Forecast, by Application 2019 & 2032
- Table 19: Spain PCR Industry Revenue (Million) Forecast, by Application 2019 & 2032
- Table 20: Rest of Europe PCR Industry Revenue (Million) Forecast, by Application 2019 & 2032
- Table 21: Global PCR Industry Revenue Million Forecast, by Country 2019 & 2032
- Table 22: China PCR Industry Revenue (Million) Forecast, by Application 2019 & 2032
- Table 23: Japan PCR Industry Revenue (Million) Forecast, by Application 2019 & 2032
- Table 24: India PCR Industry Revenue (Million) Forecast, by Application 2019 & 2032
- Table 25: South Korea PCR Industry Revenue (Million) Forecast, by Application 2019 & 2032
- Table 26: Taiwan PCR Industry Revenue (Million) Forecast, by Application 2019 & 2032
- Table 27: Australia PCR Industry Revenue (Million) Forecast, by Application 2019 & 2032
- Table 28: Rest of Asia-Pacific PCR Industry Revenue (Million) Forecast, by Application 2019 & 2032
- Table 29: Global PCR Industry Revenue Million Forecast, by Country 2019 & 2032
- Table 30: Middle East PCR Industry Revenue (Million) Forecast, by Application 2019 & 2032
- Table 31: Africa PCR Industry Revenue (Million) Forecast, by Application 2019 & 2032
- Table 32: Global PCR Industry Revenue Million Forecast, by Product 2019 & 2032
- Table 33: Global PCR Industry Revenue Million Forecast, by Application 2019 & 2032
- Table 34: Global PCR Industry Revenue Million Forecast, by End User 2019 & 2032
- Table 35: Global PCR Industry Revenue Million Forecast, by Country 2019 & 2032
- Table 36: United States PCR Industry Revenue (Million) Forecast, by Application 2019 & 2032
- Table 37: Canada PCR Industry Revenue (Million) Forecast, by Application 2019 & 2032
- Table 38: Mexico PCR Industry Revenue (Million) Forecast, by Application 2019 & 2032
- Table 39: Global PCR Industry Revenue Million Forecast, by Product 2019 & 2032
- Table 40: Global PCR Industry Revenue Million Forecast, by Application 2019 & 2032
- Table 41: Global PCR Industry Revenue Million Forecast, by End User 2019 & 2032
- Table 42: Global PCR Industry Revenue Million Forecast, by Country 2019 & 2032
- Table 43: Germany PCR Industry Revenue (Million) Forecast, by Application 2019 & 2032
- Table 44: United Kingdom PCR Industry Revenue (Million) Forecast, by Application 2019 & 2032
- Table 45: France PCR Industry Revenue (Million) Forecast, by Application 2019 & 2032
- Table 46: Italy PCR Industry Revenue (Million) Forecast, by Application 2019 & 2032
- Table 47: Spain PCR Industry Revenue (Million) Forecast, by Application 2019 & 2032
- Table 48: Rest of Europe PCR Industry Revenue (Million) Forecast, by Application 2019 & 2032
- Table 49: Global PCR Industry Revenue Million Forecast, by Product 2019 & 2032
- Table 50: Global PCR Industry Revenue Million Forecast, by Application 2019 & 2032
- Table 51: Global PCR Industry Revenue Million Forecast, by End User 2019 & 2032
- Table 52: Global PCR Industry Revenue Million Forecast, by Country 2019 & 2032
- Table 53: China PCR Industry Revenue (Million) Forecast, by Application 2019 & 2032
- Table 54: Japan PCR Industry Revenue (Million) Forecast, by Application 2019 & 2032
- Table 55: India PCR Industry Revenue (Million) Forecast, by Application 2019 & 2032
- Table 56: Australia PCR Industry Revenue (Million) Forecast, by Application 2019 & 2032
- Table 57: South Korea PCR Industry Revenue (Million) Forecast, by Application 2019 & 2032
- Table 58: Rest of Asia Pacific PCR Industry Revenue (Million) Forecast, by Application 2019 & 2032
- Table 59: Global PCR Industry Revenue Million Forecast, by Product 2019 & 2032
- Table 60: Global PCR Industry Revenue Million Forecast, by Application 2019 & 2032
- Table 61: Global PCR Industry Revenue Million Forecast, by End User 2019 & 2032
- Table 62: Global PCR Industry Revenue Million Forecast, by Country 2019 & 2032
- Table 63: GCC PCR Industry Revenue (Million) Forecast, by Application 2019 & 2032
- Table 64: South Africa PCR Industry Revenue (Million) Forecast, by Application 2019 & 2032
- Table 65: Rest of Middle East and Africa PCR Industry Revenue (Million) Forecast, by Application 2019 & 2032
- Table 66: Global PCR Industry Revenue Million Forecast, by Product 2019 & 2032
- Table 67: Global PCR Industry Revenue Million Forecast, by Application 2019 & 2032
- Table 68: Global PCR Industry Revenue Million Forecast, by End User 2019 & 2032
- Table 69: Global PCR Industry Revenue Million Forecast, by Country 2019 & 2032
- Table 70: Brazil PCR Industry Revenue (Million) Forecast, by Application 2019 & 2032
- Table 71: Argentina PCR Industry Revenue (Million) Forecast, by Application 2019 & 2032
- Table 72: Rest of South America PCR Industry Revenue (Million) Forecast, by Application 2019 & 2032
Frequently Asked Questions
1. What is the projected Compound Annual Growth Rate (CAGR) of the PCR Industry?
The projected CAGR is approximately 8.42%.
2. Which companies are prominent players in the PCR Industry?
Key companies in the market include Becton Dickinson and Company, Promega Corporation, Bio-Rad Laboratories Inc, Merck KGaA, Siemens Healthcare, QuantuMDx Group Ltd, Thermo Fisher Scientific Inc, Abbott Laboratories, Danaher Corporation, Agilent Technologies Inc, Eppendorf*List Not Exhaustive, bioMerieux SA, PerkinElmer Inc, QIAGEN.
3. What are the main segments of the PCR Industry?
The market segments include Product, Application, End User.
4. Can you provide details about the market size?
The market size is estimated to be USD 13.31 Million as of 2022.
5. What are some drivers contributing to market growth?
Increasing Application in Clinical Diagnostics; Rising Demand for Personalized and Precision Medicines; Technological Advancements and Applications in Drug Development.
6. What are the notable trends driving market growth?
Clinical Diagnostics Segment is Expected to Witness a Significant Growth Over the Forecast Period.
7. Are there any restraints impacting market growth?
High Cost of Instruments; Emergence of Alternative Technologies.
8. Can you provide examples of recent developments in the market?
November 2022: Cepheid launched Xpert Xpress MVP, a multiplexed PCR test that detects DNA from organisms associated with three distinct conditions: bacterial vaginosis (BV), vulvovaginal candidiasis, and trichomoniasis, from a single sample, aiding in more accurate diagnosis and antibiotic treatment regimens.
9. What pricing options are available for accessing the report?
Pricing options include single-user, multi-user, and enterprise licenses priced at USD 4750, USD 5250, and USD 8750 respectively.
10. Is the market size provided in terms of value or volume?
The market size is provided in terms of value, measured in Million.
11. Are there any specific market keywords associated with the report?
Yes, the market keyword associated with the report is "PCR Industry," which aids in identifying and referencing the specific market segment covered.
12. How do I determine which pricing option suits my needs best?
The pricing options vary based on user requirements and access needs. Individual users may opt for single-user licenses, while businesses requiring broader access may choose multi-user or enterprise licenses for cost-effective access to the report.
13. Are there any additional resources or data provided in the PCR Industry report?
While the report offers comprehensive insights, it's advisable to review the specific contents or supplementary materials provided to ascertain if additional resources or data are available.
14. How can I stay updated on further developments or reports in the PCR Industry?
To stay informed about further developments, trends, and reports in the PCR Industry, consider subscribing to industry newsletters, following relevant companies and organizations, or regularly checking reputable industry news sources and publications.
Methodology
Step 1 - Identification of Relevant Samples Size from Population Database


Step 2 - Approaches for Defining Global Market Size (Value, Volume* & Price*)

Note*: In applicable scenarios
Step 3 - Data Sources
Primary Research
- Web Analytics
- Survey Reports
- Research Institute
- Latest Research Reports
- Opinion Leaders
Secondary Research
- Annual Reports
- White Paper
- Latest Press Release
- Industry Association
- Paid Database
- Investor Presentations

Step 4 - Data Triangulation
Involves using different sources of information in order to increase the validity of a study
These sources are likely to be stakeholders in a program - participants, other researchers, program staff, other community members, and so on.
Then we put all data in single framework & apply various statistical tools to find out the dynamic on the market.
During the analysis stage, feedback from the stakeholder groups would be compared to determine areas of agreement as well as areas of divergence


