

Key Insights
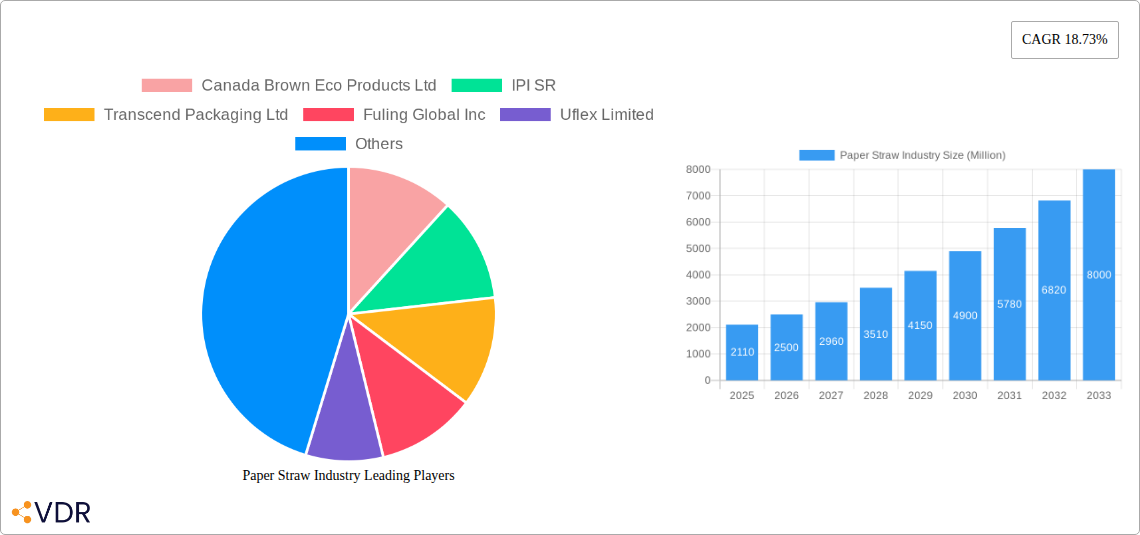
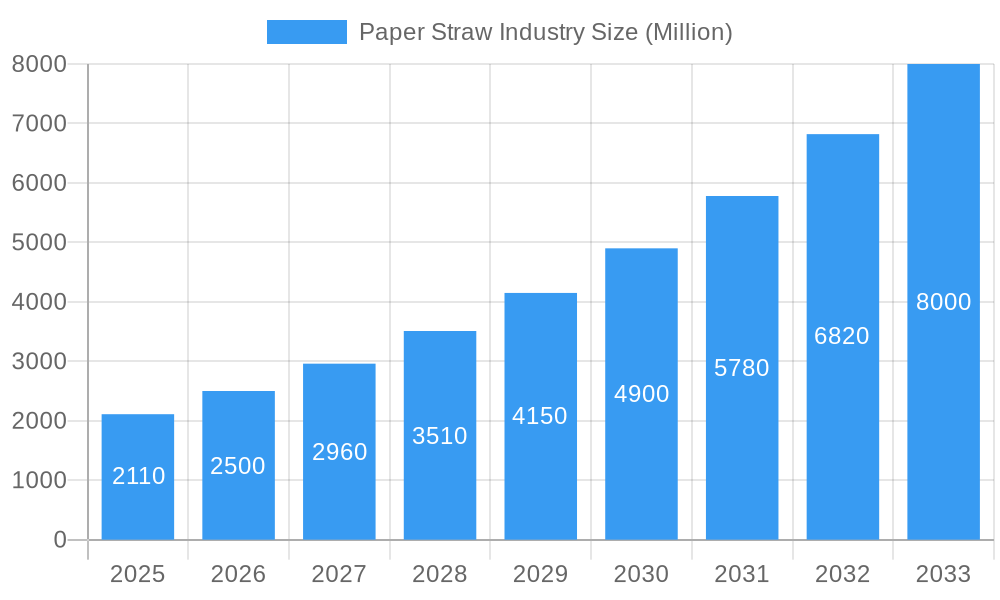
The global paper straw market, valued at $2.11 billion in 2025, is experiencing robust growth, projected to expand at a compound annual growth rate (CAGR) of 18.73% from 2025 to 2033. This surge is primarily driven by the increasing consumer preference for eco-friendly alternatives to plastic straws, fueled by growing environmental awareness and stringent government regulations aimed at reducing plastic waste. The foodservice industry, a major consumer of straws, is significantly contributing to this market expansion, adopting paper straws as a sustainable and readily available solution. Further growth is anticipated from the increasing adoption of paper straws in households and institutional settings, driven by consumer demand for sustainable packaging solutions. The market is segmented by material type (virgin paper and recycled paper) and application (foodservice, households, and institutions). While virgin paper currently dominates, recycled paper straws are gaining traction due to their sustainability credentials and cost-effectiveness. Key players like Canada Brown Eco Products Ltd, IPI SR, and Huhtamaki Oyj are driving innovation and expanding their product portfolios to meet the rising demand. Geographic expansion, particularly in rapidly developing economies of Asia Pacific, is also contributing to overall market growth. However, challenges such as the higher cost of paper straws compared to plastic and concerns about their durability and performance under certain conditions are potential restraints to market expansion.
Paper Straw Industry Market Size (In Billion)
The market's future trajectory is promising, with continued growth expected as sustainability concerns remain at the forefront. Innovation in paper straw technology, focusing on improved durability and functionality, will be crucial in addressing current limitations. Furthermore, the increasing availability of recycled paper straws, combined with efforts to educate consumers about their benefits, will likely further propel market growth. Companies are likely to focus on strategic partnerships, mergers and acquisitions, and product diversification to maintain a competitive edge in this expanding market. Regionally, North America and Europe are currently significant contributors, but the Asia-Pacific region holds substantial growth potential due to its rapidly expanding foodservice sector and growing awareness of environmental issues.
Paper Straw Industry Company Market Share
Paper Straw Industry Market Report: 2019-2033
This comprehensive report provides a detailed analysis of the global paper straw industry, encompassing market dynamics, growth trends, competitive landscape, and future outlook. The study period covers 2019-2033, with a base year of 2025 and a forecast period of 2025-2033. The report segments the market by material type (Virgin Paper, Recycled Paper) and application (Foodservice, Households, Institutions), offering valuable insights for industry professionals, investors, and strategic decision-makers. The market size is estimated at xx Million units in 2025 and is projected to experience significant growth during the forecast period.
Paper Straw Industry Market Dynamics & Structure
The paper straw market is characterized by moderate concentration, with several key players holding significant market share. Technological innovation, driven by the increasing demand for sustainable alternatives to plastic straws, is a major driver. Stringent environmental regulations globally are further propelling market growth. However, competitive pressure from other biodegradable alternatives and fluctuating raw material prices present challenges. The market also sees considerable M&A activity, reflecting consolidation and expansion strategies by major players.
- Market Concentration: Moderately concentrated, with top 10 players holding an estimated xx% market share in 2025.
- Technological Innovation: Focus on improving straw durability, biodegradability, and cost-effectiveness.
- Regulatory Framework: Growing environmental regulations favoring biodegradable materials are key drivers.
- Competitive Substitutes: Bioplastics, bamboo straws, and metal straws pose competitive challenges.
- End-User Demographics: Shifting consumer preferences towards eco-friendly products are a significant growth driver.
- M&A Trends: Increasing consolidation through mergers and acquisitions, especially among medium-sized players. Approximately xx M&A deals were recorded between 2019 and 2024.
Paper Straw Industry Growth Trends & Insights
The global paper straw market has witnessed significant growth over the historical period (2019-2024), driven by rising environmental awareness and increasing demand for sustainable alternatives to plastic straws. This trend is expected to continue throughout the forecast period (2025-2033), with the market experiencing a Compound Annual Growth Rate (CAGR) of xx% during this time. Technological advancements, such as improved coatings to enhance durability and the development of recycled paper straws, are further fueling market expansion. Changing consumer behavior, characterized by a preference for eco-friendly products, is a major contributor to market growth. Market penetration is currently estimated at xx% in key regions and is projected to increase significantly by 2033.
Dominant Regions, Countries, or Segments in Paper Straw Industry
The foodservice segment dominates the paper straw market, accounting for xx% of the total market share in 2025, followed by households and institutions. North America and Europe are currently the leading regions, driven by strong environmental regulations and high consumer awareness. However, Asia-Pacific is expected to witness the fastest growth rate due to rapid economic development and rising disposable incomes.
- By Material Type: Recycled paper straws are gaining traction due to their sustainability credentials, experiencing a faster growth rate than virgin paper straws.
- By Application:
- Foodservice: High volume consumption in restaurants, cafes, and fast-food chains drives this segment.
- Households: Increasing consumer adoption of eco-friendly alternatives at home is fueling growth.
- Institutions: Schools, hospitals, and other institutions are increasingly adopting paper straws due to sustainability initiatives.
- Key Drivers: Stringent environmental regulations, consumer preference for sustainable products, and increasing disposable incomes in developing economies.
Paper Straw Industry Product Landscape
Paper straw innovation centers around enhancing durability, water resistance, and reducing manufacturing costs. The use of innovative coatings and improved paper quality are key developments. Unique selling propositions include eco-friendliness, biodegradability, and compostability. Advancements in production techniques aim to improve efficiency and reduce waste.
Key Drivers, Barriers & Challenges in Paper Straw Industry
Key Drivers:
- Rising consumer awareness of environmental issues and plastic pollution.
- Growing demand for sustainable and biodegradable alternatives to plastic straws.
- Stringent government regulations and policies promoting sustainable packaging.
- Increasing investment in R&D for improving paper straw technology.
Key Challenges:
- Fluctuations in raw material prices (pulp and paper).
- Competition from other biodegradable alternatives.
- Maintaining the structural integrity and durability of paper straws.
- Ensuring efficient and cost-effective manufacturing processes. The cost of production is a major factor influencing profitability.
Emerging Opportunities in Paper Straw Industry
- Expanding into untapped markets in developing economies.
- Development of innovative paper straw designs and functionalities (e.g., customized shapes, colors).
- Exploring collaborations with food and beverage companies for co-branding opportunities.
- Focus on creating fully compostable and biodegradable options.
Growth Accelerators in the Paper Straw Industry
Technological advancements in paper coatings and manufacturing processes are pivotal for enhancing product durability and reducing production costs. Strategic partnerships, such as the one between Transcend Packaging and ITOCHU Corporation, are facilitating market expansion. Government incentives and supportive policies are further accelerating growth, encouraging wider adoption of paper straws.
Key Players Shaping the Paper Straw Industry Market
- Canada Brown Eco Products Ltd
- IPI SR
- Transcend Packaging Ltd
- Fuling Global Inc
- Uflex Limited
- Tembo Paper BV
- Karat Packaging Inc (Lollicup USA Inc)
- Tetra Pak International SA
- Huhtamaki Oyj
- Hoffmaster Group Inc
Notable Milestones in Paper Straw Industry Sector
- April 2023: Transcend Packaging Ltd announced a strategic partnership with ITOCHU Corporation to expand its market presence in Asia and North America.
- February 2023: Tetra Pak International SA initiated research to advance fiber-based sustainable food packaging, focusing on optimizing paper straw composition.
In-Depth Paper Straw Industry Market Outlook
The paper straw market is poised for significant growth over the forecast period, driven by sustained consumer demand for eco-friendly alternatives and ongoing technological advancements. Strategic partnerships, expansion into new markets, and the development of innovative products will be crucial factors driving long-term growth. The increasing focus on sustainability will continue to favor the adoption of paper straws, making it a promising sector for investment and growth.
Paper Straw Industry Segmentation
-
1. Material Type
- 1.1. Virgin Paper
- 1.2. Recycled Paper
-
2. Application
- 2.1. Foodservice
- 2.2. Households
- 2.3. Institutions
Paper Straw Industry Segmentation By Geography
- 1. North America
- 2. Europe
- 3. Asia Pacific
- 4. Latin America
- 5. Middle East and Africa
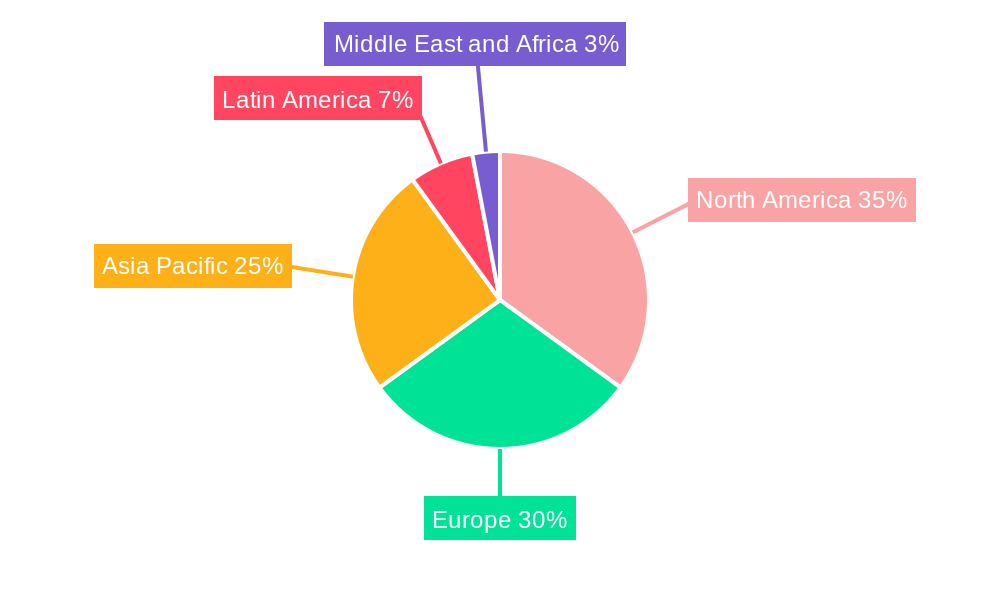
Paper Straw Industry Regional Market Share
Geographic Coverage of Paper Straw Industry
Paper Straw Industry REPORT HIGHLIGHTS
| Aspects | Details |
|---|---|
| Study Period | 2020-2034 |
| Base Year | 2025 |
| Estimated Year | 2026 |
| Forecast Period | 2026-2034 |
| Historical Period | 2020-2025 |
| Growth Rate | CAGR of 18.73% from 2020-2034 |
| Segmentation |
|
Table of Contents
- 1. Introduction
- 1.1. Research Scope
- 1.2. Market Segmentation
- 1.3. Research Objective
- 1.4. Definitions and Assumptions
- 2. Executive Summary
- 2.1. Market Snapshot
- 3. Market Dynamics
- 3.1. Market Drivers
- 3.2. Market Restrains
- 3.3. Market Trends
- 3.4. Market Opportunities
- 4. Market Factor Analysis
- 4.1. Porters Five Forces
- 4.1.1. Bargaining Power of Suppliers
- 4.1.2. Bargaining Power of Buyers
- 4.1.3. Threat of New Entrants
- 4.1.4. Threat of Substitutes
- 4.1.5. Competitive Rivalry
- 4.2. PESTEL analysis
- 4.3. BCG Analysis
- 4.3.1. Stars (High Growth, High Market Share)
- 4.3.2. Cash Cows (Low Growth, High Market Share)
- 4.3.3. Question Mark (High Growth, Low Market Share)
- 4.3.4. Dogs (Low Growth, Low Market Share)
- 4.4. Ansoff Matrix Analysis
- 4.5. Supply Chain Analysis
- 4.6. Regulatory Landscape
- 4.7. Current Market Potential and Opportunity Assessment (TAM–SAM–SOM Framework)
- 4.8. VDR Analyst Note
- 4.1. Porters Five Forces
- 5. Market Analysis, Insights and Forecast 2021-2033
- 5.1. Market Analysis, Insights and Forecast - by Material Type
- 5.1.1. Virgin Paper
- 5.1.2. Recycled Paper
- 5.2. Market Analysis, Insights and Forecast - by Application
- 5.2.1. Foodservice
- 5.2.2. Households
- 5.2.3. Institutions
- 5.3. Market Analysis, Insights and Forecast - by Region
- 5.3.1. North America
- 5.3.2. Europe
- 5.3.3. Asia Pacific
- 5.3.4. Latin America
- 5.3.5. Middle East and Africa
- 5.1. Market Analysis, Insights and Forecast - by Material Type
- 6. Global Paper Straw Industry Analysis, Insights and Forecast, 2021-2033
- 6.1. Market Analysis, Insights and Forecast - by Material Type
- 6.1.1. Virgin Paper
- 6.1.2. Recycled Paper
- 6.2. Market Analysis, Insights and Forecast - by Application
- 6.2.1. Foodservice
- 6.2.2. Households
- 6.2.3. Institutions
- 6.1. Market Analysis, Insights and Forecast - by Material Type
- 7. North America Paper Straw Industry Analysis, Insights and Forecast, 2021-2033
- 7.1. Market Analysis, Insights and Forecast - by Material Type
- 7.1.1. Virgin Paper
- 7.1.2. Recycled Paper
- 7.2. Market Analysis, Insights and Forecast - by Application
- 7.2.1. Foodservice
- 7.2.2. Households
- 7.2.3. Institutions
- 7.1. Market Analysis, Insights and Forecast - by Material Type
- 8. Europe Paper Straw Industry Analysis, Insights and Forecast, 2021-2033
- 8.1. Market Analysis, Insights and Forecast - by Material Type
- 8.1.1. Virgin Paper
- 8.1.2. Recycled Paper
- 8.2. Market Analysis, Insights and Forecast - by Application
- 8.2.1. Foodservice
- 8.2.2. Households
- 8.2.3. Institutions
- 8.1. Market Analysis, Insights and Forecast - by Material Type
- 9. Asia Pacific Paper Straw Industry Analysis, Insights and Forecast, 2021-2033
- 9.1. Market Analysis, Insights and Forecast - by Material Type
- 9.1.1. Virgin Paper
- 9.1.2. Recycled Paper
- 9.2. Market Analysis, Insights and Forecast - by Application
- 9.2.1. Foodservice
- 9.2.2. Households
- 9.2.3. Institutions
- 9.1. Market Analysis, Insights and Forecast - by Material Type
- 10. Latin America Paper Straw Industry Analysis, Insights and Forecast, 2021-2033
- 10.1. Market Analysis, Insights and Forecast - by Material Type
- 10.1.1. Virgin Paper
- 10.1.2. Recycled Paper
- 10.2. Market Analysis, Insights and Forecast - by Application
- 10.2.1. Foodservice
- 10.2.2. Households
- 10.2.3. Institutions
- 10.1. Market Analysis, Insights and Forecast - by Material Type
- 11. Middle East and Africa Paper Straw Industry Analysis, Insights and Forecast, 2021-2033
- 11.1. Market Analysis, Insights and Forecast - by Material Type
- 11.1.1. Virgin Paper
- 11.1.2. Recycled Paper
- 11.2. Market Analysis, Insights and Forecast - by Application
- 11.2.1. Foodservice
- 11.2.2. Households
- 11.2.3. Institutions
- 11.1. Market Analysis, Insights and Forecast - by Material Type
- 12. Competitive Analysis
- 12.1. Company Profiles
- 12.1.1 Canada Brown Eco Products Ltd
- 12.1.1.1. Company Overview
- 12.1.1.2. Products
- 12.1.1.3. Company Financials
- 12.1.1.4. SWOT Analysis
- 12.1.2 IPI SR
- 12.1.2.1. Company Overview
- 12.1.2.2. Products
- 12.1.2.3. Company Financials
- 12.1.2.4. SWOT Analysis
- 12.1.3 Transcend Packaging Ltd
- 12.1.3.1. Company Overview
- 12.1.3.2. Products
- 12.1.3.3. Company Financials
- 12.1.3.4. SWOT Analysis
- 12.1.4 Fuling Global Inc
- 12.1.4.1. Company Overview
- 12.1.4.2. Products
- 12.1.4.3. Company Financials
- 12.1.4.4. SWOT Analysis
- 12.1.5 Uflex Limited
- 12.1.5.1. Company Overview
- 12.1.5.2. Products
- 12.1.5.3. Company Financials
- 12.1.5.4. SWOT Analysis
- 12.1.6 Tembo Paper BV
- 12.1.6.1. Company Overview
- 12.1.6.2. Products
- 12.1.6.3. Company Financials
- 12.1.6.4. SWOT Analysis
- 12.1.7 Karat Packaging Inc (Lollicup USA Inc )
- 12.1.7.1. Company Overview
- 12.1.7.2. Products
- 12.1.7.3. Company Financials
- 12.1.7.4. SWOT Analysis
- 12.1.8 Tetra Pak International SA
- 12.1.8.1. Company Overview
- 12.1.8.2. Products
- 12.1.8.3. Company Financials
- 12.1.8.4. SWOT Analysis
- 12.1.9 Huhtamaki Oyj
- 12.1.9.1. Company Overview
- 12.1.9.2. Products
- 12.1.9.3. Company Financials
- 12.1.9.4. SWOT Analysis
- 12.1.10 Hoffmaster Group Inc
- 12.1.10.1. Company Overview
- 12.1.10.2. Products
- 12.1.10.3. Company Financials
- 12.1.10.4. SWOT Analysis
- 12.1.1 Canada Brown Eco Products Ltd
- 12.2. Market Entropy
- 12.2.1 Company's Key Areas Served
- 12.2.2 Recent Developments
- 12.3. Company Market Share Analysis 2025
- 12.3.1 Top 5 Companies Market Share Analysis
- 12.3.2 Top 3 Companies Market Share Analysis
- 12.4. List of Potential Customers
- 13. Research Methodology
List of Figures
- Figure 1: Global Paper Straw Industry Revenue Breakdown (Million, %) by Region 2025 & 2033
- Figure 2: North America Paper Straw Industry Revenue (Million), by Material Type 2025 & 2033
- Figure 3: North America Paper Straw Industry Revenue Share (%), by Material Type 2025 & 2033
- Figure 4: North America Paper Straw Industry Revenue (Million), by Application 2025 & 2033
- Figure 5: North America Paper Straw Industry Revenue Share (%), by Application 2025 & 2033
- Figure 6: North America Paper Straw Industry Revenue (Million), by Country 2025 & 2033
- Figure 7: North America Paper Straw Industry Revenue Share (%), by Country 2025 & 2033
- Figure 8: Europe Paper Straw Industry Revenue (Million), by Material Type 2025 & 2033
- Figure 9: Europe Paper Straw Industry Revenue Share (%), by Material Type 2025 & 2033
- Figure 10: Europe Paper Straw Industry Revenue (Million), by Application 2025 & 2033
- Figure 11: Europe Paper Straw Industry Revenue Share (%), by Application 2025 & 2033
- Figure 12: Europe Paper Straw Industry Revenue (Million), by Country 2025 & 2033
- Figure 13: Europe Paper Straw Industry Revenue Share (%), by Country 2025 & 2033
- Figure 14: Asia Pacific Paper Straw Industry Revenue (Million), by Material Type 2025 & 2033
- Figure 15: Asia Pacific Paper Straw Industry Revenue Share (%), by Material Type 2025 & 2033
- Figure 16: Asia Pacific Paper Straw Industry Revenue (Million), by Application 2025 & 2033
- Figure 17: Asia Pacific Paper Straw Industry Revenue Share (%), by Application 2025 & 2033
- Figure 18: Asia Pacific Paper Straw Industry Revenue (Million), by Country 2025 & 2033
- Figure 19: Asia Pacific Paper Straw Industry Revenue Share (%), by Country 2025 & 2033
- Figure 20: Latin America Paper Straw Industry Revenue (Million), by Material Type 2025 & 2033
- Figure 21: Latin America Paper Straw Industry Revenue Share (%), by Material Type 2025 & 2033
- Figure 22: Latin America Paper Straw Industry Revenue (Million), by Application 2025 & 2033
- Figure 23: Latin America Paper Straw Industry Revenue Share (%), by Application 2025 & 2033
- Figure 24: Latin America Paper Straw Industry Revenue (Million), by Country 2025 & 2033
- Figure 25: Latin America Paper Straw Industry Revenue Share (%), by Country 2025 & 2033
- Figure 26: Middle East and Africa Paper Straw Industry Revenue (Million), by Material Type 2025 & 2033
- Figure 27: Middle East and Africa Paper Straw Industry Revenue Share (%), by Material Type 2025 & 2033
- Figure 28: Middle East and Africa Paper Straw Industry Revenue (Million), by Application 2025 & 2033
- Figure 29: Middle East and Africa Paper Straw Industry Revenue Share (%), by Application 2025 & 2033
- Figure 30: Middle East and Africa Paper Straw Industry Revenue (Million), by Country 2025 & 2033
- Figure 31: Middle East and Africa Paper Straw Industry Revenue Share (%), by Country 2025 & 2033
List of Tables
- Table 1: Global Paper Straw Industry Revenue Million Forecast, by Material Type 2020 & 2033
- Table 2: Global Paper Straw Industry Revenue Million Forecast, by Application 2020 & 2033
- Table 3: Global Paper Straw Industry Revenue Million Forecast, by Region 2020 & 2033
- Table 4: Global Paper Straw Industry Revenue Million Forecast, by Material Type 2020 & 2033
- Table 5: Global Paper Straw Industry Revenue Million Forecast, by Application 2020 & 2033
- Table 6: Global Paper Straw Industry Revenue Million Forecast, by Country 2020 & 2033
- Table 7: Global Paper Straw Industry Revenue Million Forecast, by Material Type 2020 & 2033
- Table 8: Global Paper Straw Industry Revenue Million Forecast, by Application 2020 & 2033
- Table 9: Global Paper Straw Industry Revenue Million Forecast, by Country 2020 & 2033
- Table 10: Global Paper Straw Industry Revenue Million Forecast, by Material Type 2020 & 2033
- Table 11: Global Paper Straw Industry Revenue Million Forecast, by Application 2020 & 2033
- Table 12: Global Paper Straw Industry Revenue Million Forecast, by Country 2020 & 2033
- Table 13: Global Paper Straw Industry Revenue Million Forecast, by Material Type 2020 & 2033
- Table 14: Global Paper Straw Industry Revenue Million Forecast, by Application 2020 & 2033
- Table 15: Global Paper Straw Industry Revenue Million Forecast, by Country 2020 & 2033
- Table 16: Global Paper Straw Industry Revenue Million Forecast, by Material Type 2020 & 2033
- Table 17: Global Paper Straw Industry Revenue Million Forecast, by Application 2020 & 2033
- Table 18: Global Paper Straw Industry Revenue Million Forecast, by Country 2020 & 2033
Frequently Asked Questions
1. What is the projected Compound Annual Growth Rate (CAGR) of the Paper Straw Industry?
The projected CAGR is approximately 18.73%.
2. Which companies are prominent players in the Paper Straw Industry?
Key companies in the market include Canada Brown Eco Products Ltd, IPI SR, Transcend Packaging Ltd, Fuling Global Inc, Uflex Limited, Tembo Paper BV, Karat Packaging Inc (Lollicup USA Inc ), Tetra Pak International SA, Huhtamaki Oyj, Hoffmaster Group Inc.
3. What are the main segments of the Paper Straw Industry?
The market segments include Material Type, Application.
4. Can you provide details about the market size?
The market size is estimated to be USD 2.11 Million as of 2022.
5. What are some drivers contributing to market growth?
Increasing Consumer Demand for Eco-Friendly Straws; Ban on Single-use Plastic Products Aids the Market Growth.
6. What are the notable trends driving market growth?
The Rise of Environmentally Friendly Straws in Response to Stringent Regulations.
7. Are there any restraints impacting market growth?
Competition from In-house packaging.
8. Can you provide examples of recent developments in the market?
April 2023: Transcend Packaging Ltd announced its strategic partnership with ITOCHU Corporation, a global provider of pulp and paper products. The partnership will help the company expand its footprint in Asia and North America with a variety of products.
9. What pricing options are available for accessing the report?
Pricing options include single-user, multi-user, and enterprise licenses priced at USD 4750, USD 5250, and USD 8750 respectively.
10. Is the market size provided in terms of value or volume?
The market size is provided in terms of value, measured in Million.
11. Are there any specific market keywords associated with the report?
Yes, the market keyword associated with the report is "Paper Straw Industry," which aids in identifying and referencing the specific market segment covered.
12. How do I determine which pricing option suits my needs best?
The pricing options vary based on user requirements and access needs. Individual users may opt for single-user licenses, while businesses requiring broader access may choose multi-user or enterprise licenses for cost-effective access to the report.
13. Are there any additional resources or data provided in the Paper Straw Industry report?
While the report offers comprehensive insights, it's advisable to review the specific contents or supplementary materials provided to ascertain if additional resources or data are available.
14. How can I stay updated on further developments or reports in the Paper Straw Industry?
To stay informed about further developments, trends, and reports in the Paper Straw Industry, consider subscribing to industry newsletters, following relevant companies and organizations, or regularly checking reputable industry news sources and publications.
Methodology
Step 1 - Identification of Relevant Samples Size from Population Database


Step 2 - Approaches for Defining Global Market Size (Value, Volume* & Price*)

Note*: In applicable scenarios
Step 3 - Data Sources
Primary Research
- Web Analytics
- Survey Reports
- Research Institute
- Latest Research Reports
- Opinion Leaders
Secondary Research
- Annual Reports
- White Paper
- Latest Press Release
- Industry Association
- Paid Database
- Investor Presentations

Step 4 - Data Triangulation
Involves using different sources of information in order to increase the validity of a study
These sources are likely to be stakeholders in a program - participants, other researchers, program staff, other community members, and so on.
Then we put all data in single framework & apply various statistical tools to find out the dynamic on the market.
During the analysis stage, feedback from the stakeholder groups would be compared to determine areas of agreement as well as areas of divergence