

Key Insights
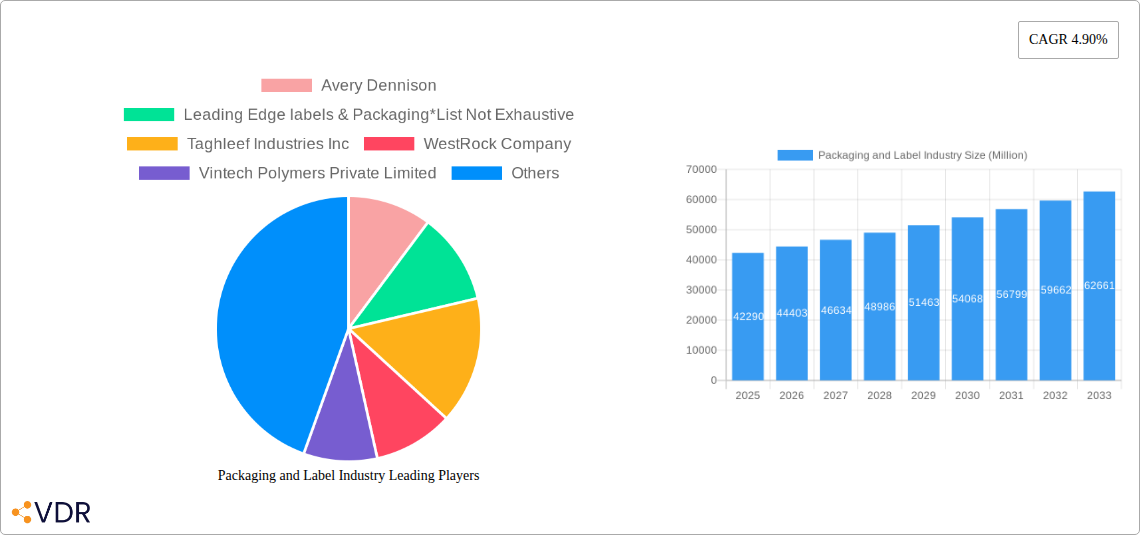
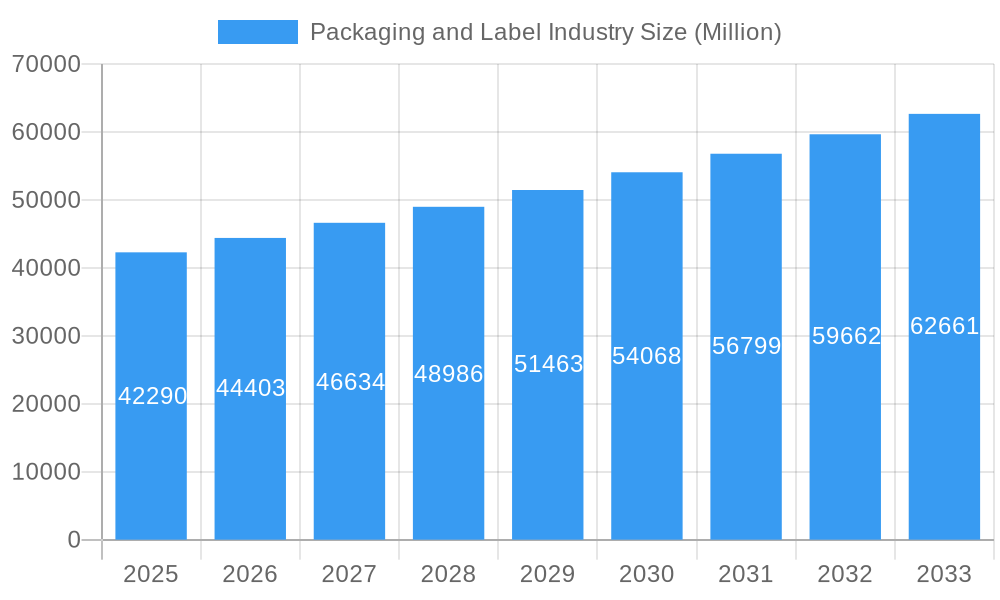
The global packaging and label industry, valued at $42.29 billion in 2025, is projected to experience robust growth, driven by a compound annual growth rate (CAGR) of 4.90% from 2025 to 2033. This expansion is fueled by several key factors. The burgeoning food and beverage sector, along with the pharmaceutical and healthcare industries, are significant drivers of demand for diverse label types, including pressure-sensitive, shrink sleeves, and in-mold labels. The increasing adoption of sophisticated printing technologies like digital printing allows for greater customization and shorter lead times, catering to the rising demand for personalized packaging and efficient supply chains. Furthermore, the growing preference for sustainable packaging materials, such as paper and biodegradable plastics (PLA, PO), is shaping industry trends, encouraging manufacturers to adopt eco-friendly options. Market segmentation reveals a strong reliance on pressure-sensitive labels, with significant usage across various end-user industries. However, regulatory changes concerning material composition and environmental concerns pose potential restraints on growth, prompting manufacturers to continuously innovate and adapt. The competitive landscape is characterized by both large multinational corporations and regional players, leading to intense competition and continuous product development.
Packaging and Label Industry Market Size (In Billion)
Geographic distribution shows a diversified market, with North America and Europe holding significant shares, while the Asia-Pacific region is poised for substantial growth fueled by rapid economic development and increasing consumer spending. The industry's growth trajectory is expected to be influenced by evolving consumer preferences for convenient and informative packaging, necessitating continuous innovation in label design and functionality. The rising demand for tamper-evident seals and security labels is also contributing to market growth. Continued investment in research and development, along with strategic mergers and acquisitions, will shape the future landscape of the packaging and label industry, ensuring its continued expansion in the coming years. The forecast period of 2025-2033 promises substantial growth opportunities for companies that can successfully navigate the evolving market dynamics.
Packaging and Label Industry Company Market Share
Packaging and Label Industry Market Report: 2019-2033
This comprehensive report provides an in-depth analysis of the Packaging and Label Industry, encompassing market dynamics, growth trends, competitive landscape, and future outlook. The study period covers 2019-2033, with a base year of 2025 and a forecast period of 2025-2033. The report segments the market by product type, end-user industry, material, type, and print process, offering granular insights into various sub-markets. Key players like Avery Dennison, CCL Industries LLC, and Mondi are profiled, providing a holistic view of the industry's evolution. The report's value lies in its detailed analysis and projections, enabling informed strategic decision-making for businesses operating within or seeking to enter this dynamic sector. The total market size is projected to reach xx Million units by 2033.
Packaging and Label Industry Market Dynamics & Structure
The global packaging and label industry is characterized by a dynamic landscape driven by evolving consumer preferences, technological advancements, and increasing regulatory scrutiny. While a moderate market concentration exists, featuring influential multinational corporations alongside a vibrant ecosystem of specialized players, the industry is marked by continuous adaptation. Technological innovation remains a pivotal force, with significant strides in digital printing (offering greater personalization and shorter runs), advanced flexography, and novel material science – including the widespread adoption of sustainable materials like PLA, recycled content, and biodegradable options. Automation is also reshaping manufacturing processes, boosting efficiency, reducing waste, and enhancing overall product quality. Increasingly stringent regulatory frameworks, particularly those focused on environmental sustainability, food safety, and product traceability, are compelling material choices and manufacturing methodologies. The industry also faces ongoing challenges from competitive substitute packaging solutions, such as reusable containers and innovative material alternatives, as well as price sensitivity within certain consumer segments. To navigate these dynamics and expand market reach, mergers and acquisitions (M&A) activity remains a significant feature, enabling larger entities to bolster their product portfolios and global footprints.
- Market Concentration: Moderately concentrated, with a few dominant global players alongside a multitude of agile, specialized manufacturers. Recent consolidations are further shaping market share dynamics.
- Technological Innovation: A primary growth catalyst, evidenced by rapid advancements in digital printing, eco-friendly material development, and smart packaging solutions. Automation is transforming operational efficiency.
- Regulatory Framework: Stringent global regulations, especially concerning food safety, product lifecycle management, and environmental impact (e.g., single-use plastic bans), are significantly influencing product development and material sourcing.
- Competitive Substitutes: The rise of reusable packaging models, refillable systems, and alternative materials presents both challenges and opportunities for innovation in disposable and single-use packaging.
- M&A Activity: Active M&A landscape, driven by strategic acquisitions to gain market share, access new technologies, and expand geographical presence. Key deals continue to reshape the competitive structure.
- Innovation Barriers: High capital expenditure for adopting cutting-edge technologies and navigating complex regulatory environments are notable barriers, particularly for smaller and medium-sized enterprises (SMEs).
Packaging and Label Industry Growth Trends & Insights
The packaging and label market demonstrates consistent growth, driven by increasing consumer demand, expanding e-commerce, and evolving product packaging requirements. The historical period (2019-2024) witnessed a CAGR of xx%, with the forecast period (2025-2033) projecting a CAGR of xx%. This growth is fueled by several factors. The rise of e-commerce necessitates robust and protective packaging, boosting demand for labels and specialized packaging solutions. Growing awareness of sustainability is pushing manufacturers towards eco-friendly materials, creating new opportunities for biodegradable and recycled packaging options. Technological advancements, such as smart labels and augmented reality (AR) integration, are transforming the packaging experience, adding value and enhancing consumer engagement. Shifting consumer preferences toward convenience and premiumization influence the design and functionality of packaging and labels. The market penetration of sustainable packaging is expected to reach xx% by 2033.
Dominant Regions, Countries, or Segments in Packaging and Label Industry
North America and Europe currently command significant market share in the Packaging and Label Industry, underpinned by well-established manufacturing infrastructure, mature consumer markets, and progressive regulatory landscapes that champion sustainable and high-quality packaging solutions. However, the Asia-Pacific region is emerging as the fastest-growing market, propelled by burgeoning industrialization, rising disposable incomes, and the explosive growth of the e-commerce sector, which demands efficient and cost-effective packaging. The Food & Beverage industry remains the preeminent end-user segment globally, consistently driving the largest portion of demand due to the fundamental necessity of product protection and shelf appeal. Within the product category, pressure-sensitive labels continue to hold a dominant position owing to their inherent versatility, ease of application, and suitability for a wide array of packaging types. Other segments like shrink sleeves and in-mold labels are experiencing notable growth due to their aesthetic and functional advantages in specific applications.
- Dominant Regions: North America and Europe continue to lead, while Asia-Pacific exhibits the most robust growth trajectory, driven by economic expansion and increasing consumer demand.
- Key Country Markets: The United States, China, Germany, Japan, and emerging economies in Southeast Asia are pivotal markets with substantial consumption and production capabilities.
- Dominant Segment (by product type): Pressure-sensitive labels remain the market leader, with significant growth also seen in specialized labels such as shrink sleeves and in-mold labels.
- Dominant Segment (by end-user): The Food & Beverage sector is the largest consumer of packaging and labels, followed by healthcare, personal care, and industrial goods.
- Growth Drivers (regional): Economic development, urbanization, and the expansion of the e-commerce ecosystem are key catalysts for growth, especially in emerging markets.
- Growth Drivers (segmental): Demand for sustainable packaging, premiumization, enhanced functionality (e.g., tamper-evidence, traceability), and convenience are shaping segment-specific growth.
Packaging and Label Industry Product Landscape
The Packaging and Label Industry presents a remarkably diverse and innovative product landscape, with continuous evolution across material science, printing technologies, and functional enhancements. While pressure-sensitive labels maintain their market dominance due to their broad applicability, there's a discernible surge in demand for specialized label types, including advanced shrink sleeves and high-performance in-mold labels, particularly within the dynamic food & beverage and burgeoning healthcare sectors. Recent advancements are heavily focused on sustainability, with a growing emphasis on bioplastics, post-consumer recycled (PCR) content, and compostable materials. Simultaneously, the integration of "intelligent packaging" features, such as RFID tags for enhanced supply chain visibility, NFC capabilities for consumer engagement, and temperature indicators for product integrity, is gaining traction. Furthermore, printing capabilities are pushing boundaries with the advent of ultra-high-resolution graphics, personalized variable data printing (VDP), and sophisticated security features, all aimed at elevating product protection, significantly enhancing brand communication, meeting intricate industry-specific demands, and driving superior product differentiation and overall market value.
Key Drivers, Barriers & Challenges in Packaging and Label Industry
Key Drivers:
- Increasing consumer demand for packaged goods.
- The growth of e-commerce and its need for effective packaging solutions.
- The trend towards sustainable and eco-friendly packaging.
- Technological advancements in printing and materials science.
Key Challenges and Restraints:
- Fluctuations in raw material prices. (e.g., a 15% increase in PET prices in 2022 led to a xx% increase in label prices.)
- Stringent environmental regulations requiring manufacturers to adopt sustainable practices, which can increase costs.
- Intense competition among manufacturers.
Emerging Opportunities in Packaging and Label Industry
Emerging opportunities lie in the growing demand for sustainable packaging, intelligent packaging incorporating technology like RFID and sensors, and the rise of personalized and customized labels. Untapped markets in developing economies offer significant potential, while innovation in materials science (e.g., edible films) and printing technology (e.g., 3D printing) opens new avenues for product differentiation and market expansion.
Growth Accelerators in the Packaging and Label Industry Industry
Technological breakthroughs in digital printing and sustainable materials are driving long-term growth. Strategic partnerships between packaging manufacturers and brand owners facilitate innovation and market penetration. Expansion into emerging markets, particularly in Asia-Pacific and Africa, presents significant opportunities. The focus on improving supply chain efficiency and enhancing customer experience further accelerates market expansion.
Key Players Shaping the Packaging and Label Industry Market
- Avery Dennison Corporation
- Amcor Plc
- Berry Global Group, Inc.
- CCL Industries Inc.
- Constantia Flexibles Group GmbH
- Eson Pac AB
- Fort Dearborn Company
- Huhtamaki Group
- Klockner Pentaplast Group
- Lintec Corporation
- Multi-Color Corporation
- Mondi Group
- Nestlé S.A. (as a major consumer and influencer)
- Smurfit Kappa Group
- Sonoco Products Company
- Taghleef Industries Inc.
- The Dow Chemical Company (as a material supplier)
- UPM Raflatac
- WestRock Company
Notable Milestones in Packaging and Label Industry Sector
- April 2023: Amcor Plc announces a strategic partnership with recycling innovators to boost the use of recycled content in flexible packaging.
- November 2022: Mondi Group expands its sustainable packaging portfolio with the launch of innovative digital print solutions for e-commerce.
- July 2022: Berry Global Group acquires a leading manufacturer of sustainable rigid packaging solutions, enhancing its eco-friendly offerings.
- March 2021: Fort Dearborn Company completes the acquisition of Hammer Packaging Corporation, significantly expanding its footprint in the North American market and diversifying its product capabilities.
- February 2021: Mondi Group introduces a groundbreaking range of release liners made entirely from recycled materials, underscoring its commitment to a circular economy.
In-Depth Packaging and Label Industry Market Outlook
The packaging and label industry is poised for continued growth, driven by technological advancements, sustainable material adoption, and expanding global markets. Strategic partnerships, investments in R&D, and a focus on delivering innovative and sustainable solutions will be crucial for long-term success. The industry's future hinges on its ability to meet evolving consumer demands for convenience, sustainability, and brand experiences. The projected growth trajectory indicates significant potential for players who can effectively adapt to these changing dynamics.
Packaging and Label Industry Segmentation
-
1. Type
-
1.1. Pressure-Sensitive Label
-
1.1.1. By Print Process
- 1.1.1.1. Offset Printing
- 1.1.1.2. Flexography Printing
- 1.1.1.3. Gravure
- 1.1.1.4. Other Analog Printing Process
- 1.1.1.5. Digital Printing
-
1.1.2. By Product Type
- 1.1.2.1. Liner
- 1.1.2.2. Linerless
- 1.1.2.3. VIP
- 1.1.2.4. Prime
- 1.1.2.5. Functional & Security
- 1.1.2.6. Promotional
-
1.1.3. End-User Industry
- 1.1.3.1. Food & Beverages
- 1.1.3.2. Pharmaceutical & Healthcare
- 1.1.3.3. Other End-Users
-
1.1.1. By Print Process
-
1.2. Shrink & Stretch Sleeve Label
- 1.2.1. Shrink Sleeve
-
1.2.2. By Material
- 1.2.2.1. PVC
- 1.2.2.2. PET
- 1.2.2.3. OPP & OPS
- 1.2.2.4. Other Materials (PO, PLA, etc.)
- 1.3. In-Mold Label
- 1.4. Wet Glue Label
-
1.5. Thermal Transfer Label
- 1.5.1. Paper
- 1.5.2. Polyester
- 1.6. Wrap Around Label
-
1.1. Pressure-Sensitive Label
Packaging and Label Industry Segmentation By Geography
- 1. North America
- 2. Europe
- 3. Asia Pacific
- 4. Middle East
- 5. Latin America
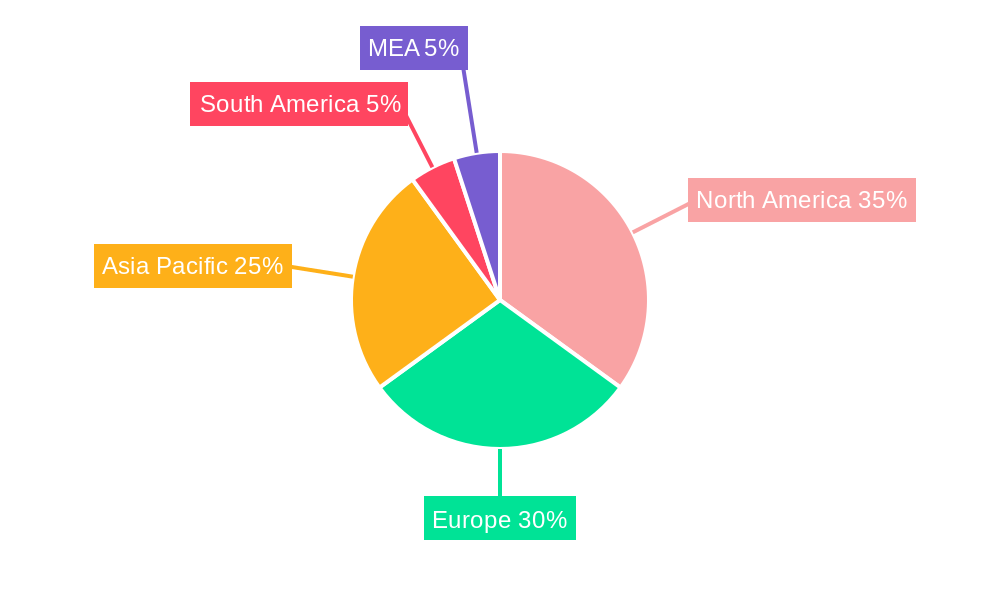
Packaging and Label Industry Regional Market Share
Geographic Coverage of Packaging and Label Industry
Packaging and Label Industry REPORT HIGHLIGHTS
| Aspects | Details |
|---|---|
| Study Period | 2020-2034 |
| Base Year | 2025 |
| Estimated Year | 2026 |
| Forecast Period | 2026-2034 |
| Historical Period | 2020-2025 |
| Growth Rate | CAGR of 4.90% from 2020-2034 |
| Segmentation |
|
Table of Contents
- 1. Introduction
- 1.1. Research Scope
- 1.2. Market Segmentation
- 1.3. Research Objective
- 1.4. Definitions and Assumptions
- 2. Executive Summary
- 2.1. Market Snapshot
- 3. Market Dynamics
- 3.1. Market Drivers
- 3.2. Market Restrains
- 3.3. Market Trends
- 3.4. Market Opportunities
- 4. Market Factor Analysis
- 4.1. Porters Five Forces
- 4.1.1. Bargaining Power of Suppliers
- 4.1.2. Bargaining Power of Buyers
- 4.1.3. Threat of New Entrants
- 4.1.4. Threat of Substitutes
- 4.1.5. Competitive Rivalry
- 4.2. PESTEL analysis
- 4.3. BCG Analysis
- 4.3.1. Stars (High Growth, High Market Share)
- 4.3.2. Cash Cows (Low Growth, High Market Share)
- 4.3.3. Question Mark (High Growth, Low Market Share)
- 4.3.4. Dogs (Low Growth, Low Market Share)
- 4.4. Ansoff Matrix Analysis
- 4.5. Supply Chain Analysis
- 4.6. Regulatory Landscape
- 4.7. Current Market Potential and Opportunity Assessment (TAM–SAM–SOM Framework)
- 4.8. VDR Analyst Note
- 4.1. Porters Five Forces
- 5. Market Analysis, Insights and Forecast 2021-2033
- 5.1. Market Analysis, Insights and Forecast - by Type
- 5.1.1. Pressure-Sensitive Label
- 5.1.1.1. By Print Process
- 5.1.1.1.1. Offset Printing
- 5.1.1.1.2. Flexography Printing
- 5.1.1.1.3. Gravure
- 5.1.1.1.4. Other Analog Printing Process
- 5.1.1.1.5. Digital Printing
- 5.1.1.2. By Product Type
- 5.1.1.2.1. Liner
- 5.1.1.2.2. Linerless
- 5.1.1.2.3. VIP
- 5.1.1.2.4. Prime
- 5.1.1.2.5. Functional & Security
- 5.1.1.2.6. Promotional
- 5.1.1.3. End-User Industry
- 5.1.1.3.1. Food & Beverages
- 5.1.1.3.2. Pharmaceutical & Healthcare
- 5.1.1.3.3. Other End-Users
- 5.1.1.1. By Print Process
- 5.1.2. Shrink & Stretch Sleeve Label
- 5.1.2.1. Shrink Sleeve
- 5.1.2.2. By Material
- 5.1.2.2.1. PVC
- 5.1.2.2.2. PET
- 5.1.2.2.3. OPP & OPS
- 5.1.2.2.4. Other Materials (PO, PLA, etc.)
- 5.1.3. In-Mold Label
- 5.1.4. Wet Glue Label
- 5.1.5. Thermal Transfer Label
- 5.1.5.1. Paper
- 5.1.5.2. Polyester
- 5.1.6. Wrap Around Label
- 5.1.1. Pressure-Sensitive Label
- 5.2. Market Analysis, Insights and Forecast - by Region
- 5.2.1. North America
- 5.2.2. Europe
- 5.2.3. Asia Pacific
- 5.2.4. Middle East
- 5.2.5. Latin America
- 5.1. Market Analysis, Insights and Forecast - by Type
- 6. Global Packaging and Label Industry Analysis, Insights and Forecast, 2021-2033
- 6.1. Market Analysis, Insights and Forecast - by Type
- 6.1.1. Pressure-Sensitive Label
- 6.1.1.1. By Print Process
- 6.1.1.1.1. Offset Printing
- 6.1.1.1.2. Flexography Printing
- 6.1.1.1.3. Gravure
- 6.1.1.1.4. Other Analog Printing Process
- 6.1.1.1.5. Digital Printing
- 6.1.1.2. By Product Type
- 6.1.1.2.1. Liner
- 6.1.1.2.2. Linerless
- 6.1.1.2.3. VIP
- 6.1.1.2.4. Prime
- 6.1.1.2.5. Functional & Security
- 6.1.1.2.6. Promotional
- 6.1.1.3. End-User Industry
- 6.1.1.3.1. Food & Beverages
- 6.1.1.3.2. Pharmaceutical & Healthcare
- 6.1.1.3.3. Other End-Users
- 6.1.1.1. By Print Process
- 6.1.2. Shrink & Stretch Sleeve Label
- 6.1.2.1. Shrink Sleeve
- 6.1.2.2. By Material
- 6.1.2.2.1. PVC
- 6.1.2.2.2. PET
- 6.1.2.2.3. OPP & OPS
- 6.1.2.2.4. Other Materials (PO, PLA, etc.)
- 6.1.3. In-Mold Label
- 6.1.4. Wet Glue Label
- 6.1.5. Thermal Transfer Label
- 6.1.5.1. Paper
- 6.1.5.2. Polyester
- 6.1.6. Wrap Around Label
- 6.1.1. Pressure-Sensitive Label
- 6.1. Market Analysis, Insights and Forecast - by Type
- 7. North America Packaging and Label Industry Analysis, Insights and Forecast, 2021-2033
- 7.1. Market Analysis, Insights and Forecast - by Type
- 7.1.1. Pressure-Sensitive Label
- 7.1.1.1. By Print Process
- 7.1.1.1.1. Offset Printing
- 7.1.1.1.2. Flexography Printing
- 7.1.1.1.3. Gravure
- 7.1.1.1.4. Other Analog Printing Process
- 7.1.1.1.5. Digital Printing
- 7.1.1.2. By Product Type
- 7.1.1.2.1. Liner
- 7.1.1.2.2. Linerless
- 7.1.1.2.3. VIP
- 7.1.1.2.4. Prime
- 7.1.1.2.5. Functional & Security
- 7.1.1.2.6. Promotional
- 7.1.1.3. End-User Industry
- 7.1.1.3.1. Food & Beverages
- 7.1.1.3.2. Pharmaceutical & Healthcare
- 7.1.1.3.3. Other End-Users
- 7.1.1.1. By Print Process
- 7.1.2. Shrink & Stretch Sleeve Label
- 7.1.2.1. Shrink Sleeve
- 7.1.2.2. By Material
- 7.1.2.2.1. PVC
- 7.1.2.2.2. PET
- 7.1.2.2.3. OPP & OPS
- 7.1.2.2.4. Other Materials (PO, PLA, etc.)
- 7.1.3. In-Mold Label
- 7.1.4. Wet Glue Label
- 7.1.5. Thermal Transfer Label
- 7.1.5.1. Paper
- 7.1.5.2. Polyester
- 7.1.6. Wrap Around Label
- 7.1.1. Pressure-Sensitive Label
- 7.1. Market Analysis, Insights and Forecast - by Type
- 8. Europe Packaging and Label Industry Analysis, Insights and Forecast, 2021-2033
- 8.1. Market Analysis, Insights and Forecast - by Type
- 8.1.1. Pressure-Sensitive Label
- 8.1.1.1. By Print Process
- 8.1.1.1.1. Offset Printing
- 8.1.1.1.2. Flexography Printing
- 8.1.1.1.3. Gravure
- 8.1.1.1.4. Other Analog Printing Process
- 8.1.1.1.5. Digital Printing
- 8.1.1.2. By Product Type
- 8.1.1.2.1. Liner
- 8.1.1.2.2. Linerless
- 8.1.1.2.3. VIP
- 8.1.1.2.4. Prime
- 8.1.1.2.5. Functional & Security
- 8.1.1.2.6. Promotional
- 8.1.1.3. End-User Industry
- 8.1.1.3.1. Food & Beverages
- 8.1.1.3.2. Pharmaceutical & Healthcare
- 8.1.1.3.3. Other End-Users
- 8.1.1.1. By Print Process
- 8.1.2. Shrink & Stretch Sleeve Label
- 8.1.2.1. Shrink Sleeve
- 8.1.2.2. By Material
- 8.1.2.2.1. PVC
- 8.1.2.2.2. PET
- 8.1.2.2.3. OPP & OPS
- 8.1.2.2.4. Other Materials (PO, PLA, etc.)
- 8.1.3. In-Mold Label
- 8.1.4. Wet Glue Label
- 8.1.5. Thermal Transfer Label
- 8.1.5.1. Paper
- 8.1.5.2. Polyester
- 8.1.6. Wrap Around Label
- 8.1.1. Pressure-Sensitive Label
- 8.1. Market Analysis, Insights and Forecast - by Type
- 9. Asia Pacific Packaging and Label Industry Analysis, Insights and Forecast, 2021-2033
- 9.1. Market Analysis, Insights and Forecast - by Type
- 9.1.1. Pressure-Sensitive Label
- 9.1.1.1. By Print Process
- 9.1.1.1.1. Offset Printing
- 9.1.1.1.2. Flexography Printing
- 9.1.1.1.3. Gravure
- 9.1.1.1.4. Other Analog Printing Process
- 9.1.1.1.5. Digital Printing
- 9.1.1.2. By Product Type
- 9.1.1.2.1. Liner
- 9.1.1.2.2. Linerless
- 9.1.1.2.3. VIP
- 9.1.1.2.4. Prime
- 9.1.1.2.5. Functional & Security
- 9.1.1.2.6. Promotional
- 9.1.1.3. End-User Industry
- 9.1.1.3.1. Food & Beverages
- 9.1.1.3.2. Pharmaceutical & Healthcare
- 9.1.1.3.3. Other End-Users
- 9.1.1.1. By Print Process
- 9.1.2. Shrink & Stretch Sleeve Label
- 9.1.2.1. Shrink Sleeve
- 9.1.2.2. By Material
- 9.1.2.2.1. PVC
- 9.1.2.2.2. PET
- 9.1.2.2.3. OPP & OPS
- 9.1.2.2.4. Other Materials (PO, PLA, etc.)
- 9.1.3. In-Mold Label
- 9.1.4. Wet Glue Label
- 9.1.5. Thermal Transfer Label
- 9.1.5.1. Paper
- 9.1.5.2. Polyester
- 9.1.6. Wrap Around Label
- 9.1.1. Pressure-Sensitive Label
- 9.1. Market Analysis, Insights and Forecast - by Type
- 10. Middle East Packaging and Label Industry Analysis, Insights and Forecast, 2021-2033
- 10.1. Market Analysis, Insights and Forecast - by Type
- 10.1.1. Pressure-Sensitive Label
- 10.1.1.1. By Print Process
- 10.1.1.1.1. Offset Printing
- 10.1.1.1.2. Flexography Printing
- 10.1.1.1.3. Gravure
- 10.1.1.1.4. Other Analog Printing Process
- 10.1.1.1.5. Digital Printing
- 10.1.1.2. By Product Type
- 10.1.1.2.1. Liner
- 10.1.1.2.2. Linerless
- 10.1.1.2.3. VIP
- 10.1.1.2.4. Prime
- 10.1.1.2.5. Functional & Security
- 10.1.1.2.6. Promotional
- 10.1.1.3. End-User Industry
- 10.1.1.3.1. Food & Beverages
- 10.1.1.3.2. Pharmaceutical & Healthcare
- 10.1.1.3.3. Other End-Users
- 10.1.1.1. By Print Process
- 10.1.2. Shrink & Stretch Sleeve Label
- 10.1.2.1. Shrink Sleeve
- 10.1.2.2. By Material
- 10.1.2.2.1. PVC
- 10.1.2.2.2. PET
- 10.1.2.2.3. OPP & OPS
- 10.1.2.2.4. Other Materials (PO, PLA, etc.)
- 10.1.3. In-Mold Label
- 10.1.4. Wet Glue Label
- 10.1.5. Thermal Transfer Label
- 10.1.5.1. Paper
- 10.1.5.2. Polyester
- 10.1.6. Wrap Around Label
- 10.1.1. Pressure-Sensitive Label
- 10.1. Market Analysis, Insights and Forecast - by Type
- 11. Latin America Packaging and Label Industry Analysis, Insights and Forecast, 2021-2033
- 11.1. Market Analysis, Insights and Forecast - by Type
- 11.1.1. Pressure-Sensitive Label
- 11.1.1.1. By Print Process
- 11.1.1.1.1. Offset Printing
- 11.1.1.1.2. Flexography Printing
- 11.1.1.1.3. Gravure
- 11.1.1.1.4. Other Analog Printing Process
- 11.1.1.1.5. Digital Printing
- 11.1.1.2. By Product Type
- 11.1.1.2.1. Liner
- 11.1.1.2.2. Linerless
- 11.1.1.2.3. VIP
- 11.1.1.2.4. Prime
- 11.1.1.2.5. Functional & Security
- 11.1.1.2.6. Promotional
- 11.1.1.3. End-User Industry
- 11.1.1.3.1. Food & Beverages
- 11.1.1.3.2. Pharmaceutical & Healthcare
- 11.1.1.3.3. Other End-Users
- 11.1.1.1. By Print Process
- 11.1.2. Shrink & Stretch Sleeve Label
- 11.1.2.1. Shrink Sleeve
- 11.1.2.2. By Material
- 11.1.2.2.1. PVC
- 11.1.2.2.2. PET
- 11.1.2.2.3. OPP & OPS
- 11.1.2.2.4. Other Materials (PO, PLA, etc.)
- 11.1.3. In-Mold Label
- 11.1.4. Wet Glue Label
- 11.1.5. Thermal Transfer Label
- 11.1.5.1. Paper
- 11.1.5.2. Polyester
- 11.1.6. Wrap Around Label
- 11.1.1. Pressure-Sensitive Label
- 11.1. Market Analysis, Insights and Forecast - by Type
- 12. Competitive Analysis
- 12.1. Company Profiles
- 12.1.1 Avery Dennison
- 12.1.1.1. Company Overview
- 12.1.1.2. Products
- 12.1.1.3. Company Financials
- 12.1.1.4. SWOT Analysis
- 12.1.2 Leading Edge labels & Packaging*List Not Exhaustive
- 12.1.2.1. Company Overview
- 12.1.2.2. Products
- 12.1.2.3. Company Financials
- 12.1.2.4. SWOT Analysis
- 12.1.3 Taghleef Industries Inc
- 12.1.3.1. Company Overview
- 12.1.3.2. Products
- 12.1.3.3. Company Financials
- 12.1.3.4. SWOT Analysis
- 12.1.4 WestRock Company
- 12.1.4.1. Company Overview
- 12.1.4.2. Products
- 12.1.4.3. Company Financials
- 12.1.4.4. SWOT Analysis
- 12.1.5 Vintech Polymers Private Limited
- 12.1.5.1. Company Overview
- 12.1.5.2. Products
- 12.1.5.3. Company Financials
- 12.1.5.4. SWOT Analysis
- 12.1.6 Fort Dearborn
- 12.1.6.1. Company Overview
- 12.1.6.2. Products
- 12.1.6.3. Company Financials
- 12.1.6.4. SWOT Analysis
- 12.1.7 KRIS FLEXIPACKS PVT LTD
- 12.1.7.1. Company Overview
- 12.1.7.2. Products
- 12.1.7.3. Company Financials
- 12.1.7.4. SWOT Analysis
- 12.1.8 Fort Dearborn Company
- 12.1.8.1. Company Overview
- 12.1.8.2. Products
- 12.1.8.3. Company Financials
- 12.1.8.4. SWOT Analysis
- 12.1.9 Constantia Flexibles Group GmbH
- 12.1.9.1. Company Overview
- 12.1.9.2. Products
- 12.1.9.3. Company Financials
- 12.1.9.4. SWOT Analysis
- 12.1.10 Bemis Company
- 12.1.10.1. Company Overview
- 12.1.10.2. Products
- 12.1.10.3. Company Financials
- 12.1.10.4. SWOT Analysis
- 12.1.11 UPM Raflatc
- 12.1.11.1. Company Overview
- 12.1.11.2. Products
- 12.1.11.3. Company Financials
- 12.1.11.4. SWOT Analysis
- 12.1.12 Royal Sens Group
- 12.1.12.1. Company Overview
- 12.1.12.2. Products
- 12.1.12.3. Company Financials
- 12.1.12.4. SWOT Analysis
- 12.1.13 Klockner Pentaplast
- 12.1.13.1. Company Overview
- 12.1.13.2. Products
- 12.1.13.3. Company Financials
- 12.1.13.4. SWOT Analysis
- 12.1.14 CCL Industries LLC
- 12.1.14.1. Company Overview
- 12.1.14.2. Products
- 12.1.14.3. Company Financials
- 12.1.14.4. SWOT Analysis
- 12.1.15 3M Company
- 12.1.15.1. Company Overview
- 12.1.15.2. Products
- 12.1.15.3. Company Financials
- 12.1.15.4. SWOT Analysis
- 12.1.16 Huhtamaki Group
- 12.1.16.1. Company Overview
- 12.1.16.2. Products
- 12.1.16.3. Company Financials
- 12.1.16.4. SWOT Analysis
- 12.1.17 Lintec Corporation
- 12.1.17.1. Company Overview
- 12.1.17.2. Products
- 12.1.17.3. Company Financials
- 12.1.17.4. SWOT Analysis
- 12.1.18 Multi-Color Corporation
- 12.1.18.1. Company Overview
- 12.1.18.2. Products
- 12.1.18.3. Company Financials
- 12.1.18.4. SWOT Analysis
- 12.1.19 Fuji Seal International Inc
- 12.1.19.1. Company Overview
- 12.1.19.2. Products
- 12.1.19.3. Company Financials
- 12.1.19.4. SWOT Analysis
- 12.1.20 Lintec
- 12.1.20.1. Company Overview
- 12.1.20.2. Products
- 12.1.20.3. Company Financials
- 12.1.20.4. SWOT Analysis
- 12.1.21 Mondi
- 12.1.21.1. Company Overview
- 12.1.21.2. Products
- 12.1.21.3. Company Financials
- 12.1.21.4. SWOT Analysis
- 12.1.22 CPC Packaging
- 12.1.22.1. Company Overview
- 12.1.22.2. Products
- 12.1.22.3. Company Financials
- 12.1.22.4. SWOT Analysis
- 12.1.23 Berry Global
- 12.1.23.1. Company Overview
- 12.1.23.2. Products
- 12.1.23.3. Company Financials
- 12.1.23.4. SWOT Analysis
- 12.1.24 GTPL
- 12.1.24.1. Company Overview
- 12.1.24.2. Products
- 12.1.24.3. Company Financials
- 12.1.24.4. SWOT Analysis
- 12.1.25 Neenah Inc
- 12.1.25.1. Company Overview
- 12.1.25.2. Products
- 12.1.25.3. Company Financials
- 12.1.25.4. SWOT Analysis
- 12.1.1 Avery Dennison
- 12.2. Market Entropy
- 12.2.1 Company's Key Areas Served
- 12.2.2 Recent Developments
- 12.3. Company Market Share Analysis 2025
- 12.3.1 Top 5 Companies Market Share Analysis
- 12.3.2 Top 3 Companies Market Share Analysis
- 12.4. List of Potential Customers
- 13. Research Methodology
List of Figures
- Figure 1: Global Packaging and Label Industry Revenue Breakdown (Million, %) by Region 2025 & 2033
- Figure 2: North America Packaging and Label Industry Revenue (Million), by Type 2025 & 2033
- Figure 3: North America Packaging and Label Industry Revenue Share (%), by Type 2025 & 2033
- Figure 4: North America Packaging and Label Industry Revenue (Million), by Country 2025 & 2033
- Figure 5: North America Packaging and Label Industry Revenue Share (%), by Country 2025 & 2033
- Figure 6: Europe Packaging and Label Industry Revenue (Million), by Type 2025 & 2033
- Figure 7: Europe Packaging and Label Industry Revenue Share (%), by Type 2025 & 2033
- Figure 8: Europe Packaging and Label Industry Revenue (Million), by Country 2025 & 2033
- Figure 9: Europe Packaging and Label Industry Revenue Share (%), by Country 2025 & 2033
- Figure 10: Asia Pacific Packaging and Label Industry Revenue (Million), by Type 2025 & 2033
- Figure 11: Asia Pacific Packaging and Label Industry Revenue Share (%), by Type 2025 & 2033
- Figure 12: Asia Pacific Packaging and Label Industry Revenue (Million), by Country 2025 & 2033
- Figure 13: Asia Pacific Packaging and Label Industry Revenue Share (%), by Country 2025 & 2033
- Figure 14: Middle East Packaging and Label Industry Revenue (Million), by Type 2025 & 2033
- Figure 15: Middle East Packaging and Label Industry Revenue Share (%), by Type 2025 & 2033
- Figure 16: Middle East Packaging and Label Industry Revenue (Million), by Country 2025 & 2033
- Figure 17: Middle East Packaging and Label Industry Revenue Share (%), by Country 2025 & 2033
- Figure 18: Latin America Packaging and Label Industry Revenue (Million), by Type 2025 & 2033
- Figure 19: Latin America Packaging and Label Industry Revenue Share (%), by Type 2025 & 2033
- Figure 20: Latin America Packaging and Label Industry Revenue (Million), by Country 2025 & 2033
- Figure 21: Latin America Packaging and Label Industry Revenue Share (%), by Country 2025 & 2033
List of Tables
- Table 1: Global Packaging and Label Industry Revenue Million Forecast, by Type 2020 & 2033
- Table 2: Global Packaging and Label Industry Revenue Million Forecast, by Region 2020 & 2033
- Table 3: Global Packaging and Label Industry Revenue Million Forecast, by Type 2020 & 2033
- Table 4: Global Packaging and Label Industry Revenue Million Forecast, by Country 2020 & 2033
- Table 5: Global Packaging and Label Industry Revenue Million Forecast, by Type 2020 & 2033
- Table 6: Global Packaging and Label Industry Revenue Million Forecast, by Country 2020 & 2033
- Table 7: Global Packaging and Label Industry Revenue Million Forecast, by Type 2020 & 2033
- Table 8: Global Packaging and Label Industry Revenue Million Forecast, by Country 2020 & 2033
- Table 9: Global Packaging and Label Industry Revenue Million Forecast, by Type 2020 & 2033
- Table 10: Global Packaging and Label Industry Revenue Million Forecast, by Country 2020 & 2033
- Table 11: Global Packaging and Label Industry Revenue Million Forecast, by Type 2020 & 2033
- Table 12: Global Packaging and Label Industry Revenue Million Forecast, by Country 2020 & 2033
Frequently Asked Questions
1. What is the projected Compound Annual Growth Rate (CAGR) of the Packaging and Label Industry?
The projected CAGR is approximately 4.90%.
2. Which companies are prominent players in the Packaging and Label Industry?
Key companies in the market include Avery Dennison, Leading Edge labels & Packaging*List Not Exhaustive, Taghleef Industries Inc, WestRock Company, Vintech Polymers Private Limited, Fort Dearborn, KRIS FLEXIPACKS PVT LTD, Fort Dearborn Company, Constantia Flexibles Group GmbH, Bemis Company, UPM Raflatc, Royal Sens Group, Klockner Pentaplast, CCL Industries LLC, 3M Company, Huhtamaki Group, Lintec Corporation, Multi-Color Corporation, Fuji Seal International Inc, Lintec, Mondi, CPC Packaging, Berry Global, GTPL, Neenah Inc.
3. What are the main segments of the Packaging and Label Industry?
The market segments include Type.
4. Can you provide details about the market size?
The market size is estimated to be USD 42.29 Million as of 2022.
5. What are some drivers contributing to market growth?
The issues related to recycling of release liners and the ability to enable direct digital printing is expected to spur demand; Ability to conform to any size and shape. and yet provide the necessary protection.
6. What are the notable trends driving market growth?
Food and Beverage End-User Segment is Expected to Drive Growth of Labels.
7. Are there any restraints impacting market growth?
; Fluctuating Oil Prices.
8. Can you provide examples of recent developments in the market?
March 2021 - Dearborn Company has announced that it has acquired Hammer Packaging Corporation. The combined organization takes advantage of Hammer's state-of-the-art technology to enhance Fort Dearborn's leadership position in the decorative label and packaging marketplace by further expanding the company's geographic footprint, capacity, and capabilities.
9. What pricing options are available for accessing the report?
Pricing options include single-user, multi-user, and enterprise licenses priced at USD 4750, USD 5250, and USD 8750 respectively.
10. Is the market size provided in terms of value or volume?
The market size is provided in terms of value, measured in Million.
11. Are there any specific market keywords associated with the report?
Yes, the market keyword associated with the report is "Packaging and Label Industry," which aids in identifying and referencing the specific market segment covered.
12. How do I determine which pricing option suits my needs best?
The pricing options vary based on user requirements and access needs. Individual users may opt for single-user licenses, while businesses requiring broader access may choose multi-user or enterprise licenses for cost-effective access to the report.
13. Are there any additional resources or data provided in the Packaging and Label Industry report?
While the report offers comprehensive insights, it's advisable to review the specific contents or supplementary materials provided to ascertain if additional resources or data are available.
14. How can I stay updated on further developments or reports in the Packaging and Label Industry?
To stay informed about further developments, trends, and reports in the Packaging and Label Industry, consider subscribing to industry newsletters, following relevant companies and organizations, or regularly checking reputable industry news sources and publications.
Methodology
Step 1 - Identification of Relevant Samples Size from Population Database


Step 2 - Approaches for Defining Global Market Size (Value, Volume* & Price*)

Note*: In applicable scenarios
Step 3 - Data Sources
Primary Research
- Web Analytics
- Survey Reports
- Research Institute
- Latest Research Reports
- Opinion Leaders
Secondary Research
- Annual Reports
- White Paper
- Latest Press Release
- Industry Association
- Paid Database
- Investor Presentations

Step 4 - Data Triangulation
Involves using different sources of information in order to increase the validity of a study
These sources are likely to be stakeholders in a program - participants, other researchers, program staff, other community members, and so on.
Then we put all data in single framework & apply various statistical tools to find out the dynamic on the market.
During the analysis stage, feedback from the stakeholder groups would be compared to determine areas of agreement as well as areas of divergence