
Key Insights
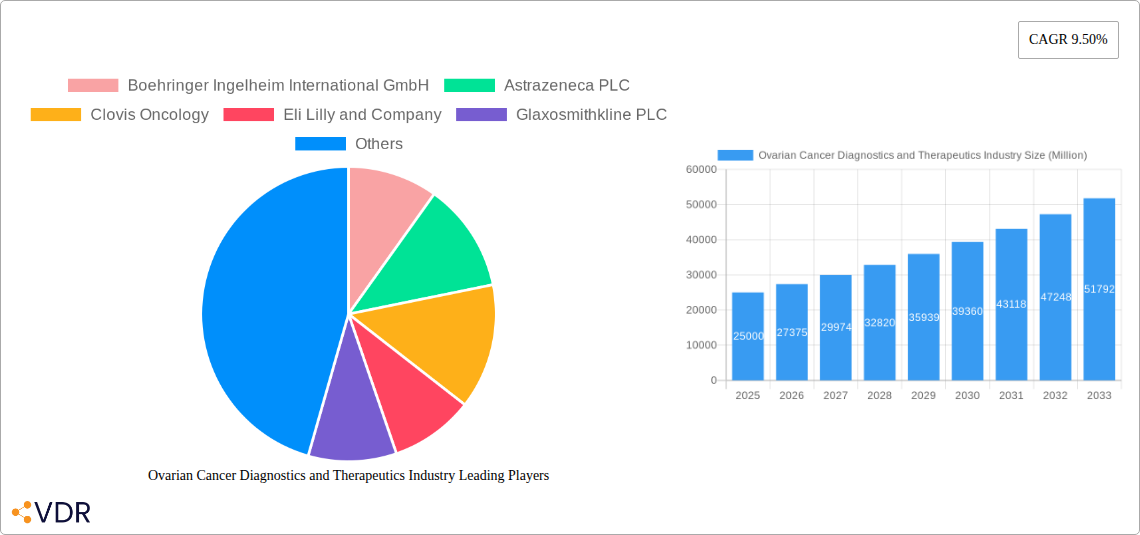
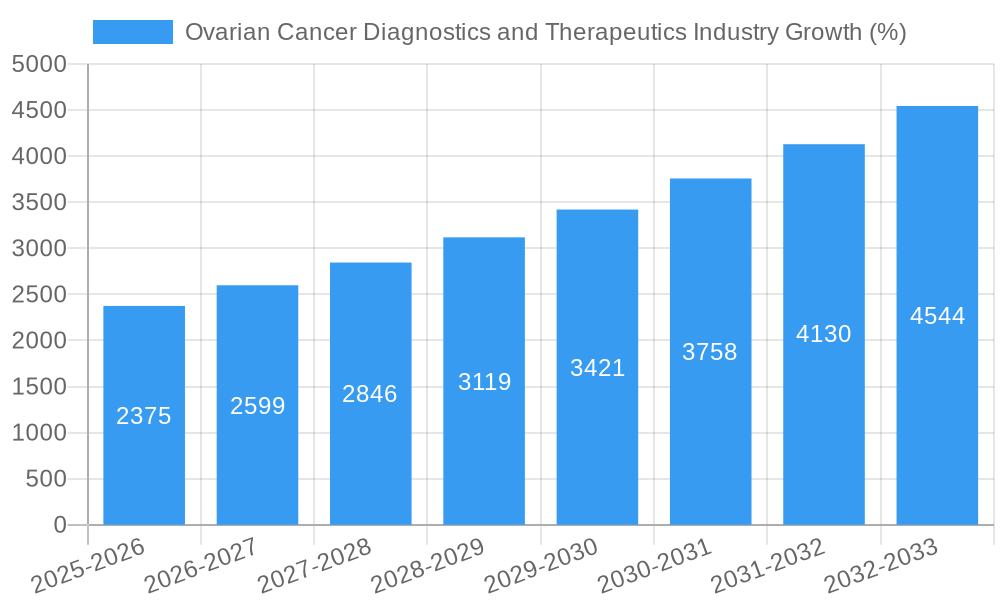
The ovarian cancer diagnostics and therapeutics market, currently exhibiting robust growth, is projected to maintain a significant expansion trajectory throughout the forecast period (2025-2033). A Compound Annual Growth Rate (CAGR) of 9.50% suggests a substantial increase in market value, driven by several key factors. Rising prevalence of ovarian cancer, particularly epithelial ovarian tumors and ovarian germ cell tumors, fuels demand for effective diagnostic tools and therapeutic interventions. Advances in targeted therapies, immunotherapy, and minimally invasive surgical techniques are enhancing treatment outcomes and prolonging survival rates, further boosting market growth. The increasing adoption of advanced imaging technologies like MRI and PET scans for early detection and improved diagnostic accuracy also contributes to the market's expansion. Furthermore, growing awareness about ovarian cancer and increased screening initiatives are playing a crucial role in early diagnosis and improved treatment outcomes. However, challenges such as high treatment costs, potential side effects of certain therapies, and limitations in early detection for certain ovarian cancer subtypes pose constraints on market growth.
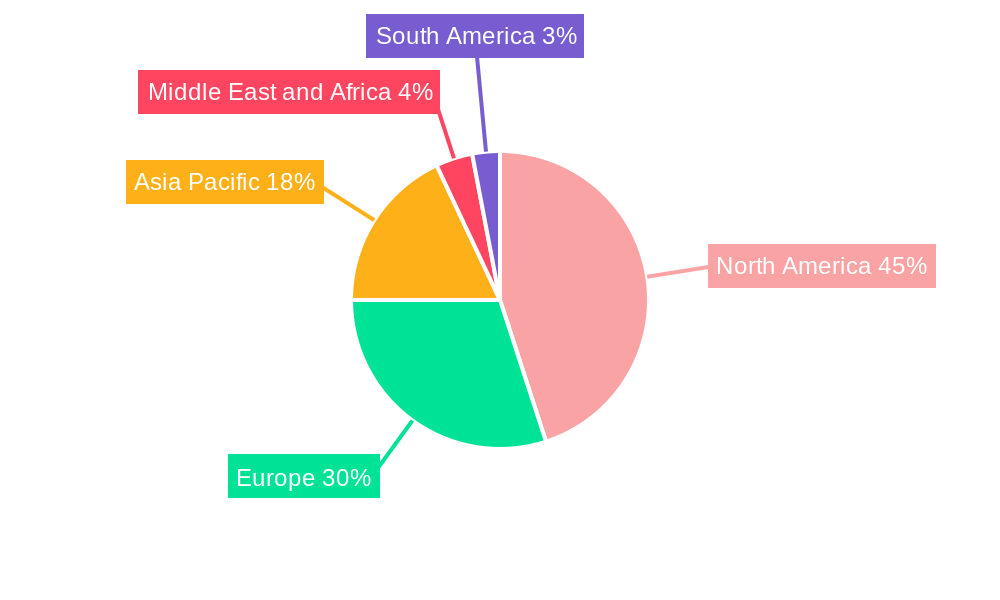
Segmentation analysis reveals significant market share held by North America, followed by Europe and Asia Pacific. The North American dominance is attributable to factors such as advanced healthcare infrastructure, high adoption of innovative technologies, and increased research and development activities. The relatively high prevalence of ovarian cancer in this region further strengthens its market position. Within the therapy segment, targeted therapies and immunotherapies are experiencing particularly rapid growth, driven by their improved efficacy and targeted mechanisms of action. The diagnostic segment is also witnessing growth, driven by advancements in imaging technologies and molecular diagnostics. Key players, including Boehringer Ingelheim, AstraZeneca, Clovis Oncology, and others, are actively engaged in developing and commercializing innovative diagnostics and therapeutics, further fueling market competition and driving innovation within the industry. The market's future hinges on ongoing research, technological advancements, and improved access to care, particularly in underserved regions.
Ovarian Cancer Diagnostics and Therapeutics Industry: A Comprehensive Market Report (2019-2033)
This comprehensive report provides an in-depth analysis of the Ovarian Cancer Diagnostics and Therapeutics market, encompassing market dynamics, growth trends, regional insights, product landscape, key players, and future outlook. The study period covers 2019-2033, with a base year of 2025 and a forecast period of 2025-2033. The report is essential for industry professionals, investors, and researchers seeking a detailed understanding of this vital sector. The parent market is the broader Oncology market, while the child market focuses specifically on ovarian cancer diagnostics and therapeutics.
Ovarian Cancer Diagnostics and Therapeutics Industry Market Dynamics & Structure
This section analyzes the market's competitive landscape, including market concentration, technological advancements, regulatory influences, and merger & acquisition (M&A) activity. The global market size in 2025 is estimated at $xx million.
- Market Concentration: The market exhibits a moderately concentrated structure, with several large multinational pharmaceutical companies holding significant market share. The top 10 players account for approximately xx% of the market.
- Technological Innovation: Advancements in genomic sequencing, targeted therapies, and immunotherapy are driving significant innovation. However, high R&D costs and regulatory hurdles pose significant barriers to entry.
- Regulatory Frameworks: Stringent regulatory approvals and clinical trial requirements influence market dynamics, impacting product launches and market access. Variations in regulatory landscapes across different regions contribute to complexities.
- Competitive Product Substitutes: The availability of alternative treatment options and diagnostic methods creates competition, influencing market share and pricing strategies.
- End-User Demographics: The aging global population and increasing prevalence of ovarian cancer are major factors driving market growth. Further segmentation by age, geographic location, and disease stage provides deeper insights.
- M&A Trends: A moderate level of M&A activity is observed, with larger players acquiring smaller companies to expand their product portfolios and gain access to innovative technologies. Approximately xx M&A deals were recorded between 2019 and 2024.
Ovarian Cancer Diagnostics and Therapeutics Industry Growth Trends & Insights
This section analyzes the market's historical and projected growth trajectory, focusing on factors influencing market size, adoption rates, technological disruptions, and evolving consumer behavior. The market is expected to witness a Compound Annual Growth Rate (CAGR) of xx% during the forecast period (2025-2033).
[Insert XXX analysis - 600 words analyzing market size evolution, adoption rates, technological disruptions and consumer behavior shifts with specific metrics (e.g., CAGR, market penetration)]
Dominant Regions, Countries, or Segments in Ovarian Cancer Diagnostics and Therapeutics Industry
This section identifies the leading geographical regions and market segments driving market growth. North America currently holds the largest market share, followed by Europe and Asia-Pacific.
- Leading Segments: Epithelial ovarian tumors constitute the largest segment by cancer type, due to higher prevalence. The therapeutics segment holds a significant share compared to diagnostics, reflecting the greater demand for effective treatments.
- Key Drivers: Factors driving growth include increasing prevalence of ovarian cancer, rising healthcare expenditure, technological advancements in diagnostics and therapeutics, and growing awareness of the disease. Government initiatives and supportive healthcare policies in certain regions also play a crucial role.
- Regional Dominance: North America's dominance is attributed to advanced healthcare infrastructure, high adoption of innovative technologies, and robust research and development activities. Europe follows with significant market size driven by high healthcare expenditure and a well-established healthcare system. Asia-Pacific is expected to witness significant growth in the forecast period, owing to increasing healthcare investments and rising awareness about ovarian cancer.
Ovarian Cancer Diagnostics and Therapeutics Industry Product Landscape
This section details product innovations, applications, and performance metrics. Recent advancements include targeted therapies, immunotherapies, and novel diagnostic tools that offer improved accuracy and early detection capabilities. The focus is on improving treatment efficacy, minimizing side effects, and enhancing patient outcomes. Unique selling propositions frequently revolve around improved target specificity, enhanced drug delivery mechanisms, and personalized treatment approaches.
Key Drivers, Barriers & Challenges in Ovarian Cancer Diagnostics and Therapeutics Industry
Key Drivers:
- Increasing prevalence of ovarian cancer globally.
- Technological advancements in diagnostics and treatment.
- Rising healthcare expenditure and insurance coverage.
- Growing awareness and improved early detection strategies.
Key Challenges and Restraints:
- High cost of treatment and limited access in developing countries.
- Drug resistance and treatment limitations.
- Stringent regulatory approvals and lengthy clinical trial processes.
- Competition among existing and emerging players.
- Supply chain disruptions impacting availability and affordability. This impacted the market by approximately xx million in 2022.
Emerging Opportunities in Ovarian Cancer Diagnostics and Therapeutics Industry
Emerging opportunities lie in personalized medicine approaches, the development of novel biomarkers for early detection, and the exploration of innovative therapeutic modalities such as CAR T-cell therapy and oncolytic viruses. The untapped potential of emerging markets in Asia and Africa also presents significant opportunities for market expansion and growth.
Growth Accelerators in the Ovarian Cancer Diagnostics and Therapeutics Industry
Long-term growth will be fueled by continuous technological advancements in diagnostics and therapeutics, strategic partnerships between pharmaceutical companies and research institutions, and expansion into underserved markets. A focus on developing more effective and targeted therapies with fewer side effects will also significantly accelerate market growth.
Key Players Shaping the Ovarian Cancer Diagnostics and Therapeutics Industry Market
- Boehringer Ingelheim International GmbH
- Astrazeneca PLC
- Clovis Oncology
- Eli Lilly and Company
- Glaxosmithkline PLC
- Siemens Healthineers AG
- Johnson & Johnson (Janssen Pharmaceuticals)
- Abbvie (Allergan PLC)
- Bristol Myers Squibb Company
- F Hoffman-La Roche Ltd
- Amneal Pharmaceuticals LLC
- Pfizer Inc
Notable Milestones in Ovarian Cancer Diagnostics and Therapeutics Industry Sector
- May 2022: HLB's subsidiary, Elevar Therapeutics, launched Apealea, an ovarian cancer treatment, in Germany after listing it on Gelbe Liste. This significantly expands market access for the drug within Germany.
- May 2022: ImmunoGen received FDA acceptance for a Biologics License Application for mirvetuximab soravtansine, a potential breakthrough in treating platinum-resistant ovarian cancer. This signals a promising advancement in treatment options.
In-Depth Ovarian Cancer Diagnostics and Therapeutics Industry Market Outlook
The ovarian cancer diagnostics and therapeutics market is poised for substantial growth, driven by continuous innovation in targeted therapies, improved diagnostic techniques, and the expansion of treatment access globally. Strategic collaborations and partnerships will be crucial in accelerating the development and commercialization of next-generation treatments. The focus on personalized medicine and early detection strategies will further enhance market potential and offer significant strategic opportunities for key players.
Ovarian Cancer Diagnostics and Therapeutics Industry Segmentation
-
1. Cancer Type
- 1.1. Epithelial Ovarian Tumors
- 1.2. Ovarian Germ Cell Tumors
- 1.3. Other Cancer Types
-
2. Modality
-
2.1. Diagnosis
- 2.1.1. Biopsy
- 2.1.2. Blood Tests
- 2.1.3. Ultrasound
- 2.1.4. PET
- 2.1.5. CT Scan
- 2.1.6. Other Diagnosis
-
2.2. Therapeutics
- 2.2.1. Chemotherapy
- 2.2.2. Radiation Therapy
- 2.2.3. Immunotherapy
- 2.2.4. Hormonal Therapy
- 2.2.5. Other Therapeutics
-
2.1. Diagnosis
Ovarian Cancer Diagnostics and Therapeutics Industry Segmentation By Geography
-
1. North America
- 1.1. United States
- 1.2. Canada
- 1.3. Mexico
-
2. Europe
- 2.1. Germany
- 2.2. United Kingdom
- 2.3. France
- 2.4. Italy
- 2.5. Spain
- 2.6. Rest of Europe
-
3. Asia Pacific
- 3.1. China
- 3.2. Japan
- 3.3. India
- 3.4. Australia
- 3.5. South Korea
- 3.6. Rest of Asia Pacific
-
4. Middle East and Africa
- 4.1. GCC
- 4.2. South Africa
- 4.3. Rest of Middle East and Africa
-
5. South America
- 5.1. Brazil
- 5.2. Argentina
- 5.3. Rest of South America
Ovarian Cancer Diagnostics and Therapeutics Industry REPORT HIGHLIGHTS
| Aspects | Details |
|---|---|
| Study Period | 2019-2033 |
| Base Year | 2024 |
| Estimated Year | 2025 |
| Forecast Period | 2025-2033 |
| Historical Period | 2019-2024 |
| Growth Rate | CAGR of 9.50% from 2019-2033 |
| Segmentation |
|
Table of Contents
- 1. Introduction
- 1.1. Research Scope
- 1.2. Market Segmentation
- 1.3. Research Methodology
- 1.4. Definitions and Assumptions
- 2. Executive Summary
- 2.1. Introduction
- 3. Market Dynamics
- 3.1. Introduction
- 3.2. Market Drivers
- 3.2.1. Increasing Burden of Ovarian Cancer; Use of Combination Therapies for the Treatment of Ovarian Cancer
- 3.3. Market Restrains
- 3.3.1. Lack of Accurate Diagnosis of Ovarian Cancer; Lack of Awareness in Emerging and Low Income Economies
- 3.4. Market Trends
- 3.4.1. CT Scan Segment is Expected to Show Better Growth Over the Forecast Period
- 4. Market Factor Analysis
- 4.1. Porters Five Forces
- 4.2. Supply/Value Chain
- 4.3. PESTEL analysis
- 4.4. Market Entropy
- 4.5. Patent/Trademark Analysis
- 5. Global Ovarian Cancer Diagnostics and Therapeutics Industry Analysis, Insights and Forecast, 2019-2031
- 5.1. Market Analysis, Insights and Forecast - by Cancer Type
- 5.1.1. Epithelial Ovarian Tumors
- 5.1.2. Ovarian Germ Cell Tumors
- 5.1.3. Other Cancer Types
- 5.2. Market Analysis, Insights and Forecast - by Modality
- 5.2.1. Diagnosis
- 5.2.1.1. Biopsy
- 5.2.1.2. Blood Tests
- 5.2.1.3. Ultrasound
- 5.2.1.4. PET
- 5.2.1.5. CT Scan
- 5.2.1.6. Other Diagnosis
- 5.2.2. Therapeutics
- 5.2.2.1. Chemotherapy
- 5.2.2.2. Radiation Therapy
- 5.2.2.3. Immunotherapy
- 5.2.2.4. Hormonal Therapy
- 5.2.2.5. Other Therapeutics
- 5.2.1. Diagnosis
- 5.3. Market Analysis, Insights and Forecast - by Region
- 5.3.1. North America
- 5.3.2. Europe
- 5.3.3. Asia Pacific
- 5.3.4. Middle East and Africa
- 5.3.5. South America
- 5.1. Market Analysis, Insights and Forecast - by Cancer Type
- 6. North America Ovarian Cancer Diagnostics and Therapeutics Industry Analysis, Insights and Forecast, 2019-2031
- 6.1. Market Analysis, Insights and Forecast - by Cancer Type
- 6.1.1. Epithelial Ovarian Tumors
- 6.1.2. Ovarian Germ Cell Tumors
- 6.1.3. Other Cancer Types
- 6.2. Market Analysis, Insights and Forecast - by Modality
- 6.2.1. Diagnosis
- 6.2.1.1. Biopsy
- 6.2.1.2. Blood Tests
- 6.2.1.3. Ultrasound
- 6.2.1.4. PET
- 6.2.1.5. CT Scan
- 6.2.1.6. Other Diagnosis
- 6.2.2. Therapeutics
- 6.2.2.1. Chemotherapy
- 6.2.2.2. Radiation Therapy
- 6.2.2.3. Immunotherapy
- 6.2.2.4. Hormonal Therapy
- 6.2.2.5. Other Therapeutics
- 6.2.1. Diagnosis
- 6.1. Market Analysis, Insights and Forecast - by Cancer Type
- 7. Europe Ovarian Cancer Diagnostics and Therapeutics Industry Analysis, Insights and Forecast, 2019-2031
- 7.1. Market Analysis, Insights and Forecast - by Cancer Type
- 7.1.1. Epithelial Ovarian Tumors
- 7.1.2. Ovarian Germ Cell Tumors
- 7.1.3. Other Cancer Types
- 7.2. Market Analysis, Insights and Forecast - by Modality
- 7.2.1. Diagnosis
- 7.2.1.1. Biopsy
- 7.2.1.2. Blood Tests
- 7.2.1.3. Ultrasound
- 7.2.1.4. PET
- 7.2.1.5. CT Scan
- 7.2.1.6. Other Diagnosis
- 7.2.2. Therapeutics
- 7.2.2.1. Chemotherapy
- 7.2.2.2. Radiation Therapy
- 7.2.2.3. Immunotherapy
- 7.2.2.4. Hormonal Therapy
- 7.2.2.5. Other Therapeutics
- 7.2.1. Diagnosis
- 7.1. Market Analysis, Insights and Forecast - by Cancer Type
- 8. Asia Pacific Ovarian Cancer Diagnostics and Therapeutics Industry Analysis, Insights and Forecast, 2019-2031
- 8.1. Market Analysis, Insights and Forecast - by Cancer Type
- 8.1.1. Epithelial Ovarian Tumors
- 8.1.2. Ovarian Germ Cell Tumors
- 8.1.3. Other Cancer Types
- 8.2. Market Analysis, Insights and Forecast - by Modality
- 8.2.1. Diagnosis
- 8.2.1.1. Biopsy
- 8.2.1.2. Blood Tests
- 8.2.1.3. Ultrasound
- 8.2.1.4. PET
- 8.2.1.5. CT Scan
- 8.2.1.6. Other Diagnosis
- 8.2.2. Therapeutics
- 8.2.2.1. Chemotherapy
- 8.2.2.2. Radiation Therapy
- 8.2.2.3. Immunotherapy
- 8.2.2.4. Hormonal Therapy
- 8.2.2.5. Other Therapeutics
- 8.2.1. Diagnosis
- 8.1. Market Analysis, Insights and Forecast - by Cancer Type
- 9. Middle East and Africa Ovarian Cancer Diagnostics and Therapeutics Industry Analysis, Insights and Forecast, 2019-2031
- 9.1. Market Analysis, Insights and Forecast - by Cancer Type
- 9.1.1. Epithelial Ovarian Tumors
- 9.1.2. Ovarian Germ Cell Tumors
- 9.1.3. Other Cancer Types
- 9.2. Market Analysis, Insights and Forecast - by Modality
- 9.2.1. Diagnosis
- 9.2.1.1. Biopsy
- 9.2.1.2. Blood Tests
- 9.2.1.3. Ultrasound
- 9.2.1.4. PET
- 9.2.1.5. CT Scan
- 9.2.1.6. Other Diagnosis
- 9.2.2. Therapeutics
- 9.2.2.1. Chemotherapy
- 9.2.2.2. Radiation Therapy
- 9.2.2.3. Immunotherapy
- 9.2.2.4. Hormonal Therapy
- 9.2.2.5. Other Therapeutics
- 9.2.1. Diagnosis
- 9.1. Market Analysis, Insights and Forecast - by Cancer Type
- 10. South America Ovarian Cancer Diagnostics and Therapeutics Industry Analysis, Insights and Forecast, 2019-2031
- 10.1. Market Analysis, Insights and Forecast - by Cancer Type
- 10.1.1. Epithelial Ovarian Tumors
- 10.1.2. Ovarian Germ Cell Tumors
- 10.1.3. Other Cancer Types
- 10.2. Market Analysis, Insights and Forecast - by Modality
- 10.2.1. Diagnosis
- 10.2.1.1. Biopsy
- 10.2.1.2. Blood Tests
- 10.2.1.3. Ultrasound
- 10.2.1.4. PET
- 10.2.1.5. CT Scan
- 10.2.1.6. Other Diagnosis
- 10.2.2. Therapeutics
- 10.2.2.1. Chemotherapy
- 10.2.2.2. Radiation Therapy
- 10.2.2.3. Immunotherapy
- 10.2.2.4. Hormonal Therapy
- 10.2.2.5. Other Therapeutics
- 10.2.1. Diagnosis
- 10.1. Market Analysis, Insights and Forecast - by Cancer Type
- 11. North America Ovarian Cancer Diagnostics and Therapeutics Industry Analysis, Insights and Forecast, 2019-2031
- 11.1. Market Analysis, Insights and Forecast - By Country/Sub-region
- 11.1.1 United States
- 11.1.2 Canada
- 11.1.3 Mexico
- 12. Europe Ovarian Cancer Diagnostics and Therapeutics Industry Analysis, Insights and Forecast, 2019-2031
- 12.1. Market Analysis, Insights and Forecast - By Country/Sub-region
- 12.1.1 Germany
- 12.1.2 United Kingdom
- 12.1.3 France
- 12.1.4 Italy
- 12.1.5 Spain
- 12.1.6 Rest of Europe
- 13. Asia Pacific Ovarian Cancer Diagnostics and Therapeutics Industry Analysis, Insights and Forecast, 2019-2031
- 13.1. Market Analysis, Insights and Forecast - By Country/Sub-region
- 13.1.1 China
- 13.1.2 Japan
- 13.1.3 India
- 13.1.4 Australia
- 13.1.5 South Korea
- 13.1.6 Rest of Asia Pacific
- 14. Middle East and Africa Ovarian Cancer Diagnostics and Therapeutics Industry Analysis, Insights and Forecast, 2019-2031
- 14.1. Market Analysis, Insights and Forecast - By Country/Sub-region
- 14.1.1 GCC
- 14.1.2 South Africa
- 14.1.3 Rest of Middle East and Africa
- 15. South America Ovarian Cancer Diagnostics and Therapeutics Industry Analysis, Insights and Forecast, 2019-2031
- 15.1. Market Analysis, Insights and Forecast - By Country/Sub-region
- 15.1.1 Brazil
- 15.1.2 Argentina
- 15.1.3 Rest of South America
- 16. Competitive Analysis
- 16.1. Global Market Share Analysis 2024
- 16.2. Company Profiles
- 16.2.1 Boehringer Ingelheim International GmbH
- 16.2.1.1. Overview
- 16.2.1.2. Products
- 16.2.1.3. SWOT Analysis
- 16.2.1.4. Recent Developments
- 16.2.1.5. Financials (Based on Availability)
- 16.2.2 Astrazeneca PLC
- 16.2.2.1. Overview
- 16.2.2.2. Products
- 16.2.2.3. SWOT Analysis
- 16.2.2.4. Recent Developments
- 16.2.2.5. Financials (Based on Availability)
- 16.2.3 Clovis Oncology
- 16.2.3.1. Overview
- 16.2.3.2. Products
- 16.2.3.3. SWOT Analysis
- 16.2.3.4. Recent Developments
- 16.2.3.5. Financials (Based on Availability)
- 16.2.4 Eli Lilly and Company
- 16.2.4.1. Overview
- 16.2.4.2. Products
- 16.2.4.3. SWOT Analysis
- 16.2.4.4. Recent Developments
- 16.2.4.5. Financials (Based on Availability)
- 16.2.5 Glaxosmithkline PLC
- 16.2.5.1. Overview
- 16.2.5.2. Products
- 16.2.5.3. SWOT Analysis
- 16.2.5.4. Recent Developments
- 16.2.5.5. Financials (Based on Availability)
- 16.2.6 Siemens Healthineers AG
- 16.2.6.1. Overview
- 16.2.6.2. Products
- 16.2.6.3. SWOT Analysis
- 16.2.6.4. Recent Developments
- 16.2.6.5. Financials (Based on Availability)
- 16.2.7 Johnson and Johnson (Janssen Pharmaceuticals)
- 16.2.7.1. Overview
- 16.2.7.2. Products
- 16.2.7.3. SWOT Analysis
- 16.2.7.4. Recent Developments
- 16.2.7.5. Financials (Based on Availability)
- 16.2.8 Abbvie (Allergan PLC)
- 16.2.8.1. Overview
- 16.2.8.2. Products
- 16.2.8.3. SWOT Analysis
- 16.2.8.4. Recent Developments
- 16.2.8.5. Financials (Based on Availability)
- 16.2.9 Bristol Myers Squibb Company
- 16.2.9.1. Overview
- 16.2.9.2. Products
- 16.2.9.3. SWOT Analysis
- 16.2.9.4. Recent Developments
- 16.2.9.5. Financials (Based on Availability)
- 16.2.10 F Hoffman-La Roche Ltd
- 16.2.10.1. Overview
- 16.2.10.2. Products
- 16.2.10.3. SWOT Analysis
- 16.2.10.4. Recent Developments
- 16.2.10.5. Financials (Based on Availability)
- 16.2.11 Amneal Pharmaceuticals LLC
- 16.2.11.1. Overview
- 16.2.11.2. Products
- 16.2.11.3. SWOT Analysis
- 16.2.11.4. Recent Developments
- 16.2.11.5. Financials (Based on Availability)
- 16.2.12 Pfizer Inc
- 16.2.12.1. Overview
- 16.2.12.2. Products
- 16.2.12.3. SWOT Analysis
- 16.2.12.4. Recent Developments
- 16.2.12.5. Financials (Based on Availability)
- 16.2.1 Boehringer Ingelheim International GmbH
List of Figures
- Figure 1: Global Ovarian Cancer Diagnostics and Therapeutics Industry Revenue Breakdown (Million, %) by Region 2024 & 2032
- Figure 2: Global Ovarian Cancer Diagnostics and Therapeutics Industry Volume Breakdown (K Unit, %) by Region 2024 & 2032
- Figure 3: North America Ovarian Cancer Diagnostics and Therapeutics Industry Revenue (Million), by Country 2024 & 2032
- Figure 4: North America Ovarian Cancer Diagnostics and Therapeutics Industry Volume (K Unit), by Country 2024 & 2032
- Figure 5: North America Ovarian Cancer Diagnostics and Therapeutics Industry Revenue Share (%), by Country 2024 & 2032
- Figure 6: North America Ovarian Cancer Diagnostics and Therapeutics Industry Volume Share (%), by Country 2024 & 2032
- Figure 7: Europe Ovarian Cancer Diagnostics and Therapeutics Industry Revenue (Million), by Country 2024 & 2032
- Figure 8: Europe Ovarian Cancer Diagnostics and Therapeutics Industry Volume (K Unit), by Country 2024 & 2032
- Figure 9: Europe Ovarian Cancer Diagnostics and Therapeutics Industry Revenue Share (%), by Country 2024 & 2032
- Figure 10: Europe Ovarian Cancer Diagnostics and Therapeutics Industry Volume Share (%), by Country 2024 & 2032
- Figure 11: Asia Pacific Ovarian Cancer Diagnostics and Therapeutics Industry Revenue (Million), by Country 2024 & 2032
- Figure 12: Asia Pacific Ovarian Cancer Diagnostics and Therapeutics Industry Volume (K Unit), by Country 2024 & 2032
- Figure 13: Asia Pacific Ovarian Cancer Diagnostics and Therapeutics Industry Revenue Share (%), by Country 2024 & 2032
- Figure 14: Asia Pacific Ovarian Cancer Diagnostics and Therapeutics Industry Volume Share (%), by Country 2024 & 2032
- Figure 15: Middle East and Africa Ovarian Cancer Diagnostics and Therapeutics Industry Revenue (Million), by Country 2024 & 2032
- Figure 16: Middle East and Africa Ovarian Cancer Diagnostics and Therapeutics Industry Volume (K Unit), by Country 2024 & 2032
- Figure 17: Middle East and Africa Ovarian Cancer Diagnostics and Therapeutics Industry Revenue Share (%), by Country 2024 & 2032
- Figure 18: Middle East and Africa Ovarian Cancer Diagnostics and Therapeutics Industry Volume Share (%), by Country 2024 & 2032
- Figure 19: South America Ovarian Cancer Diagnostics and Therapeutics Industry Revenue (Million), by Country 2024 & 2032
- Figure 20: South America Ovarian Cancer Diagnostics and Therapeutics Industry Volume (K Unit), by Country 2024 & 2032
- Figure 21: South America Ovarian Cancer Diagnostics and Therapeutics Industry Revenue Share (%), by Country 2024 & 2032
- Figure 22: South America Ovarian Cancer Diagnostics and Therapeutics Industry Volume Share (%), by Country 2024 & 2032
- Figure 23: North America Ovarian Cancer Diagnostics and Therapeutics Industry Revenue (Million), by Cancer Type 2024 & 2032
- Figure 24: North America Ovarian Cancer Diagnostics and Therapeutics Industry Volume (K Unit), by Cancer Type 2024 & 2032
- Figure 25: North America Ovarian Cancer Diagnostics and Therapeutics Industry Revenue Share (%), by Cancer Type 2024 & 2032
- Figure 26: North America Ovarian Cancer Diagnostics and Therapeutics Industry Volume Share (%), by Cancer Type 2024 & 2032
- Figure 27: North America Ovarian Cancer Diagnostics and Therapeutics Industry Revenue (Million), by Modality 2024 & 2032
- Figure 28: North America Ovarian Cancer Diagnostics and Therapeutics Industry Volume (K Unit), by Modality 2024 & 2032
- Figure 29: North America Ovarian Cancer Diagnostics and Therapeutics Industry Revenue Share (%), by Modality 2024 & 2032
- Figure 30: North America Ovarian Cancer Diagnostics and Therapeutics Industry Volume Share (%), by Modality 2024 & 2032
- Figure 31: North America Ovarian Cancer Diagnostics and Therapeutics Industry Revenue (Million), by Country 2024 & 2032
- Figure 32: North America Ovarian Cancer Diagnostics and Therapeutics Industry Volume (K Unit), by Country 2024 & 2032
- Figure 33: North America Ovarian Cancer Diagnostics and Therapeutics Industry Revenue Share (%), by Country 2024 & 2032
- Figure 34: North America Ovarian Cancer Diagnostics and Therapeutics Industry Volume Share (%), by Country 2024 & 2032
- Figure 35: Europe Ovarian Cancer Diagnostics and Therapeutics Industry Revenue (Million), by Cancer Type 2024 & 2032
- Figure 36: Europe Ovarian Cancer Diagnostics and Therapeutics Industry Volume (K Unit), by Cancer Type 2024 & 2032
- Figure 37: Europe Ovarian Cancer Diagnostics and Therapeutics Industry Revenue Share (%), by Cancer Type 2024 & 2032
- Figure 38: Europe Ovarian Cancer Diagnostics and Therapeutics Industry Volume Share (%), by Cancer Type 2024 & 2032
- Figure 39: Europe Ovarian Cancer Diagnostics and Therapeutics Industry Revenue (Million), by Modality 2024 & 2032
- Figure 40: Europe Ovarian Cancer Diagnostics and Therapeutics Industry Volume (K Unit), by Modality 2024 & 2032
- Figure 41: Europe Ovarian Cancer Diagnostics and Therapeutics Industry Revenue Share (%), by Modality 2024 & 2032
- Figure 42: Europe Ovarian Cancer Diagnostics and Therapeutics Industry Volume Share (%), by Modality 2024 & 2032
- Figure 43: Europe Ovarian Cancer Diagnostics and Therapeutics Industry Revenue (Million), by Country 2024 & 2032
- Figure 44: Europe Ovarian Cancer Diagnostics and Therapeutics Industry Volume (K Unit), by Country 2024 & 2032
- Figure 45: Europe Ovarian Cancer Diagnostics and Therapeutics Industry Revenue Share (%), by Country 2024 & 2032
- Figure 46: Europe Ovarian Cancer Diagnostics and Therapeutics Industry Volume Share (%), by Country 2024 & 2032
- Figure 47: Asia Pacific Ovarian Cancer Diagnostics and Therapeutics Industry Revenue (Million), by Cancer Type 2024 & 2032
- Figure 48: Asia Pacific Ovarian Cancer Diagnostics and Therapeutics Industry Volume (K Unit), by Cancer Type 2024 & 2032
- Figure 49: Asia Pacific Ovarian Cancer Diagnostics and Therapeutics Industry Revenue Share (%), by Cancer Type 2024 & 2032
- Figure 50: Asia Pacific Ovarian Cancer Diagnostics and Therapeutics Industry Volume Share (%), by Cancer Type 2024 & 2032
- Figure 51: Asia Pacific Ovarian Cancer Diagnostics and Therapeutics Industry Revenue (Million), by Modality 2024 & 2032
- Figure 52: Asia Pacific Ovarian Cancer Diagnostics and Therapeutics Industry Volume (K Unit), by Modality 2024 & 2032
- Figure 53: Asia Pacific Ovarian Cancer Diagnostics and Therapeutics Industry Revenue Share (%), by Modality 2024 & 2032
- Figure 54: Asia Pacific Ovarian Cancer Diagnostics and Therapeutics Industry Volume Share (%), by Modality 2024 & 2032
- Figure 55: Asia Pacific Ovarian Cancer Diagnostics and Therapeutics Industry Revenue (Million), by Country 2024 & 2032
- Figure 56: Asia Pacific Ovarian Cancer Diagnostics and Therapeutics Industry Volume (K Unit), by Country 2024 & 2032
- Figure 57: Asia Pacific Ovarian Cancer Diagnostics and Therapeutics Industry Revenue Share (%), by Country 2024 & 2032
- Figure 58: Asia Pacific Ovarian Cancer Diagnostics and Therapeutics Industry Volume Share (%), by Country 2024 & 2032
- Figure 59: Middle East and Africa Ovarian Cancer Diagnostics and Therapeutics Industry Revenue (Million), by Cancer Type 2024 & 2032
- Figure 60: Middle East and Africa Ovarian Cancer Diagnostics and Therapeutics Industry Volume (K Unit), by Cancer Type 2024 & 2032
- Figure 61: Middle East and Africa Ovarian Cancer Diagnostics and Therapeutics Industry Revenue Share (%), by Cancer Type 2024 & 2032
- Figure 62: Middle East and Africa Ovarian Cancer Diagnostics and Therapeutics Industry Volume Share (%), by Cancer Type 2024 & 2032
- Figure 63: Middle East and Africa Ovarian Cancer Diagnostics and Therapeutics Industry Revenue (Million), by Modality 2024 & 2032
- Figure 64: Middle East and Africa Ovarian Cancer Diagnostics and Therapeutics Industry Volume (K Unit), by Modality 2024 & 2032
- Figure 65: Middle East and Africa Ovarian Cancer Diagnostics and Therapeutics Industry Revenue Share (%), by Modality 2024 & 2032
- Figure 66: Middle East and Africa Ovarian Cancer Diagnostics and Therapeutics Industry Volume Share (%), by Modality 2024 & 2032
- Figure 67: Middle East and Africa Ovarian Cancer Diagnostics and Therapeutics Industry Revenue (Million), by Country 2024 & 2032
- Figure 68: Middle East and Africa Ovarian Cancer Diagnostics and Therapeutics Industry Volume (K Unit), by Country 2024 & 2032
- Figure 69: Middle East and Africa Ovarian Cancer Diagnostics and Therapeutics Industry Revenue Share (%), by Country 2024 & 2032
- Figure 70: Middle East and Africa Ovarian Cancer Diagnostics and Therapeutics Industry Volume Share (%), by Country 2024 & 2032
- Figure 71: South America Ovarian Cancer Diagnostics and Therapeutics Industry Revenue (Million), by Cancer Type 2024 & 2032
- Figure 72: South America Ovarian Cancer Diagnostics and Therapeutics Industry Volume (K Unit), by Cancer Type 2024 & 2032
- Figure 73: South America Ovarian Cancer Diagnostics and Therapeutics Industry Revenue Share (%), by Cancer Type 2024 & 2032
- Figure 74: South America Ovarian Cancer Diagnostics and Therapeutics Industry Volume Share (%), by Cancer Type 2024 & 2032
- Figure 75: South America Ovarian Cancer Diagnostics and Therapeutics Industry Revenue (Million), by Modality 2024 & 2032
- Figure 76: South America Ovarian Cancer Diagnostics and Therapeutics Industry Volume (K Unit), by Modality 2024 & 2032
- Figure 77: South America Ovarian Cancer Diagnostics and Therapeutics Industry Revenue Share (%), by Modality 2024 & 2032
- Figure 78: South America Ovarian Cancer Diagnostics and Therapeutics Industry Volume Share (%), by Modality 2024 & 2032
- Figure 79: South America Ovarian Cancer Diagnostics and Therapeutics Industry Revenue (Million), by Country 2024 & 2032
- Figure 80: South America Ovarian Cancer Diagnostics and Therapeutics Industry Volume (K Unit), by Country 2024 & 2032
- Figure 81: South America Ovarian Cancer Diagnostics and Therapeutics Industry Revenue Share (%), by Country 2024 & 2032
- Figure 82: South America Ovarian Cancer Diagnostics and Therapeutics Industry Volume Share (%), by Country 2024 & 2032
List of Tables
- Table 1: Global Ovarian Cancer Diagnostics and Therapeutics Industry Revenue Million Forecast, by Region 2019 & 2032
- Table 2: Global Ovarian Cancer Diagnostics and Therapeutics Industry Volume K Unit Forecast, by Region 2019 & 2032
- Table 3: Global Ovarian Cancer Diagnostics and Therapeutics Industry Revenue Million Forecast, by Cancer Type 2019 & 2032
- Table 4: Global Ovarian Cancer Diagnostics and Therapeutics Industry Volume K Unit Forecast, by Cancer Type 2019 & 2032
- Table 5: Global Ovarian Cancer Diagnostics and Therapeutics Industry Revenue Million Forecast, by Modality 2019 & 2032
- Table 6: Global Ovarian Cancer Diagnostics and Therapeutics Industry Volume K Unit Forecast, by Modality 2019 & 2032
- Table 7: Global Ovarian Cancer Diagnostics and Therapeutics Industry Revenue Million Forecast, by Region 2019 & 2032
- Table 8: Global Ovarian Cancer Diagnostics and Therapeutics Industry Volume K Unit Forecast, by Region 2019 & 2032
- Table 9: Global Ovarian Cancer Diagnostics and Therapeutics Industry Revenue Million Forecast, by Country 2019 & 2032
- Table 10: Global Ovarian Cancer Diagnostics and Therapeutics Industry Volume K Unit Forecast, by Country 2019 & 2032
- Table 11: United States Ovarian Cancer Diagnostics and Therapeutics Industry Revenue (Million) Forecast, by Application 2019 & 2032
- Table 12: United States Ovarian Cancer Diagnostics and Therapeutics Industry Volume (K Unit) Forecast, by Application 2019 & 2032
- Table 13: Canada Ovarian Cancer Diagnostics and Therapeutics Industry Revenue (Million) Forecast, by Application 2019 & 2032
- Table 14: Canada Ovarian Cancer Diagnostics and Therapeutics Industry Volume (K Unit) Forecast, by Application 2019 & 2032
- Table 15: Mexico Ovarian Cancer Diagnostics and Therapeutics Industry Revenue (Million) Forecast, by Application 2019 & 2032
- Table 16: Mexico Ovarian Cancer Diagnostics and Therapeutics Industry Volume (K Unit) Forecast, by Application 2019 & 2032
- Table 17: Global Ovarian Cancer Diagnostics and Therapeutics Industry Revenue Million Forecast, by Country 2019 & 2032
- Table 18: Global Ovarian Cancer Diagnostics and Therapeutics Industry Volume K Unit Forecast, by Country 2019 & 2032
- Table 19: Germany Ovarian Cancer Diagnostics and Therapeutics Industry Revenue (Million) Forecast, by Application 2019 & 2032
- Table 20: Germany Ovarian Cancer Diagnostics and Therapeutics Industry Volume (K Unit) Forecast, by Application 2019 & 2032
- Table 21: United Kingdom Ovarian Cancer Diagnostics and Therapeutics Industry Revenue (Million) Forecast, by Application 2019 & 2032
- Table 22: United Kingdom Ovarian Cancer Diagnostics and Therapeutics Industry Volume (K Unit) Forecast, by Application 2019 & 2032
- Table 23: France Ovarian Cancer Diagnostics and Therapeutics Industry Revenue (Million) Forecast, by Application 2019 & 2032
- Table 24: France Ovarian Cancer Diagnostics and Therapeutics Industry Volume (K Unit) Forecast, by Application 2019 & 2032
- Table 25: Italy Ovarian Cancer Diagnostics and Therapeutics Industry Revenue (Million) Forecast, by Application 2019 & 2032
- Table 26: Italy Ovarian Cancer Diagnostics and Therapeutics Industry Volume (K Unit) Forecast, by Application 2019 & 2032
- Table 27: Spain Ovarian Cancer Diagnostics and Therapeutics Industry Revenue (Million) Forecast, by Application 2019 & 2032
- Table 28: Spain Ovarian Cancer Diagnostics and Therapeutics Industry Volume (K Unit) Forecast, by Application 2019 & 2032
- Table 29: Rest of Europe Ovarian Cancer Diagnostics and Therapeutics Industry Revenue (Million) Forecast, by Application 2019 & 2032
- Table 30: Rest of Europe Ovarian Cancer Diagnostics and Therapeutics Industry Volume (K Unit) Forecast, by Application 2019 & 2032
- Table 31: Global Ovarian Cancer Diagnostics and Therapeutics Industry Revenue Million Forecast, by Country 2019 & 2032
- Table 32: Global Ovarian Cancer Diagnostics and Therapeutics Industry Volume K Unit Forecast, by Country 2019 & 2032
- Table 33: China Ovarian Cancer Diagnostics and Therapeutics Industry Revenue (Million) Forecast, by Application 2019 & 2032
- Table 34: China Ovarian Cancer Diagnostics and Therapeutics Industry Volume (K Unit) Forecast, by Application 2019 & 2032
- Table 35: Japan Ovarian Cancer Diagnostics and Therapeutics Industry Revenue (Million) Forecast, by Application 2019 & 2032
- Table 36: Japan Ovarian Cancer Diagnostics and Therapeutics Industry Volume (K Unit) Forecast, by Application 2019 & 2032
- Table 37: India Ovarian Cancer Diagnostics and Therapeutics Industry Revenue (Million) Forecast, by Application 2019 & 2032
- Table 38: India Ovarian Cancer Diagnostics and Therapeutics Industry Volume (K Unit) Forecast, by Application 2019 & 2032
- Table 39: Australia Ovarian Cancer Diagnostics and Therapeutics Industry Revenue (Million) Forecast, by Application 2019 & 2032
- Table 40: Australia Ovarian Cancer Diagnostics and Therapeutics Industry Volume (K Unit) Forecast, by Application 2019 & 2032
- Table 41: South Korea Ovarian Cancer Diagnostics and Therapeutics Industry Revenue (Million) Forecast, by Application 2019 & 2032
- Table 42: South Korea Ovarian Cancer Diagnostics and Therapeutics Industry Volume (K Unit) Forecast, by Application 2019 & 2032
- Table 43: Rest of Asia Pacific Ovarian Cancer Diagnostics and Therapeutics Industry Revenue (Million) Forecast, by Application 2019 & 2032
- Table 44: Rest of Asia Pacific Ovarian Cancer Diagnostics and Therapeutics Industry Volume (K Unit) Forecast, by Application 2019 & 2032
- Table 45: Global Ovarian Cancer Diagnostics and Therapeutics Industry Revenue Million Forecast, by Country 2019 & 2032
- Table 46: Global Ovarian Cancer Diagnostics and Therapeutics Industry Volume K Unit Forecast, by Country 2019 & 2032
- Table 47: GCC Ovarian Cancer Diagnostics and Therapeutics Industry Revenue (Million) Forecast, by Application 2019 & 2032
- Table 48: GCC Ovarian Cancer Diagnostics and Therapeutics Industry Volume (K Unit) Forecast, by Application 2019 & 2032
- Table 49: South Africa Ovarian Cancer Diagnostics and Therapeutics Industry Revenue (Million) Forecast, by Application 2019 & 2032
- Table 50: South Africa Ovarian Cancer Diagnostics and Therapeutics Industry Volume (K Unit) Forecast, by Application 2019 & 2032
- Table 51: Rest of Middle East and Africa Ovarian Cancer Diagnostics and Therapeutics Industry Revenue (Million) Forecast, by Application 2019 & 2032
- Table 52: Rest of Middle East and Africa Ovarian Cancer Diagnostics and Therapeutics Industry Volume (K Unit) Forecast, by Application 2019 & 2032
- Table 53: Global Ovarian Cancer Diagnostics and Therapeutics Industry Revenue Million Forecast, by Country 2019 & 2032
- Table 54: Global Ovarian Cancer Diagnostics and Therapeutics Industry Volume K Unit Forecast, by Country 2019 & 2032
- Table 55: Brazil Ovarian Cancer Diagnostics and Therapeutics Industry Revenue (Million) Forecast, by Application 2019 & 2032
- Table 56: Brazil Ovarian Cancer Diagnostics and Therapeutics Industry Volume (K Unit) Forecast, by Application 2019 & 2032
- Table 57: Argentina Ovarian Cancer Diagnostics and Therapeutics Industry Revenue (Million) Forecast, by Application 2019 & 2032
- Table 58: Argentina Ovarian Cancer Diagnostics and Therapeutics Industry Volume (K Unit) Forecast, by Application 2019 & 2032
- Table 59: Rest of South America Ovarian Cancer Diagnostics and Therapeutics Industry Revenue (Million) Forecast, by Application 2019 & 2032
- Table 60: Rest of South America Ovarian Cancer Diagnostics and Therapeutics Industry Volume (K Unit) Forecast, by Application 2019 & 2032
- Table 61: Global Ovarian Cancer Diagnostics and Therapeutics Industry Revenue Million Forecast, by Cancer Type 2019 & 2032
- Table 62: Global Ovarian Cancer Diagnostics and Therapeutics Industry Volume K Unit Forecast, by Cancer Type 2019 & 2032
- Table 63: Global Ovarian Cancer Diagnostics and Therapeutics Industry Revenue Million Forecast, by Modality 2019 & 2032
- Table 64: Global Ovarian Cancer Diagnostics and Therapeutics Industry Volume K Unit Forecast, by Modality 2019 & 2032
- Table 65: Global Ovarian Cancer Diagnostics and Therapeutics Industry Revenue Million Forecast, by Country 2019 & 2032
- Table 66: Global Ovarian Cancer Diagnostics and Therapeutics Industry Volume K Unit Forecast, by Country 2019 & 2032
- Table 67: United States Ovarian Cancer Diagnostics and Therapeutics Industry Revenue (Million) Forecast, by Application 2019 & 2032
- Table 68: United States Ovarian Cancer Diagnostics and Therapeutics Industry Volume (K Unit) Forecast, by Application 2019 & 2032
- Table 69: Canada Ovarian Cancer Diagnostics and Therapeutics Industry Revenue (Million) Forecast, by Application 2019 & 2032
- Table 70: Canada Ovarian Cancer Diagnostics and Therapeutics Industry Volume (K Unit) Forecast, by Application 2019 & 2032
- Table 71: Mexico Ovarian Cancer Diagnostics and Therapeutics Industry Revenue (Million) Forecast, by Application 2019 & 2032
- Table 72: Mexico Ovarian Cancer Diagnostics and Therapeutics Industry Volume (K Unit) Forecast, by Application 2019 & 2032
- Table 73: Global Ovarian Cancer Diagnostics and Therapeutics Industry Revenue Million Forecast, by Cancer Type 2019 & 2032
- Table 74: Global Ovarian Cancer Diagnostics and Therapeutics Industry Volume K Unit Forecast, by Cancer Type 2019 & 2032
- Table 75: Global Ovarian Cancer Diagnostics and Therapeutics Industry Revenue Million Forecast, by Modality 2019 & 2032
- Table 76: Global Ovarian Cancer Diagnostics and Therapeutics Industry Volume K Unit Forecast, by Modality 2019 & 2032
- Table 77: Global Ovarian Cancer Diagnostics and Therapeutics Industry Revenue Million Forecast, by Country 2019 & 2032
- Table 78: Global Ovarian Cancer Diagnostics and Therapeutics Industry Volume K Unit Forecast, by Country 2019 & 2032
- Table 79: Germany Ovarian Cancer Diagnostics and Therapeutics Industry Revenue (Million) Forecast, by Application 2019 & 2032
- Table 80: Germany Ovarian Cancer Diagnostics and Therapeutics Industry Volume (K Unit) Forecast, by Application 2019 & 2032
- Table 81: United Kingdom Ovarian Cancer Diagnostics and Therapeutics Industry Revenue (Million) Forecast, by Application 2019 & 2032
- Table 82: United Kingdom Ovarian Cancer Diagnostics and Therapeutics Industry Volume (K Unit) Forecast, by Application 2019 & 2032
- Table 83: France Ovarian Cancer Diagnostics and Therapeutics Industry Revenue (Million) Forecast, by Application 2019 & 2032
- Table 84: France Ovarian Cancer Diagnostics and Therapeutics Industry Volume (K Unit) Forecast, by Application 2019 & 2032
- Table 85: Italy Ovarian Cancer Diagnostics and Therapeutics Industry Revenue (Million) Forecast, by Application 2019 & 2032
- Table 86: Italy Ovarian Cancer Diagnostics and Therapeutics Industry Volume (K Unit) Forecast, by Application 2019 & 2032
- Table 87: Spain Ovarian Cancer Diagnostics and Therapeutics Industry Revenue (Million) Forecast, by Application 2019 & 2032
- Table 88: Spain Ovarian Cancer Diagnostics and Therapeutics Industry Volume (K Unit) Forecast, by Application 2019 & 2032
- Table 89: Rest of Europe Ovarian Cancer Diagnostics and Therapeutics Industry Revenue (Million) Forecast, by Application 2019 & 2032
- Table 90: Rest of Europe Ovarian Cancer Diagnostics and Therapeutics Industry Volume (K Unit) Forecast, by Application 2019 & 2032
- Table 91: Global Ovarian Cancer Diagnostics and Therapeutics Industry Revenue Million Forecast, by Cancer Type 2019 & 2032
- Table 92: Global Ovarian Cancer Diagnostics and Therapeutics Industry Volume K Unit Forecast, by Cancer Type 2019 & 2032
- Table 93: Global Ovarian Cancer Diagnostics and Therapeutics Industry Revenue Million Forecast, by Modality 2019 & 2032
- Table 94: Global Ovarian Cancer Diagnostics and Therapeutics Industry Volume K Unit Forecast, by Modality 2019 & 2032
- Table 95: Global Ovarian Cancer Diagnostics and Therapeutics Industry Revenue Million Forecast, by Country 2019 & 2032
- Table 96: Global Ovarian Cancer Diagnostics and Therapeutics Industry Volume K Unit Forecast, by Country 2019 & 2032
- Table 97: China Ovarian Cancer Diagnostics and Therapeutics Industry Revenue (Million) Forecast, by Application 2019 & 2032
- Table 98: China Ovarian Cancer Diagnostics and Therapeutics Industry Volume (K Unit) Forecast, by Application 2019 & 2032
- Table 99: Japan Ovarian Cancer Diagnostics and Therapeutics Industry Revenue (Million) Forecast, by Application 2019 & 2032
- Table 100: Japan Ovarian Cancer Diagnostics and Therapeutics Industry Volume (K Unit) Forecast, by Application 2019 & 2032
- Table 101: India Ovarian Cancer Diagnostics and Therapeutics Industry Revenue (Million) Forecast, by Application 2019 & 2032
- Table 102: India Ovarian Cancer Diagnostics and Therapeutics Industry Volume (K Unit) Forecast, by Application 2019 & 2032
- Table 103: Australia Ovarian Cancer Diagnostics and Therapeutics Industry Revenue (Million) Forecast, by Application 2019 & 2032
- Table 104: Australia Ovarian Cancer Diagnostics and Therapeutics Industry Volume (K Unit) Forecast, by Application 2019 & 2032
- Table 105: South Korea Ovarian Cancer Diagnostics and Therapeutics Industry Revenue (Million) Forecast, by Application 2019 & 2032
- Table 106: South Korea Ovarian Cancer Diagnostics and Therapeutics Industry Volume (K Unit) Forecast, by Application 2019 & 2032
- Table 107: Rest of Asia Pacific Ovarian Cancer Diagnostics and Therapeutics Industry Revenue (Million) Forecast, by Application 2019 & 2032
- Table 108: Rest of Asia Pacific Ovarian Cancer Diagnostics and Therapeutics Industry Volume (K Unit) Forecast, by Application 2019 & 2032
- Table 109: Global Ovarian Cancer Diagnostics and Therapeutics Industry Revenue Million Forecast, by Cancer Type 2019 & 2032
- Table 110: Global Ovarian Cancer Diagnostics and Therapeutics Industry Volume K Unit Forecast, by Cancer Type 2019 & 2032
- Table 111: Global Ovarian Cancer Diagnostics and Therapeutics Industry Revenue Million Forecast, by Modality 2019 & 2032
- Table 112: Global Ovarian Cancer Diagnostics and Therapeutics Industry Volume K Unit Forecast, by Modality 2019 & 2032
- Table 113: Global Ovarian Cancer Diagnostics and Therapeutics Industry Revenue Million Forecast, by Country 2019 & 2032
- Table 114: Global Ovarian Cancer Diagnostics and Therapeutics Industry Volume K Unit Forecast, by Country 2019 & 2032
- Table 115: GCC Ovarian Cancer Diagnostics and Therapeutics Industry Revenue (Million) Forecast, by Application 2019 & 2032
- Table 116: GCC Ovarian Cancer Diagnostics and Therapeutics Industry Volume (K Unit) Forecast, by Application 2019 & 2032
- Table 117: South Africa Ovarian Cancer Diagnostics and Therapeutics Industry Revenue (Million) Forecast, by Application 2019 & 2032
- Table 118: South Africa Ovarian Cancer Diagnostics and Therapeutics Industry Volume (K Unit) Forecast, by Application 2019 & 2032
- Table 119: Rest of Middle East and Africa Ovarian Cancer Diagnostics and Therapeutics Industry Revenue (Million) Forecast, by Application 2019 & 2032
- Table 120: Rest of Middle East and Africa Ovarian Cancer Diagnostics and Therapeutics Industry Volume (K Unit) Forecast, by Application 2019 & 2032
- Table 121: Global Ovarian Cancer Diagnostics and Therapeutics Industry Revenue Million Forecast, by Cancer Type 2019 & 2032
- Table 122: Global Ovarian Cancer Diagnostics and Therapeutics Industry Volume K Unit Forecast, by Cancer Type 2019 & 2032
- Table 123: Global Ovarian Cancer Diagnostics and Therapeutics Industry Revenue Million Forecast, by Modality 2019 & 2032
- Table 124: Global Ovarian Cancer Diagnostics and Therapeutics Industry Volume K Unit Forecast, by Modality 2019 & 2032
- Table 125: Global Ovarian Cancer Diagnostics and Therapeutics Industry Revenue Million Forecast, by Country 2019 & 2032
- Table 126: Global Ovarian Cancer Diagnostics and Therapeutics Industry Volume K Unit Forecast, by Country 2019 & 2032
- Table 127: Brazil Ovarian Cancer Diagnostics and Therapeutics Industry Revenue (Million) Forecast, by Application 2019 & 2032
- Table 128: Brazil Ovarian Cancer Diagnostics and Therapeutics Industry Volume (K Unit) Forecast, by Application 2019 & 2032
- Table 129: Argentina Ovarian Cancer Diagnostics and Therapeutics Industry Revenue (Million) Forecast, by Application 2019 & 2032
- Table 130: Argentina Ovarian Cancer Diagnostics and Therapeutics Industry Volume (K Unit) Forecast, by Application 2019 & 2032
- Table 131: Rest of South America Ovarian Cancer Diagnostics and Therapeutics Industry Revenue (Million) Forecast, by Application 2019 & 2032
- Table 132: Rest of South America Ovarian Cancer Diagnostics and Therapeutics Industry Volume (K Unit) Forecast, by Application 2019 & 2032
Frequently Asked Questions
1. What is the projected Compound Annual Growth Rate (CAGR) of the Ovarian Cancer Diagnostics and Therapeutics Industry?
The projected CAGR is approximately 9.50%.
2. Which companies are prominent players in the Ovarian Cancer Diagnostics and Therapeutics Industry?
Key companies in the market include Boehringer Ingelheim International GmbH, Astrazeneca PLC, Clovis Oncology, Eli Lilly and Company, Glaxosmithkline PLC, Siemens Healthineers AG, Johnson and Johnson (Janssen Pharmaceuticals), Abbvie (Allergan PLC), Bristol Myers Squibb Company, F Hoffman-La Roche Ltd, Amneal Pharmaceuticals LLC, Pfizer Inc.
3. What are the main segments of the Ovarian Cancer Diagnostics and Therapeutics Industry?
The market segments include Cancer Type, Modality.
4. Can you provide details about the market size?
The market size is estimated to be USD XX Million as of 2022.
5. What are some drivers contributing to market growth?
Increasing Burden of Ovarian Cancer; Use of Combination Therapies for the Treatment of Ovarian Cancer.
6. What are the notable trends driving market growth?
CT Scan Segment is Expected to Show Better Growth Over the Forecast Period.
7. Are there any restraints impacting market growth?
Lack of Accurate Diagnosis of Ovarian Cancer; Lack of Awareness in Emerging and Low Income Economies.
8. Can you provide examples of recent developments in the market?
May 2022: HLB reported that its subsidiary Elevar Therapeutics started marketing Apealea, an ovarian cancer treatment, in Germany after listing the drug on Gelbe Liste, a German drug distribution website.
9. What pricing options are available for accessing the report?
Pricing options include single-user, multi-user, and enterprise licenses priced at USD 4750, USD 5250, and USD 8750 respectively.
10. Is the market size provided in terms of value or volume?
The market size is provided in terms of value, measured in Million and volume, measured in K Unit.
11. Are there any specific market keywords associated with the report?
Yes, the market keyword associated with the report is "Ovarian Cancer Diagnostics and Therapeutics Industry," which aids in identifying and referencing the specific market segment covered.
12. How do I determine which pricing option suits my needs best?
The pricing options vary based on user requirements and access needs. Individual users may opt for single-user licenses, while businesses requiring broader access may choose multi-user or enterprise licenses for cost-effective access to the report.
13. Are there any additional resources or data provided in the Ovarian Cancer Diagnostics and Therapeutics Industry report?
While the report offers comprehensive insights, it's advisable to review the specific contents or supplementary materials provided to ascertain if additional resources or data are available.
14. How can I stay updated on further developments or reports in the Ovarian Cancer Diagnostics and Therapeutics Industry?
To stay informed about further developments, trends, and reports in the Ovarian Cancer Diagnostics and Therapeutics Industry, consider subscribing to industry newsletters, following relevant companies and organizations, or regularly checking reputable industry news sources and publications.
Methodology
Step 1 - Identification of Relevant Samples Size from Population Database


Step 2 - Approaches for Defining Global Market Size (Value, Volume* & Price*)

Note*: In applicable scenarios
Step 3 - Data Sources
Primary Research
- Web Analytics
- Survey Reports
- Research Institute
- Latest Research Reports
- Opinion Leaders
Secondary Research
- Annual Reports
- White Paper
- Latest Press Release
- Industry Association
- Paid Database
- Investor Presentations

Step 4 - Data Triangulation
Involves using different sources of information in order to increase the validity of a study
These sources are likely to be stakeholders in a program - participants, other researchers, program staff, other community members, and so on.
Then we put all data in single framework & apply various statistical tools to find out the dynamic on the market.
During the analysis stage, feedback from the stakeholder groups would be compared to determine areas of agreement as well as areas of divergence


