
Key Insights
The Organs-on-Chips (OoC) market is experiencing robust growth, projected to reach a significant market value by 2033. Driven by the increasing demand for advanced drug discovery and toxicology research tools, the market is poised for substantial expansion. The high cost of traditional animal testing and the inherent limitations of 2D cell cultures are major factors pushing the adoption of OoC technology. Pharmaceutical and biotechnology companies are at the forefront of this adoption, utilizing OoC models for preclinical drug testing, efficacy evaluation, and toxicity assessment, resulting in faster and more cost-effective drug development. Academic and research institutions also contribute significantly to market growth by focusing on developing innovative OoC models and expanding their application across various organ systems. The versatility of OoC technology, enabling the simulation of various organ systems like the liver, heart, and lung, contributes to its widespread appeal. Further advancements in microfluidic technology and bioengineering are expected to fuel market expansion by enabling more sophisticated and physiologically relevant OoC models. Specific organ types, like liver models for drug metabolism studies and heart models for cardiovascular research, are driving segment growth. Although challenges remain in terms of model complexity and regulatory approval processes, the inherent advantages of OoC technology in improving drug development efficiency are accelerating market penetration.
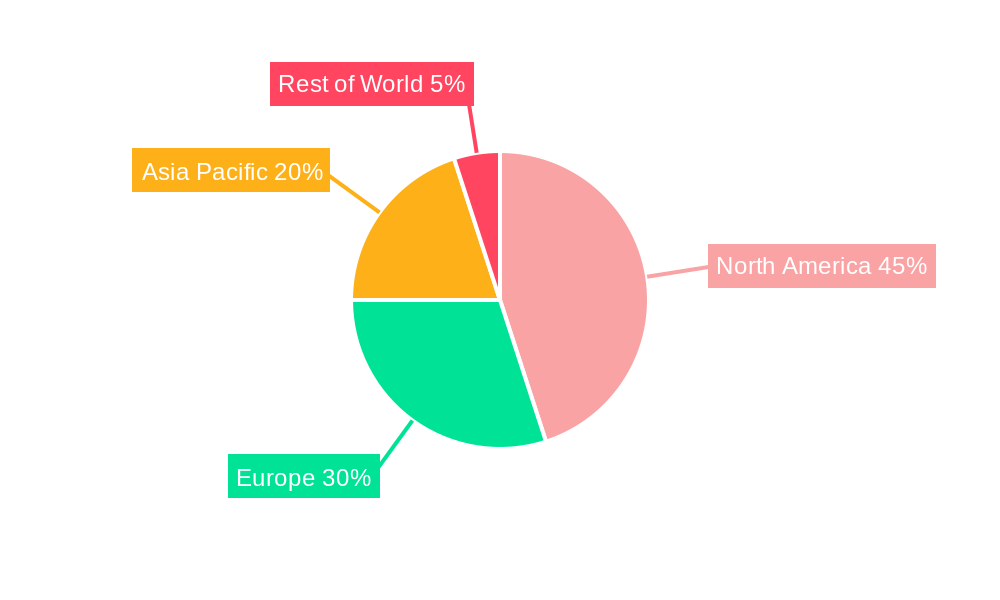
The geographical distribution of the OoC market reveals that North America currently holds a significant market share, driven by extensive research funding and a robust pharmaceutical and biotechnology industry. However, the Asia-Pacific region is expected to witness the fastest growth in the coming years, fueled by increasing healthcare expenditure and growing research activities in countries like China, India, and Japan. Europe also plays a significant role, with strong regulatory support for innovative technologies promoting the adoption of OoC models within the region. The overall growth trajectory is expected to remain strong throughout the forecast period (2025-2033), indicating substantial market opportunities for players involved in developing, manufacturing, and supplying OoC technologies and related services. Competition is likely to intensify as more companies enter the market, leading to innovation and potentially lower prices, making OoC technology more accessible to researchers and companies across various sectors.
Organs-on-Chips Industry Market Report: 2019-2033
This comprehensive report provides a detailed analysis of the Organs-on-Chips (OoC) industry, encompassing market dynamics, growth trends, key players, and future outlook. Covering the period from 2019 to 2033, with a focus on 2025, this report is an essential resource for industry professionals, investors, and researchers seeking to understand and capitalize on the opportunities within this rapidly evolving sector. The report segments the market by application (Drug Discovery, Toxicology Research, Other Applications), end-user (Pharmaceutical and Biotechnology Companies, Academic and Research Institutes, Other End Users), and organ type (Liver, Heart, Lung, Other Organ Types). The total market size is projected to reach xx Million by 2033.
Organs-on-Chips Industry Market Dynamics & Structure
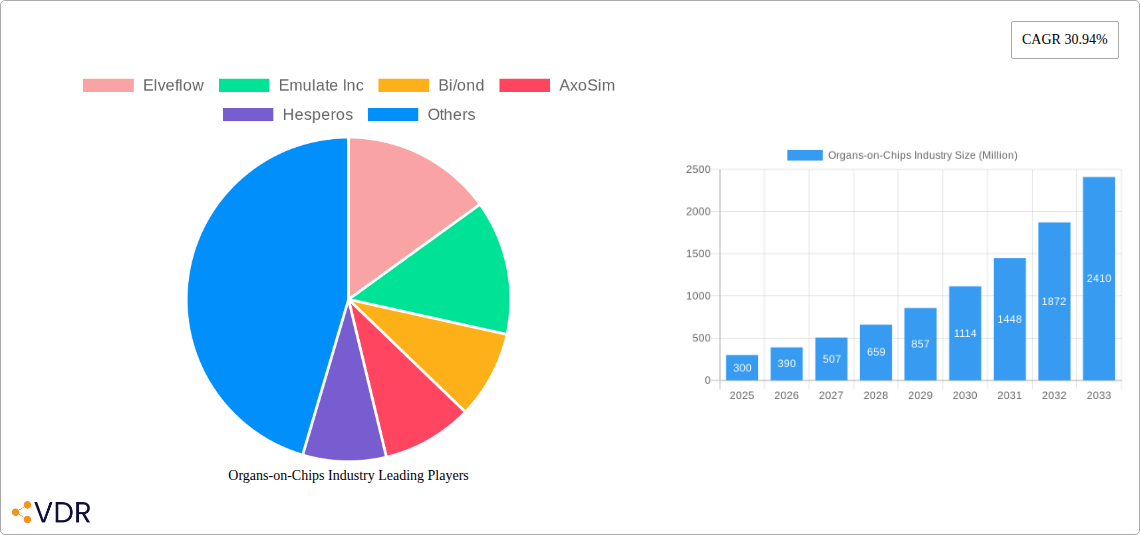
The Organs-on-Chips market is characterized by a moderately fragmented landscape, with several key players competing for market share. The industry is experiencing rapid technological innovation, driven by advancements in microfluidics, bioprinting, and materials science. Regulatory frameworks, while still evolving, are increasingly supportive of OoC technology adoption, particularly in drug development and toxicology research. The market faces competition from traditional in vivo and in vitro testing methods but is gaining traction due to its enhanced predictive capabilities and reduced reliance on animal models. Mergers and acquisitions (M&A) activity is noteworthy, reflecting the strategic importance of this technology and the consolidation occurring within the industry. For example, the acquisition of Tara Biosystems by Valo Health in 2022 signifies the growing importance of OoC in drug development.
- Market Concentration: Moderately fragmented, with no single dominant player.
- Technological Innovation: Rapid advancements in microfluidics, bioprinting, and materials science are driving growth.
- Regulatory Landscape: Evolving but supportive of OoC adoption, particularly in drug development and toxicology.
- Competitive Substitutes: Traditional in vivo and in vitro testing methods.
- End-User Demographics: Primarily pharmaceutical and biotechnology companies, academic and research institutes.
- M&A Trends: Increasing consolidation through acquisitions and partnerships. Deal volume estimated at xx in 2024.
Organs-on-Chips Industry Growth Trends & Insights
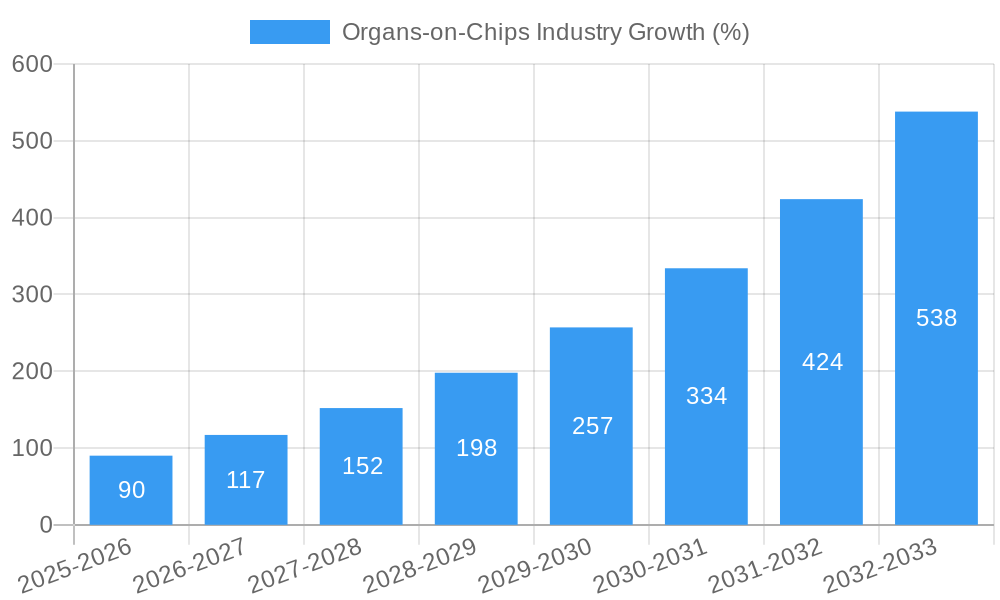
The Organs-on-Chips market is exhibiting robust growth, driven by increasing demand for more efficient and accurate preclinical testing models. The market size, valued at xx Million in 2025, is projected to experience a Compound Annual Growth Rate (CAGR) of xx% during the forecast period (2025-2033). This growth is fueled by several factors, including the rising adoption of OoC technology in drug discovery and toxicology research, the increasing prevalence of chronic diseases, and the growing focus on reducing animal testing. Technological advancements, such as the development of more sophisticated organ-on-a-chip models, are further accelerating market expansion. The shift towards personalized medicine is also a significant driver, with the ability of OoC to model individual patient responses to drugs gaining momentum. Market penetration is expected to increase from xx% in 2025 to xx% by 2033.
Dominant Regions, Countries, or Segments in Organs-on-Chips Industry
North America currently holds the largest market share in the Organs-on-Chips industry, driven by the presence of major pharmaceutical and biotechnology companies, strong research infrastructure, and favorable regulatory environment. Europe follows as a significant market, contributing to substantial growth. Within applications, Drug Discovery is the dominant segment due to the potential to significantly reduce development timelines and costs. Pharmaceutical and Biotechnology Companies represent the largest end-user segment due to their extensive drug development pipelines and willingness to invest in advanced technologies. The Liver organ type is also a prominent segment, owing to its pivotal role in drug metabolism and toxicity studies.
- Key Drivers (North America): Strong presence of pharmaceutical and biotechnology companies, robust research infrastructure, favorable regulatory environment.
- Key Drivers (Europe): Growing investments in research and development, increasing adoption of OoC technology in academic and research institutes.
- Application Segment Dominance: Drug Discovery (due to high cost savings and speed improvement)
- End-User Segment Dominance: Pharmaceutical and Biotechnology Companies (due to high budget and strategic applications)
- Organ Type Dominance: Liver (due to its importance in drug metabolism and toxicity)
Organs-on-Chips Industry Product Landscape
Organs-on-chips represent a significant advancement in preclinical testing, offering more physiologically relevant models compared to traditional methods. These devices incorporate microfluidic channels and engineered tissues to mimic the structure and function of human organs. Recent innovations focus on improving the accuracy and complexity of these models, incorporating features such as immune system components and advanced sensing capabilities. Unique selling propositions include improved predictive power, reduced reliance on animal models, and cost-effectiveness in the long run. Technological advancements include the integration of AI and machine learning for data analysis and model refinement.
Key Drivers, Barriers & Challenges in Organs-on-Chips Industry
Key Drivers:
- Growing demand for more efficient and accurate preclinical testing models.
- Increasing prevalence of chronic diseases requiring advanced drug development tools.
- Stringent regulations on animal testing and growing support for 3Rs (Replacement, Reduction, Refinement) principles.
Challenges:
- High initial investment costs associated with purchasing and maintaining OoC systems.
- Complexity of creating highly realistic and functional organ models.
- Limited standardization and validation of OoC models and testing protocols.
- Competition from traditional in vivo and in vitro testing methods.
Emerging Opportunities in Organs-on-Chips Industry
Emerging opportunities include expanding the application of OoC technology into personalized medicine, disease modeling, and toxicity testing for novel therapeutic modalities. The development of more sophisticated organ-on-a-chip models, incorporating multiple organ systems, holds significant potential. Furthermore, integration with AI and machine learning for data analysis and predictive modeling offers considerable opportunities for improving the efficiency and accuracy of OoC-based research. The development of new models for understudied organs and diseases also presents a significant market potential.
Growth Accelerators in the Organs-on-Chips Industry
Technological breakthroughs, such as the development of more advanced microfluidic devices and biocompatible materials, are accelerating market growth. Strategic partnerships between OoC companies and pharmaceutical giants facilitate rapid adoption and market expansion. Furthermore, government funding and support for research and development further fuel this growth.
Key Players Shaping the Organs-on-Chips Industry Market
- Elveflow
- Emulate Inc
- Bi/ond
- AxoSim
- Hesperos
- MIMETAS BV
- Altis Biosystems
- BiomimX SRL
- Valo Health (Tara Biosystems Inc )
- Netri
- Nortis Inc
- TissUse GmbH
- Allevi Inc
- InSphero
Notable Milestones in Organs-on-Chips Industry Sector
- April 2022: Valo Health acquired TARA Biosystems, expanding its capabilities in cardiovascular disease drug development.
- May 2022: Emulate upgraded its intestinal organ-on-a-chip for inflammatory bowel disease research.
In-Depth Organs-on-Chips Industry Market Outlook
The Organs-on-Chips industry is poised for continued strong growth, driven by technological advancements, increasing adoption in drug development and toxicology research, and a growing focus on personalized medicine. Strategic partnerships and collaborations are expected to play a significant role in driving market expansion. The potential applications of OoC technology extend far beyond the current scope, with opportunities in areas such as disease modeling and personalized therapy selection. This presents significant strategic opportunities for companies to establish themselves as leaders in this transformative field.
Organs-on-Chips Industry Segmentation
-
1. Organ Type
- 1.1. Liver
- 1.2. Heart
- 1.3. Lung
- 1.4. Other Organ Types
-
2. Application
- 2.1. Drug Discovery
- 2.2. Toxicology Research
- 2.3. Other Applications
-
3. End User
- 3.1. Pharmaceutical and Biotechnology Companies
- 3.2. Academic and Research Institutes
- 3.3. Other End Users
Organs-on-Chips Industry Segmentation By Geography
-
1. North America
- 1.1. United States
- 1.2. Canada
- 1.3. Mexico
-
2. Europe
- 2.1. Germany
- 2.2. United Kingdom
- 2.3. France
- 2.4. Italy
- 2.5. Spain
- 2.6. Rest of Europe
-
3. Asia Pacific
- 3.1. China
- 3.2. Japan
- 3.3. India
- 3.4. Australia
- 3.5. South Korea
- 3.6. Rest of Asia Pacific
- 4. Rest of the World
Organs-on-Chips Industry REPORT HIGHLIGHTS
| Aspects | Details |
|---|---|
| Study Period | 2019-2033 |
| Base Year | 2024 |
| Estimated Year | 2025 |
| Forecast Period | 2025-2033 |
| Historical Period | 2019-2024 |
| Growth Rate | CAGR of 30.94% from 2019-2033 |
| Segmentation |
|
Table of Contents
- 1. Introduction
- 1.1. Research Scope
- 1.2. Market Segmentation
- 1.3. Research Methodology
- 1.4. Definitions and Assumptions
- 2. Executive Summary
- 2.1. Introduction
- 3. Market Dynamics
- 3.1. Introduction
- 3.2. Market Drivers
- 3.2.1. Requirement of Alternative for Animal Testing; Need for Early Detection of Drug Toxicity and New Products Launches
- 3.3. Market Restrains
- 3.3.1. Complexity of Organ-on-chip Models
- 3.4. Market Trends
- 3.4.1. Lung-related Application is Expected to Exhibit a Significant Growth Over the Forecast Period
- 4. Market Factor Analysis
- 4.1. Porters Five Forces
- 4.2. Supply/Value Chain
- 4.3. PESTEL analysis
- 4.4. Market Entropy
- 4.5. Patent/Trademark Analysis
- 5. Global Organs-on-Chips Industry Analysis, Insights and Forecast, 2019-2031
- 5.1. Market Analysis, Insights and Forecast - by Organ Type
- 5.1.1. Liver
- 5.1.2. Heart
- 5.1.3. Lung
- 5.1.4. Other Organ Types
- 5.2. Market Analysis, Insights and Forecast - by Application
- 5.2.1. Drug Discovery
- 5.2.2. Toxicology Research
- 5.2.3. Other Applications
- 5.3. Market Analysis, Insights and Forecast - by End User
- 5.3.1. Pharmaceutical and Biotechnology Companies
- 5.3.2. Academic and Research Institutes
- 5.3.3. Other End Users
- 5.4. Market Analysis, Insights and Forecast - by Region
- 5.4.1. North America
- 5.4.2. Europe
- 5.4.3. Asia Pacific
- 5.4.4. Rest of the World
- 5.1. Market Analysis, Insights and Forecast - by Organ Type
- 6. North America Organs-on-Chips Industry Analysis, Insights and Forecast, 2019-2031
- 6.1. Market Analysis, Insights and Forecast - by Organ Type
- 6.1.1. Liver
- 6.1.2. Heart
- 6.1.3. Lung
- 6.1.4. Other Organ Types
- 6.2. Market Analysis, Insights and Forecast - by Application
- 6.2.1. Drug Discovery
- 6.2.2. Toxicology Research
- 6.2.3. Other Applications
- 6.3. Market Analysis, Insights and Forecast - by End User
- 6.3.1. Pharmaceutical and Biotechnology Companies
- 6.3.2. Academic and Research Institutes
- 6.3.3. Other End Users
- 6.1. Market Analysis, Insights and Forecast - by Organ Type
- 7. Europe Organs-on-Chips Industry Analysis, Insights and Forecast, 2019-2031
- 7.1. Market Analysis, Insights and Forecast - by Organ Type
- 7.1.1. Liver
- 7.1.2. Heart
- 7.1.3. Lung
- 7.1.4. Other Organ Types
- 7.2. Market Analysis, Insights and Forecast - by Application
- 7.2.1. Drug Discovery
- 7.2.2. Toxicology Research
- 7.2.3. Other Applications
- 7.3. Market Analysis, Insights and Forecast - by End User
- 7.3.1. Pharmaceutical and Biotechnology Companies
- 7.3.2. Academic and Research Institutes
- 7.3.3. Other End Users
- 7.1. Market Analysis, Insights and Forecast - by Organ Type
- 8. Asia Pacific Organs-on-Chips Industry Analysis, Insights and Forecast, 2019-2031
- 8.1. Market Analysis, Insights and Forecast - by Organ Type
- 8.1.1. Liver
- 8.1.2. Heart
- 8.1.3. Lung
- 8.1.4. Other Organ Types
- 8.2. Market Analysis, Insights and Forecast - by Application
- 8.2.1. Drug Discovery
- 8.2.2. Toxicology Research
- 8.2.3. Other Applications
- 8.3. Market Analysis, Insights and Forecast - by End User
- 8.3.1. Pharmaceutical and Biotechnology Companies
- 8.3.2. Academic and Research Institutes
- 8.3.3. Other End Users
- 8.1. Market Analysis, Insights and Forecast - by Organ Type
- 9. Rest of the World Organs-on-Chips Industry Analysis, Insights and Forecast, 2019-2031
- 9.1. Market Analysis, Insights and Forecast - by Organ Type
- 9.1.1. Liver
- 9.1.2. Heart
- 9.1.3. Lung
- 9.1.4. Other Organ Types
- 9.2. Market Analysis, Insights and Forecast - by Application
- 9.2.1. Drug Discovery
- 9.2.2. Toxicology Research
- 9.2.3. Other Applications
- 9.3. Market Analysis, Insights and Forecast - by End User
- 9.3.1. Pharmaceutical and Biotechnology Companies
- 9.3.2. Academic and Research Institutes
- 9.3.3. Other End Users
- 9.1. Market Analysis, Insights and Forecast - by Organ Type
- 10. North America Organs-on-Chips Industry Analysis, Insights and Forecast, 2019-2031
- 10.1. Market Analysis, Insights and Forecast - By Country/Sub-region
- 10.1.1 United States
- 10.1.2 Canada
- 10.1.3 Mexico
- 11. Europe Organs-on-Chips Industry Analysis, Insights and Forecast, 2019-2031
- 11.1. Market Analysis, Insights and Forecast - By Country/Sub-region
- 11.1.1 Germany
- 11.1.2 United Kingdom
- 11.1.3 France
- 11.1.4 Spain
- 11.1.5 Italy
- 11.1.6 Spain
- 11.1.7 Belgium
- 11.1.8 Netherland
- 11.1.9 Nordics
- 11.1.10 Rest of Europe
- 12. Asia Pacific Organs-on-Chips Industry Analysis, Insights and Forecast, 2019-2031
- 12.1. Market Analysis, Insights and Forecast - By Country/Sub-region
- 12.1.1 China
- 12.1.2 Japan
- 12.1.3 India
- 12.1.4 South Korea
- 12.1.5 Southeast Asia
- 12.1.6 Australia
- 12.1.7 Indonesia
- 12.1.8 Phillipes
- 12.1.9 Singapore
- 12.1.10 Thailandc
- 12.1.11 Rest of Asia Pacific
- 13. South America Organs-on-Chips Industry Analysis, Insights and Forecast, 2019-2031
- 13.1. Market Analysis, Insights and Forecast - By Country/Sub-region
- 13.1.1 Brazil
- 13.1.2 Argentina
- 13.1.3 Peru
- 13.1.4 Chile
- 13.1.5 Colombia
- 13.1.6 Ecuador
- 13.1.7 Venezuela
- 13.1.8 Rest of South America
- 14. North America Organs-on-Chips Industry Analysis, Insights and Forecast, 2019-2031
- 14.1. Market Analysis, Insights and Forecast - By Country/Sub-region
- 14.1.1 United States
- 14.1.2 Canada
- 14.1.3 Mexico
- 15. MEA Organs-on-Chips Industry Analysis, Insights and Forecast, 2019-2031
- 15.1. Market Analysis, Insights and Forecast - By Country/Sub-region
- 15.1.1 United Arab Emirates
- 15.1.2 Saudi Arabia
- 15.1.3 South Africa
- 15.1.4 Rest of Middle East and Africa
- 16. Competitive Analysis
- 16.1. Global Market Share Analysis 2024
- 16.2. Company Profiles
- 16.2.1 Elveflow
- 16.2.1.1. Overview
- 16.2.1.2. Products
- 16.2.1.3. SWOT Analysis
- 16.2.1.4. Recent Developments
- 16.2.1.5. Financials (Based on Availability)
- 16.2.2 Emulate Inc
- 16.2.2.1. Overview
- 16.2.2.2. Products
- 16.2.2.3. SWOT Analysis
- 16.2.2.4. Recent Developments
- 16.2.2.5. Financials (Based on Availability)
- 16.2.3 Bi/ond
- 16.2.3.1. Overview
- 16.2.3.2. Products
- 16.2.3.3. SWOT Analysis
- 16.2.3.4. Recent Developments
- 16.2.3.5. Financials (Based on Availability)
- 16.2.4 AxoSim
- 16.2.4.1. Overview
- 16.2.4.2. Products
- 16.2.4.3. SWOT Analysis
- 16.2.4.4. Recent Developments
- 16.2.4.5. Financials (Based on Availability)
- 16.2.5 Hesperos
- 16.2.5.1. Overview
- 16.2.5.2. Products
- 16.2.5.3. SWOT Analysis
- 16.2.5.4. Recent Developments
- 16.2.5.5. Financials (Based on Availability)
- 16.2.6 MIMETAS BV
- 16.2.6.1. Overview
- 16.2.6.2. Products
- 16.2.6.3. SWOT Analysis
- 16.2.6.4. Recent Developments
- 16.2.6.5. Financials (Based on Availability)
- 16.2.7 Altis Biosystems
- 16.2.7.1. Overview
- 16.2.7.2. Products
- 16.2.7.3. SWOT Analysis
- 16.2.7.4. Recent Developments
- 16.2.7.5. Financials (Based on Availability)
- 16.2.8 BiomimX SRL
- 16.2.8.1. Overview
- 16.2.8.2. Products
- 16.2.8.3. SWOT Analysis
- 16.2.8.4. Recent Developments
- 16.2.8.5. Financials (Based on Availability)
- 16.2.9 Valo Health (Tara Biosystems Inc )
- 16.2.9.1. Overview
- 16.2.9.2. Products
- 16.2.9.3. SWOT Analysis
- 16.2.9.4. Recent Developments
- 16.2.9.5. Financials (Based on Availability)
- 16.2.10 Netri
- 16.2.10.1. Overview
- 16.2.10.2. Products
- 16.2.10.3. SWOT Analysis
- 16.2.10.4. Recent Developments
- 16.2.10.5. Financials (Based on Availability)
- 16.2.11 Nortis Inc
- 16.2.11.1. Overview
- 16.2.11.2. Products
- 16.2.11.3. SWOT Analysis
- 16.2.11.4. Recent Developments
- 16.2.11.5. Financials (Based on Availability)
- 16.2.12 TissUse GmbH
- 16.2.12.1. Overview
- 16.2.12.2. Products
- 16.2.12.3. SWOT Analysis
- 16.2.12.4. Recent Developments
- 16.2.12.5. Financials (Based on Availability)
- 16.2.13 Allevi Inc
- 16.2.13.1. Overview
- 16.2.13.2. Products
- 16.2.13.3. SWOT Analysis
- 16.2.13.4. Recent Developments
- 16.2.13.5. Financials (Based on Availability)
- 16.2.14 InSphero
- 16.2.14.1. Overview
- 16.2.14.2. Products
- 16.2.14.3. SWOT Analysis
- 16.2.14.4. Recent Developments
- 16.2.14.5. Financials (Based on Availability)
- 16.2.1 Elveflow
List of Figures
- Figure 1: Global Organs-on-Chips Industry Revenue Breakdown (Million, %) by Region 2024 & 2032
- Figure 2: Global Organs-on-Chips Industry Volume Breakdown (K Unit, %) by Region 2024 & 2032
- Figure 3: North America Organs-on-Chips Industry Revenue (Million), by Country 2024 & 2032
- Figure 4: North America Organs-on-Chips Industry Volume (K Unit), by Country 2024 & 2032
- Figure 5: North America Organs-on-Chips Industry Revenue Share (%), by Country 2024 & 2032
- Figure 6: North America Organs-on-Chips Industry Volume Share (%), by Country 2024 & 2032
- Figure 7: Europe Organs-on-Chips Industry Revenue (Million), by Country 2024 & 2032
- Figure 8: Europe Organs-on-Chips Industry Volume (K Unit), by Country 2024 & 2032
- Figure 9: Europe Organs-on-Chips Industry Revenue Share (%), by Country 2024 & 2032
- Figure 10: Europe Organs-on-Chips Industry Volume Share (%), by Country 2024 & 2032
- Figure 11: Asia Pacific Organs-on-Chips Industry Revenue (Million), by Country 2024 & 2032
- Figure 12: Asia Pacific Organs-on-Chips Industry Volume (K Unit), by Country 2024 & 2032
- Figure 13: Asia Pacific Organs-on-Chips Industry Revenue Share (%), by Country 2024 & 2032
- Figure 14: Asia Pacific Organs-on-Chips Industry Volume Share (%), by Country 2024 & 2032
- Figure 15: South America Organs-on-Chips Industry Revenue (Million), by Country 2024 & 2032
- Figure 16: South America Organs-on-Chips Industry Volume (K Unit), by Country 2024 & 2032
- Figure 17: South America Organs-on-Chips Industry Revenue Share (%), by Country 2024 & 2032
- Figure 18: South America Organs-on-Chips Industry Volume Share (%), by Country 2024 & 2032
- Figure 19: North America Organs-on-Chips Industry Revenue (Million), by Country 2024 & 2032
- Figure 20: North America Organs-on-Chips Industry Volume (K Unit), by Country 2024 & 2032
- Figure 21: North America Organs-on-Chips Industry Revenue Share (%), by Country 2024 & 2032
- Figure 22: North America Organs-on-Chips Industry Volume Share (%), by Country 2024 & 2032
- Figure 23: MEA Organs-on-Chips Industry Revenue (Million), by Country 2024 & 2032
- Figure 24: MEA Organs-on-Chips Industry Volume (K Unit), by Country 2024 & 2032
- Figure 25: MEA Organs-on-Chips Industry Revenue Share (%), by Country 2024 & 2032
- Figure 26: MEA Organs-on-Chips Industry Volume Share (%), by Country 2024 & 2032
- Figure 27: North America Organs-on-Chips Industry Revenue (Million), by Organ Type 2024 & 2032
- Figure 28: North America Organs-on-Chips Industry Volume (K Unit), by Organ Type 2024 & 2032
- Figure 29: North America Organs-on-Chips Industry Revenue Share (%), by Organ Type 2024 & 2032
- Figure 30: North America Organs-on-Chips Industry Volume Share (%), by Organ Type 2024 & 2032
- Figure 31: North America Organs-on-Chips Industry Revenue (Million), by Application 2024 & 2032
- Figure 32: North America Organs-on-Chips Industry Volume (K Unit), by Application 2024 & 2032
- Figure 33: North America Organs-on-Chips Industry Revenue Share (%), by Application 2024 & 2032
- Figure 34: North America Organs-on-Chips Industry Volume Share (%), by Application 2024 & 2032
- Figure 35: North America Organs-on-Chips Industry Revenue (Million), by End User 2024 & 2032
- Figure 36: North America Organs-on-Chips Industry Volume (K Unit), by End User 2024 & 2032
- Figure 37: North America Organs-on-Chips Industry Revenue Share (%), by End User 2024 & 2032
- Figure 38: North America Organs-on-Chips Industry Volume Share (%), by End User 2024 & 2032
- Figure 39: North America Organs-on-Chips Industry Revenue (Million), by Country 2024 & 2032
- Figure 40: North America Organs-on-Chips Industry Volume (K Unit), by Country 2024 & 2032
- Figure 41: North America Organs-on-Chips Industry Revenue Share (%), by Country 2024 & 2032
- Figure 42: North America Organs-on-Chips Industry Volume Share (%), by Country 2024 & 2032
- Figure 43: Europe Organs-on-Chips Industry Revenue (Million), by Organ Type 2024 & 2032
- Figure 44: Europe Organs-on-Chips Industry Volume (K Unit), by Organ Type 2024 & 2032
- Figure 45: Europe Organs-on-Chips Industry Revenue Share (%), by Organ Type 2024 & 2032
- Figure 46: Europe Organs-on-Chips Industry Volume Share (%), by Organ Type 2024 & 2032
- Figure 47: Europe Organs-on-Chips Industry Revenue (Million), by Application 2024 & 2032
- Figure 48: Europe Organs-on-Chips Industry Volume (K Unit), by Application 2024 & 2032
- Figure 49: Europe Organs-on-Chips Industry Revenue Share (%), by Application 2024 & 2032
- Figure 50: Europe Organs-on-Chips Industry Volume Share (%), by Application 2024 & 2032
- Figure 51: Europe Organs-on-Chips Industry Revenue (Million), by End User 2024 & 2032
- Figure 52: Europe Organs-on-Chips Industry Volume (K Unit), by End User 2024 & 2032
- Figure 53: Europe Organs-on-Chips Industry Revenue Share (%), by End User 2024 & 2032
- Figure 54: Europe Organs-on-Chips Industry Volume Share (%), by End User 2024 & 2032
- Figure 55: Europe Organs-on-Chips Industry Revenue (Million), by Country 2024 & 2032
- Figure 56: Europe Organs-on-Chips Industry Volume (K Unit), by Country 2024 & 2032
- Figure 57: Europe Organs-on-Chips Industry Revenue Share (%), by Country 2024 & 2032
- Figure 58: Europe Organs-on-Chips Industry Volume Share (%), by Country 2024 & 2032
- Figure 59: Asia Pacific Organs-on-Chips Industry Revenue (Million), by Organ Type 2024 & 2032
- Figure 60: Asia Pacific Organs-on-Chips Industry Volume (K Unit), by Organ Type 2024 & 2032
- Figure 61: Asia Pacific Organs-on-Chips Industry Revenue Share (%), by Organ Type 2024 & 2032
- Figure 62: Asia Pacific Organs-on-Chips Industry Volume Share (%), by Organ Type 2024 & 2032
- Figure 63: Asia Pacific Organs-on-Chips Industry Revenue (Million), by Application 2024 & 2032
- Figure 64: Asia Pacific Organs-on-Chips Industry Volume (K Unit), by Application 2024 & 2032
- Figure 65: Asia Pacific Organs-on-Chips Industry Revenue Share (%), by Application 2024 & 2032
- Figure 66: Asia Pacific Organs-on-Chips Industry Volume Share (%), by Application 2024 & 2032
- Figure 67: Asia Pacific Organs-on-Chips Industry Revenue (Million), by End User 2024 & 2032
- Figure 68: Asia Pacific Organs-on-Chips Industry Volume (K Unit), by End User 2024 & 2032
- Figure 69: Asia Pacific Organs-on-Chips Industry Revenue Share (%), by End User 2024 & 2032
- Figure 70: Asia Pacific Organs-on-Chips Industry Volume Share (%), by End User 2024 & 2032
- Figure 71: Asia Pacific Organs-on-Chips Industry Revenue (Million), by Country 2024 & 2032
- Figure 72: Asia Pacific Organs-on-Chips Industry Volume (K Unit), by Country 2024 & 2032
- Figure 73: Asia Pacific Organs-on-Chips Industry Revenue Share (%), by Country 2024 & 2032
- Figure 74: Asia Pacific Organs-on-Chips Industry Volume Share (%), by Country 2024 & 2032
- Figure 75: Rest of the World Organs-on-Chips Industry Revenue (Million), by Organ Type 2024 & 2032
- Figure 76: Rest of the World Organs-on-Chips Industry Volume (K Unit), by Organ Type 2024 & 2032
- Figure 77: Rest of the World Organs-on-Chips Industry Revenue Share (%), by Organ Type 2024 & 2032
- Figure 78: Rest of the World Organs-on-Chips Industry Volume Share (%), by Organ Type 2024 & 2032
- Figure 79: Rest of the World Organs-on-Chips Industry Revenue (Million), by Application 2024 & 2032
- Figure 80: Rest of the World Organs-on-Chips Industry Volume (K Unit), by Application 2024 & 2032
- Figure 81: Rest of the World Organs-on-Chips Industry Revenue Share (%), by Application 2024 & 2032
- Figure 82: Rest of the World Organs-on-Chips Industry Volume Share (%), by Application 2024 & 2032
- Figure 83: Rest of the World Organs-on-Chips Industry Revenue (Million), by End User 2024 & 2032
- Figure 84: Rest of the World Organs-on-Chips Industry Volume (K Unit), by End User 2024 & 2032
- Figure 85: Rest of the World Organs-on-Chips Industry Revenue Share (%), by End User 2024 & 2032
- Figure 86: Rest of the World Organs-on-Chips Industry Volume Share (%), by End User 2024 & 2032
- Figure 87: Rest of the World Organs-on-Chips Industry Revenue (Million), by Country 2024 & 2032
- Figure 88: Rest of the World Organs-on-Chips Industry Volume (K Unit), by Country 2024 & 2032
- Figure 89: Rest of the World Organs-on-Chips Industry Revenue Share (%), by Country 2024 & 2032
- Figure 90: Rest of the World Organs-on-Chips Industry Volume Share (%), by Country 2024 & 2032
List of Tables
- Table 1: Global Organs-on-Chips Industry Revenue Million Forecast, by Region 2019 & 2032
- Table 2: Global Organs-on-Chips Industry Volume K Unit Forecast, by Region 2019 & 2032
- Table 3: Global Organs-on-Chips Industry Revenue Million Forecast, by Organ Type 2019 & 2032
- Table 4: Global Organs-on-Chips Industry Volume K Unit Forecast, by Organ Type 2019 & 2032
- Table 5: Global Organs-on-Chips Industry Revenue Million Forecast, by Application 2019 & 2032
- Table 6: Global Organs-on-Chips Industry Volume K Unit Forecast, by Application 2019 & 2032
- Table 7: Global Organs-on-Chips Industry Revenue Million Forecast, by End User 2019 & 2032
- Table 8: Global Organs-on-Chips Industry Volume K Unit Forecast, by End User 2019 & 2032
- Table 9: Global Organs-on-Chips Industry Revenue Million Forecast, by Region 2019 & 2032
- Table 10: Global Organs-on-Chips Industry Volume K Unit Forecast, by Region 2019 & 2032
- Table 11: Global Organs-on-Chips Industry Revenue Million Forecast, by Country 2019 & 2032
- Table 12: Global Organs-on-Chips Industry Volume K Unit Forecast, by Country 2019 & 2032
- Table 13: United States Organs-on-Chips Industry Revenue (Million) Forecast, by Application 2019 & 2032
- Table 14: United States Organs-on-Chips Industry Volume (K Unit) Forecast, by Application 2019 & 2032
- Table 15: Canada Organs-on-Chips Industry Revenue (Million) Forecast, by Application 2019 & 2032
- Table 16: Canada Organs-on-Chips Industry Volume (K Unit) Forecast, by Application 2019 & 2032
- Table 17: Mexico Organs-on-Chips Industry Revenue (Million) Forecast, by Application 2019 & 2032
- Table 18: Mexico Organs-on-Chips Industry Volume (K Unit) Forecast, by Application 2019 & 2032
- Table 19: Global Organs-on-Chips Industry Revenue Million Forecast, by Country 2019 & 2032
- Table 20: Global Organs-on-Chips Industry Volume K Unit Forecast, by Country 2019 & 2032
- Table 21: Germany Organs-on-Chips Industry Revenue (Million) Forecast, by Application 2019 & 2032
- Table 22: Germany Organs-on-Chips Industry Volume (K Unit) Forecast, by Application 2019 & 2032
- Table 23: United Kingdom Organs-on-Chips Industry Revenue (Million) Forecast, by Application 2019 & 2032
- Table 24: United Kingdom Organs-on-Chips Industry Volume (K Unit) Forecast, by Application 2019 & 2032
- Table 25: France Organs-on-Chips Industry Revenue (Million) Forecast, by Application 2019 & 2032
- Table 26: France Organs-on-Chips Industry Volume (K Unit) Forecast, by Application 2019 & 2032
- Table 27: Spain Organs-on-Chips Industry Revenue (Million) Forecast, by Application 2019 & 2032
- Table 28: Spain Organs-on-Chips Industry Volume (K Unit) Forecast, by Application 2019 & 2032
- Table 29: Italy Organs-on-Chips Industry Revenue (Million) Forecast, by Application 2019 & 2032
- Table 30: Italy Organs-on-Chips Industry Volume (K Unit) Forecast, by Application 2019 & 2032
- Table 31: Spain Organs-on-Chips Industry Revenue (Million) Forecast, by Application 2019 & 2032
- Table 32: Spain Organs-on-Chips Industry Volume (K Unit) Forecast, by Application 2019 & 2032
- Table 33: Belgium Organs-on-Chips Industry Revenue (Million) Forecast, by Application 2019 & 2032
- Table 34: Belgium Organs-on-Chips Industry Volume (K Unit) Forecast, by Application 2019 & 2032
- Table 35: Netherland Organs-on-Chips Industry Revenue (Million) Forecast, by Application 2019 & 2032
- Table 36: Netherland Organs-on-Chips Industry Volume (K Unit) Forecast, by Application 2019 & 2032
- Table 37: Nordics Organs-on-Chips Industry Revenue (Million) Forecast, by Application 2019 & 2032
- Table 38: Nordics Organs-on-Chips Industry Volume (K Unit) Forecast, by Application 2019 & 2032
- Table 39: Rest of Europe Organs-on-Chips Industry Revenue (Million) Forecast, by Application 2019 & 2032
- Table 40: Rest of Europe Organs-on-Chips Industry Volume (K Unit) Forecast, by Application 2019 & 2032
- Table 41: Global Organs-on-Chips Industry Revenue Million Forecast, by Country 2019 & 2032
- Table 42: Global Organs-on-Chips Industry Volume K Unit Forecast, by Country 2019 & 2032
- Table 43: China Organs-on-Chips Industry Revenue (Million) Forecast, by Application 2019 & 2032
- Table 44: China Organs-on-Chips Industry Volume (K Unit) Forecast, by Application 2019 & 2032
- Table 45: Japan Organs-on-Chips Industry Revenue (Million) Forecast, by Application 2019 & 2032
- Table 46: Japan Organs-on-Chips Industry Volume (K Unit) Forecast, by Application 2019 & 2032
- Table 47: India Organs-on-Chips Industry Revenue (Million) Forecast, by Application 2019 & 2032
- Table 48: India Organs-on-Chips Industry Volume (K Unit) Forecast, by Application 2019 & 2032
- Table 49: South Korea Organs-on-Chips Industry Revenue (Million) Forecast, by Application 2019 & 2032
- Table 50: South Korea Organs-on-Chips Industry Volume (K Unit) Forecast, by Application 2019 & 2032
- Table 51: Southeast Asia Organs-on-Chips Industry Revenue (Million) Forecast, by Application 2019 & 2032
- Table 52: Southeast Asia Organs-on-Chips Industry Volume (K Unit) Forecast, by Application 2019 & 2032
- Table 53: Australia Organs-on-Chips Industry Revenue (Million) Forecast, by Application 2019 & 2032
- Table 54: Australia Organs-on-Chips Industry Volume (K Unit) Forecast, by Application 2019 & 2032
- Table 55: Indonesia Organs-on-Chips Industry Revenue (Million) Forecast, by Application 2019 & 2032
- Table 56: Indonesia Organs-on-Chips Industry Volume (K Unit) Forecast, by Application 2019 & 2032
- Table 57: Phillipes Organs-on-Chips Industry Revenue (Million) Forecast, by Application 2019 & 2032
- Table 58: Phillipes Organs-on-Chips Industry Volume (K Unit) Forecast, by Application 2019 & 2032
- Table 59: Singapore Organs-on-Chips Industry Revenue (Million) Forecast, by Application 2019 & 2032
- Table 60: Singapore Organs-on-Chips Industry Volume (K Unit) Forecast, by Application 2019 & 2032
- Table 61: Thailandc Organs-on-Chips Industry Revenue (Million) Forecast, by Application 2019 & 2032
- Table 62: Thailandc Organs-on-Chips Industry Volume (K Unit) Forecast, by Application 2019 & 2032
- Table 63: Rest of Asia Pacific Organs-on-Chips Industry Revenue (Million) Forecast, by Application 2019 & 2032
- Table 64: Rest of Asia Pacific Organs-on-Chips Industry Volume (K Unit) Forecast, by Application 2019 & 2032
- Table 65: Global Organs-on-Chips Industry Revenue Million Forecast, by Country 2019 & 2032
- Table 66: Global Organs-on-Chips Industry Volume K Unit Forecast, by Country 2019 & 2032
- Table 67: Brazil Organs-on-Chips Industry Revenue (Million) Forecast, by Application 2019 & 2032
- Table 68: Brazil Organs-on-Chips Industry Volume (K Unit) Forecast, by Application 2019 & 2032
- Table 69: Argentina Organs-on-Chips Industry Revenue (Million) Forecast, by Application 2019 & 2032
- Table 70: Argentina Organs-on-Chips Industry Volume (K Unit) Forecast, by Application 2019 & 2032
- Table 71: Peru Organs-on-Chips Industry Revenue (Million) Forecast, by Application 2019 & 2032
- Table 72: Peru Organs-on-Chips Industry Volume (K Unit) Forecast, by Application 2019 & 2032
- Table 73: Chile Organs-on-Chips Industry Revenue (Million) Forecast, by Application 2019 & 2032
- Table 74: Chile Organs-on-Chips Industry Volume (K Unit) Forecast, by Application 2019 & 2032
- Table 75: Colombia Organs-on-Chips Industry Revenue (Million) Forecast, by Application 2019 & 2032
- Table 76: Colombia Organs-on-Chips Industry Volume (K Unit) Forecast, by Application 2019 & 2032
- Table 77: Ecuador Organs-on-Chips Industry Revenue (Million) Forecast, by Application 2019 & 2032
- Table 78: Ecuador Organs-on-Chips Industry Volume (K Unit) Forecast, by Application 2019 & 2032
- Table 79: Venezuela Organs-on-Chips Industry Revenue (Million) Forecast, by Application 2019 & 2032
- Table 80: Venezuela Organs-on-Chips Industry Volume (K Unit) Forecast, by Application 2019 & 2032
- Table 81: Rest of South America Organs-on-Chips Industry Revenue (Million) Forecast, by Application 2019 & 2032
- Table 82: Rest of South America Organs-on-Chips Industry Volume (K Unit) Forecast, by Application 2019 & 2032
- Table 83: Global Organs-on-Chips Industry Revenue Million Forecast, by Country 2019 & 2032
- Table 84: Global Organs-on-Chips Industry Volume K Unit Forecast, by Country 2019 & 2032
- Table 85: United States Organs-on-Chips Industry Revenue (Million) Forecast, by Application 2019 & 2032
- Table 86: United States Organs-on-Chips Industry Volume (K Unit) Forecast, by Application 2019 & 2032
- Table 87: Canada Organs-on-Chips Industry Revenue (Million) Forecast, by Application 2019 & 2032
- Table 88: Canada Organs-on-Chips Industry Volume (K Unit) Forecast, by Application 2019 & 2032
- Table 89: Mexico Organs-on-Chips Industry Revenue (Million) Forecast, by Application 2019 & 2032
- Table 90: Mexico Organs-on-Chips Industry Volume (K Unit) Forecast, by Application 2019 & 2032
- Table 91: Global Organs-on-Chips Industry Revenue Million Forecast, by Country 2019 & 2032
- Table 92: Global Organs-on-Chips Industry Volume K Unit Forecast, by Country 2019 & 2032
- Table 93: United Arab Emirates Organs-on-Chips Industry Revenue (Million) Forecast, by Application 2019 & 2032
- Table 94: United Arab Emirates Organs-on-Chips Industry Volume (K Unit) Forecast, by Application 2019 & 2032
- Table 95: Saudi Arabia Organs-on-Chips Industry Revenue (Million) Forecast, by Application 2019 & 2032
- Table 96: Saudi Arabia Organs-on-Chips Industry Volume (K Unit) Forecast, by Application 2019 & 2032
- Table 97: South Africa Organs-on-Chips Industry Revenue (Million) Forecast, by Application 2019 & 2032
- Table 98: South Africa Organs-on-Chips Industry Volume (K Unit) Forecast, by Application 2019 & 2032
- Table 99: Rest of Middle East and Africa Organs-on-Chips Industry Revenue (Million) Forecast, by Application 2019 & 2032
- Table 100: Rest of Middle East and Africa Organs-on-Chips Industry Volume (K Unit) Forecast, by Application 2019 & 2032
- Table 101: Global Organs-on-Chips Industry Revenue Million Forecast, by Organ Type 2019 & 2032
- Table 102: Global Organs-on-Chips Industry Volume K Unit Forecast, by Organ Type 2019 & 2032
- Table 103: Global Organs-on-Chips Industry Revenue Million Forecast, by Application 2019 & 2032
- Table 104: Global Organs-on-Chips Industry Volume K Unit Forecast, by Application 2019 & 2032
- Table 105: Global Organs-on-Chips Industry Revenue Million Forecast, by End User 2019 & 2032
- Table 106: Global Organs-on-Chips Industry Volume K Unit Forecast, by End User 2019 & 2032
- Table 107: Global Organs-on-Chips Industry Revenue Million Forecast, by Country 2019 & 2032
- Table 108: Global Organs-on-Chips Industry Volume K Unit Forecast, by Country 2019 & 2032
- Table 109: United States Organs-on-Chips Industry Revenue (Million) Forecast, by Application 2019 & 2032
- Table 110: United States Organs-on-Chips Industry Volume (K Unit) Forecast, by Application 2019 & 2032
- Table 111: Canada Organs-on-Chips Industry Revenue (Million) Forecast, by Application 2019 & 2032
- Table 112: Canada Organs-on-Chips Industry Volume (K Unit) Forecast, by Application 2019 & 2032
- Table 113: Mexico Organs-on-Chips Industry Revenue (Million) Forecast, by Application 2019 & 2032
- Table 114: Mexico Organs-on-Chips Industry Volume (K Unit) Forecast, by Application 2019 & 2032
- Table 115: Global Organs-on-Chips Industry Revenue Million Forecast, by Organ Type 2019 & 2032
- Table 116: Global Organs-on-Chips Industry Volume K Unit Forecast, by Organ Type 2019 & 2032
- Table 117: Global Organs-on-Chips Industry Revenue Million Forecast, by Application 2019 & 2032
- Table 118: Global Organs-on-Chips Industry Volume K Unit Forecast, by Application 2019 & 2032
- Table 119: Global Organs-on-Chips Industry Revenue Million Forecast, by End User 2019 & 2032
- Table 120: Global Organs-on-Chips Industry Volume K Unit Forecast, by End User 2019 & 2032
- Table 121: Global Organs-on-Chips Industry Revenue Million Forecast, by Country 2019 & 2032
- Table 122: Global Organs-on-Chips Industry Volume K Unit Forecast, by Country 2019 & 2032
- Table 123: Germany Organs-on-Chips Industry Revenue (Million) Forecast, by Application 2019 & 2032
- Table 124: Germany Organs-on-Chips Industry Volume (K Unit) Forecast, by Application 2019 & 2032
- Table 125: United Kingdom Organs-on-Chips Industry Revenue (Million) Forecast, by Application 2019 & 2032
- Table 126: United Kingdom Organs-on-Chips Industry Volume (K Unit) Forecast, by Application 2019 & 2032
- Table 127: France Organs-on-Chips Industry Revenue (Million) Forecast, by Application 2019 & 2032
- Table 128: France Organs-on-Chips Industry Volume (K Unit) Forecast, by Application 2019 & 2032
- Table 129: Italy Organs-on-Chips Industry Revenue (Million) Forecast, by Application 2019 & 2032
- Table 130: Italy Organs-on-Chips Industry Volume (K Unit) Forecast, by Application 2019 & 2032
- Table 131: Spain Organs-on-Chips Industry Revenue (Million) Forecast, by Application 2019 & 2032
- Table 132: Spain Organs-on-Chips Industry Volume (K Unit) Forecast, by Application 2019 & 2032
- Table 133: Rest of Europe Organs-on-Chips Industry Revenue (Million) Forecast, by Application 2019 & 2032
- Table 134: Rest of Europe Organs-on-Chips Industry Volume (K Unit) Forecast, by Application 2019 & 2032
- Table 135: Global Organs-on-Chips Industry Revenue Million Forecast, by Organ Type 2019 & 2032
- Table 136: Global Organs-on-Chips Industry Volume K Unit Forecast, by Organ Type 2019 & 2032
- Table 137: Global Organs-on-Chips Industry Revenue Million Forecast, by Application 2019 & 2032
- Table 138: Global Organs-on-Chips Industry Volume K Unit Forecast, by Application 2019 & 2032
- Table 139: Global Organs-on-Chips Industry Revenue Million Forecast, by End User 2019 & 2032
- Table 140: Global Organs-on-Chips Industry Volume K Unit Forecast, by End User 2019 & 2032
- Table 141: Global Organs-on-Chips Industry Revenue Million Forecast, by Country 2019 & 2032
- Table 142: Global Organs-on-Chips Industry Volume K Unit Forecast, by Country 2019 & 2032
- Table 143: China Organs-on-Chips Industry Revenue (Million) Forecast, by Application 2019 & 2032
- Table 144: China Organs-on-Chips Industry Volume (K Unit) Forecast, by Application 2019 & 2032
- Table 145: Japan Organs-on-Chips Industry Revenue (Million) Forecast, by Application 2019 & 2032
- Table 146: Japan Organs-on-Chips Industry Volume (K Unit) Forecast, by Application 2019 & 2032
- Table 147: India Organs-on-Chips Industry Revenue (Million) Forecast, by Application 2019 & 2032
- Table 148: India Organs-on-Chips Industry Volume (K Unit) Forecast, by Application 2019 & 2032
- Table 149: Australia Organs-on-Chips Industry Revenue (Million) Forecast, by Application 2019 & 2032
- Table 150: Australia Organs-on-Chips Industry Volume (K Unit) Forecast, by Application 2019 & 2032
- Table 151: South Korea Organs-on-Chips Industry Revenue (Million) Forecast, by Application 2019 & 2032
- Table 152: South Korea Organs-on-Chips Industry Volume (K Unit) Forecast, by Application 2019 & 2032
- Table 153: Rest of Asia Pacific Organs-on-Chips Industry Revenue (Million) Forecast, by Application 2019 & 2032
- Table 154: Rest of Asia Pacific Organs-on-Chips Industry Volume (K Unit) Forecast, by Application 2019 & 2032
- Table 155: Global Organs-on-Chips Industry Revenue Million Forecast, by Organ Type 2019 & 2032
- Table 156: Global Organs-on-Chips Industry Volume K Unit Forecast, by Organ Type 2019 & 2032
- Table 157: Global Organs-on-Chips Industry Revenue Million Forecast, by Application 2019 & 2032
- Table 158: Global Organs-on-Chips Industry Volume K Unit Forecast, by Application 2019 & 2032
- Table 159: Global Organs-on-Chips Industry Revenue Million Forecast, by End User 2019 & 2032
- Table 160: Global Organs-on-Chips Industry Volume K Unit Forecast, by End User 2019 & 2032
- Table 161: Global Organs-on-Chips Industry Revenue Million Forecast, by Country 2019 & 2032
- Table 162: Global Organs-on-Chips Industry Volume K Unit Forecast, by Country 2019 & 2032
Frequently Asked Questions
1. What is the projected Compound Annual Growth Rate (CAGR) of the Organs-on-Chips Industry?
The projected CAGR is approximately 30.94%.
2. Which companies are prominent players in the Organs-on-Chips Industry?
Key companies in the market include Elveflow, Emulate Inc, Bi/ond, AxoSim, Hesperos, MIMETAS BV, Altis Biosystems, BiomimX SRL, Valo Health (Tara Biosystems Inc ), Netri, Nortis Inc, TissUse GmbH, Allevi Inc, InSphero.
3. What are the main segments of the Organs-on-Chips Industry?
The market segments include Organ Type, Application, End User.
4. Can you provide details about the market size?
The market size is estimated to be USD 0.3 Million as of 2022.
5. What are some drivers contributing to market growth?
Requirement of Alternative for Animal Testing; Need for Early Detection of Drug Toxicity and New Products Launches.
6. What are the notable trends driving market growth?
Lung-related Application is Expected to Exhibit a Significant Growth Over the Forecast Period.
7. Are there any restraints impacting market growth?
Complexity of Organ-on-chip Models.
8. Can you provide examples of recent developments in the market?
May 2022 : Emulate upgraded its intestinal organ-on-a-chip for researchers studying inflammatory bowel disease.
9. What pricing options are available for accessing the report?
Pricing options include single-user, multi-user, and enterprise licenses priced at USD 4750, USD 5250, and USD 8750 respectively.
10. Is the market size provided in terms of value or volume?
The market size is provided in terms of value, measured in Million and volume, measured in K Unit.
11. Are there any specific market keywords associated with the report?
Yes, the market keyword associated with the report is "Organs-on-Chips Industry," which aids in identifying and referencing the specific market segment covered.
12. How do I determine which pricing option suits my needs best?
The pricing options vary based on user requirements and access needs. Individual users may opt for single-user licenses, while businesses requiring broader access may choose multi-user or enterprise licenses for cost-effective access to the report.
13. Are there any additional resources or data provided in the Organs-on-Chips Industry report?
While the report offers comprehensive insights, it's advisable to review the specific contents or supplementary materials provided to ascertain if additional resources or data are available.
14. How can I stay updated on further developments or reports in the Organs-on-Chips Industry?
To stay informed about further developments, trends, and reports in the Organs-on-Chips Industry, consider subscribing to industry newsletters, following relevant companies and organizations, or regularly checking reputable industry news sources and publications.
Methodology
Step 1 - Identification of Relevant Samples Size from Population Database


Step 2 - Approaches for Defining Global Market Size (Value, Volume* & Price*)

Note*: In applicable scenarios
Step 3 - Data Sources
Primary Research
- Web Analytics
- Survey Reports
- Research Institute
- Latest Research Reports
- Opinion Leaders
Secondary Research
- Annual Reports
- White Paper
- Latest Press Release
- Industry Association
- Paid Database
- Investor Presentations

Step 4 - Data Triangulation
Involves using different sources of information in order to increase the validity of a study
These sources are likely to be stakeholders in a program - participants, other researchers, program staff, other community members, and so on.
Then we put all data in single framework & apply various statistical tools to find out the dynamic on the market.
During the analysis stage, feedback from the stakeholder groups would be compared to determine areas of agreement as well as areas of divergence


