
Key Insights
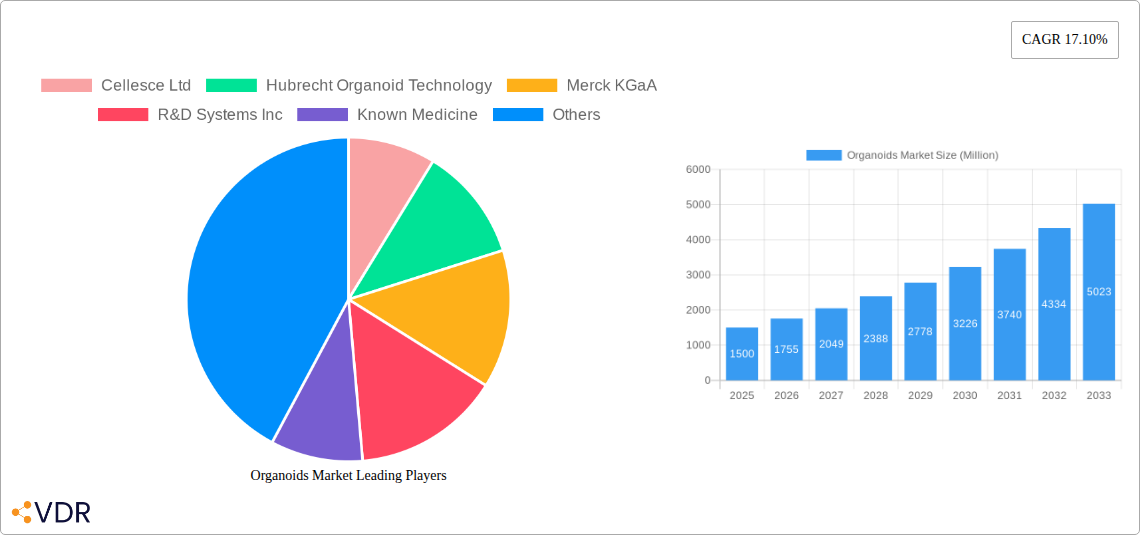
The global organoids market is experiencing robust growth, driven by the increasing adoption of organoids in drug discovery and personalized medicine. A 17.10% CAGR from 2019-2033 indicates significant market expansion, projected to reach substantial value by 2033. This growth is fueled by several key factors. Firstly, the rising prevalence of chronic diseases necessitates more effective and personalized treatments, leading to increased reliance on organoid-based research. Secondly, advancements in 3D cell culture technologies are improving the accuracy and reliability of organoid models, enhancing their utility in various applications. Furthermore, the growing investment in research and development from both pharmaceutical companies and government agencies is further stimulating market growth. The segment encompassing drug discovery and personalized medicine holds the largest market share, followed by drug toxicity and efficacy testing. Geographically, North America currently dominates the market due to robust funding, advanced infrastructure, and the presence of major players. However, the Asia Pacific region is expected to show the highest growth rate over the forecast period due to increasing research activities and rising healthcare expenditure. While high research and development costs and technical complexities pose some restraints, the overall outlook for the organoids market remains exceptionally positive.
The market segmentation reveals key opportunities. Intestinal organoids currently represent the largest product type segment, benefiting from extensive research in gastrointestinal diseases. However, the liver, stomach, and pancreas organoid segments are also growing rapidly due to their applications in studying liver diseases, gastric cancers, and pancreatic disorders respectively. Within the end-user segment, pharmaceutical and biotechnology companies are the key drivers of market growth, while contract research organizations (CROs) are gaining traction due to their expertise in conducting preclinical studies. Key players are continuously innovating, developing advanced organoid models, and expanding their product portfolio to maintain a competitive edge. Strategic collaborations and mergers & acquisitions are expected to further shape the market landscape in the coming years. The continued development of more sophisticated organoid models, coupled with an increasing understanding of their applications, will undoubtedly drive the market to even greater heights.
Organoids Market: A Comprehensive Report (2019-2033)
This comprehensive report provides an in-depth analysis of the Organoids Market, encompassing market dynamics, growth trends, regional segmentation, product landscape, and key players. The study covers the period 2019-2033, with a focus on the forecast period 2025-2033 and a base year of 2025. The report is essential for pharmaceutical and biotechnology companies, contract research organizations, research institutes, and investors seeking to understand this rapidly evolving market. The total market size is projected to reach xx Million by 2033.
Organoids Market Dynamics & Structure
The Organoids market is characterized by moderate concentration, with key players like Cellesce Ltd, Hubrecht Organoid Technology, Merck KGaA, R&D Systems Inc, Known Medicine, 3Dnamics Inc, Dynomics Inc, and Definigen driving innovation and market share. Technological advancements, particularly in 3D cell culture and microfluidic systems, are major growth drivers. Stringent regulatory frameworks, particularly concerning the use of organoids in clinical applications, present a challenge. The market also experiences competition from traditional 2D cell culture methods. Mergers and acquisitions (M&A) activity is noteworthy, with examples like Crown Bioscience's acquisition of OcellO B.V. in 2021 aiming to expand organoid portfolios for drug development.
- Market Concentration: Moderately concentrated, with a few dominant players holding significant market share (estimated at xx% for the top 5 players in 2025).
- Technological Innovation: Significant advancements in 3D bioprinting, microfluidics, and improved culture media are key drivers.
- Regulatory Landscape: Stringent regulations impacting clinical translation and commercialization present a barrier to entry and market expansion.
- Competitive Substitutes: Traditional 2D cell culture methods remain a competitive alternative, although organoids offer superior physiological relevance.
- End-User Demographics: Primarily pharmaceutical and biotechnology companies, followed by CROs and research institutions.
- M&A Activity: A moderate level of M&A activity, indicating consolidation and expansion within the market. xx M&A deals were recorded between 2019 and 2024.
Organoids Market Growth Trends & Insights
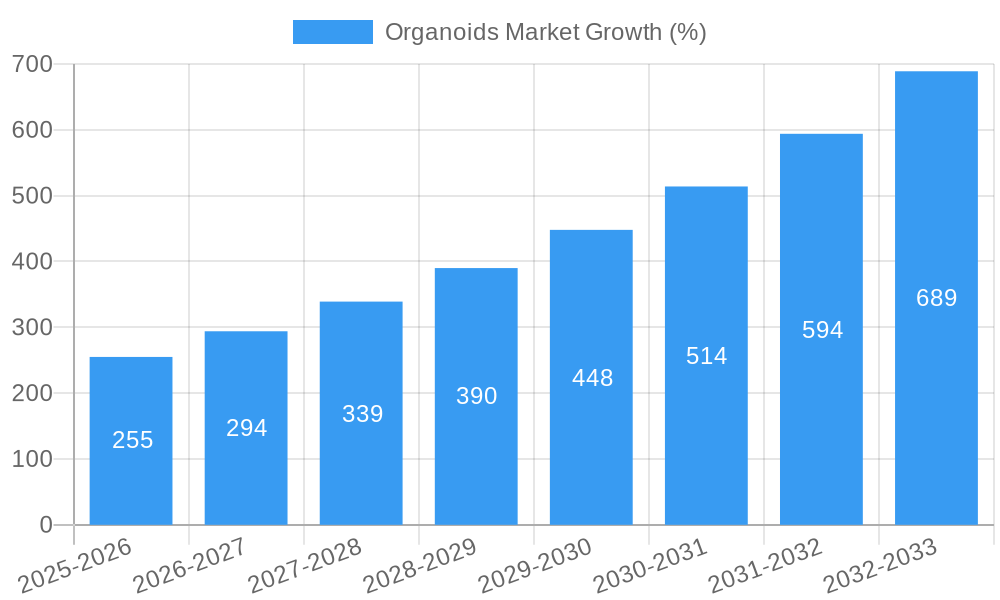
The Organoids market is experiencing robust growth, driven by increasing demand for personalized medicine, drug discovery advancements, and the development of regenerative therapies. The market size grew from xx Million in 2019 to xx Million in 2024, exhibiting a CAGR of xx% during the historical period. This growth is expected to continue, with a projected CAGR of xx% from 2025 to 2033, reaching xx Million by 2033. The adoption rate is increasing steadily, primarily among pharmaceutical and biotechnology companies seeking to enhance drug development processes. Technological disruptions, including advancements in organoid generation and imaging techniques, fuel further market expansion.
Dominant Regions, Countries, or Segments in Organoids Market
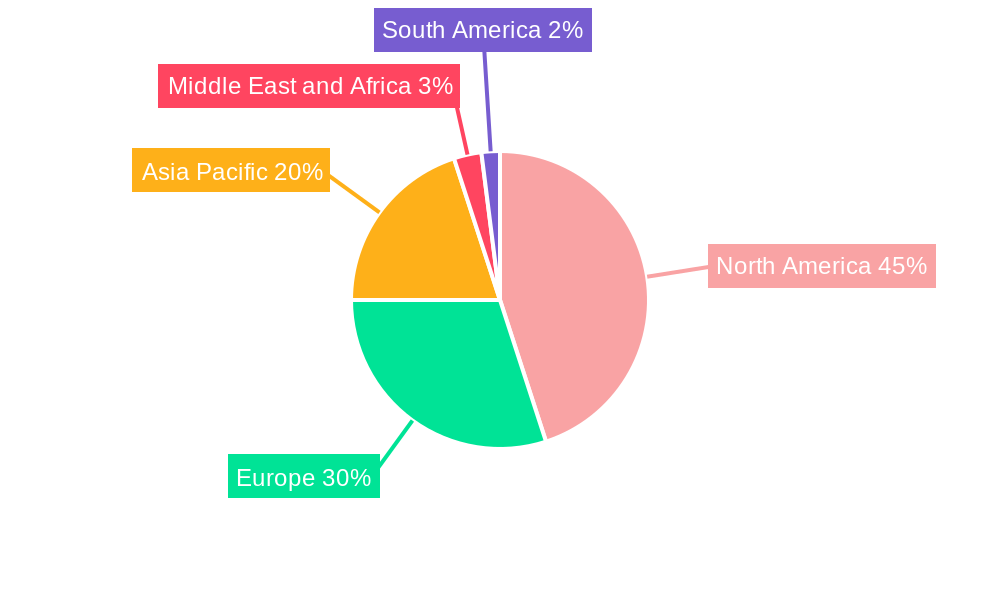
North America currently holds the largest market share in the organoids market, driven by strong research funding, advanced technological infrastructure, and a significant number of pharmaceutical and biotechnology companies. Within the segment breakdown, the drug discovery and personalized medicine application segment shows the highest growth, followed by drug toxicity and efficacy testing. Intestine and Liver organoids represent the largest segments by product type due to higher research interest and clinical relevance.
- By Product Type: Intestine organoids hold the largest market share, followed by liver, stomach, and pancreas. Others (kidney, brain, etc.) represent a smaller but growing segment.
- By Application: Drug discovery and personalized medicine is the dominant application, driven by the need for improved preclinical models. Drug toxicity and efficacy testing is another significant application area.
- By End User: Pharmaceutical and biotechnology companies are the largest end-users, followed by contract research organizations (CROs) and academic research institutions.
- Key Drivers by Region: North America benefits from high R&D investment and a robust regulatory framework (albeit challenging); Europe fosters strong academic collaboration and government support; Asia Pacific demonstrates rapid growth due to increasing research and development activities.
Organoids Market Product Landscape
The organoids market showcases a diverse range of products, including ready-to-use organoid cultures, specialized media formulations, and advanced imaging technologies to enhance organoid analysis and manipulation. Recent innovations include the introduction of vascularized organoids and organoids with immune components, which enable more accurate modeling of human physiology. The unique selling proposition of these organoids lies in their improved predictive power for drug development and disease modeling compared to conventional 2D cell culture models.
Key Drivers, Barriers & Challenges in Organoids Market
Key Drivers: Increased demand for personalized medicine, growing investment in drug discovery and development, advancements in 3D bioprinting and microfluidic technologies, and rising government funding for organoid research.
Challenges: High costs associated with organoid generation and maintenance, stringent regulatory approvals for clinical translation, and challenges in standardizing organoid cultures for reliable and reproducible results. A conservative estimate suggests that standardization challenges reduce the market size by approximately xx Million annually.
Emerging Opportunities in Organoids Market
Emerging opportunities include the expansion of organoid applications into areas such as disease modeling for rare diseases, development of organoid-based diagnostic tools, and the creation of organoids for regenerative medicine applications, particularly for organ transplantation.
Growth Accelerators in the Organoids Market Industry
Long-term growth will be fueled by continuous advancements in organoid technology, increased strategic partnerships between pharmaceutical companies and organoid providers, and expansion into new therapeutic areas. The development of high-throughput organoid screening platforms will significantly accelerate drug discovery and development processes.
Key Players Shaping the Organoids Market Market
- Cellesce Ltd
- Hubrecht Organoid Technology
- Merck KGaA
- R&D Systems Inc
- Known Medicine
- 3Dnamics Inc
- Dynomics Inc
- Definigen
Notable Milestones in Organoids Market Sector
- October 2022: AIM Biotech Pte. Ltd. introduced the organiX System, a 3D tissue culture platform enhancing organoid modeling of human disease.
- May 2021: Crown Bioscience acquired OcellO B.V., expanding its organoid portfolio and drug development capabilities.
In-Depth Organoids Market Market Outlook
The future of the Organoids market appears bright, with significant growth potential driven by continued technological innovation, increased adoption in drug discovery and personalized medicine, and expansion into new therapeutic areas. Strategic partnerships and collaborations are expected to play a key role in driving market growth and accelerating the translation of organoid-based technologies into clinical applications. The market is poised for substantial expansion over the next decade, offering exciting opportunities for companies involved in organoid research, development, and commercialization.
Organoids Market Segmentation
-
1. Product Type
- 1.1. Intestine
- 1.2. Liver
- 1.3. Stomach
- 1.4. Pancrease
- 1.5. Others
-
2. Application
- 2.1. Drug Discovery and Personalized Medicine
- 2.2. Drug Toxicity and Efficacy Testing
- 2.3. Regenerative Medicine
- 2.4. Developmental Biology
- 2.5. Others
-
3. End User
- 3.1. Pharmaceutical and Biotechnology Companies
- 3.2. Contract Research Organisations
- 3.3. Research Institutes
Organoids Market Segmentation By Geography
-
1. North America
- 1.1. United States
- 1.2. Canada
- 1.3. Mexico
-
2. Europe
- 2.1. Germany
- 2.2. United Kingdom
- 2.3. France
- 2.4. Italy
- 2.5. Spain
- 2.6. Rest of Europe
-
3. Asia Pacific
- 3.1. China
- 3.2. Japan
- 3.3. India
- 3.4. Australia
- 3.5. South Korea
- 3.6. Rest of Asia Pacific
-
4. Middle East and Africa
- 4.1. GCC
- 4.2. South Africa
- 4.3. Rest of Middle East and Africa
-
5. South America
- 5.1. Brazil
- 5.2. Argentina
- 5.3. Rest of South America
Organoids Market REPORT HIGHLIGHTS
| Aspects | Details |
|---|---|
| Study Period | 2019-2033 |
| Base Year | 2024 |
| Estimated Year | 2025 |
| Forecast Period | 2025-2033 |
| Historical Period | 2019-2024 |
| Growth Rate | CAGR of 17.10% from 2019-2033 |
| Segmentation |
|
Table of Contents
- 1. Introduction
- 1.1. Research Scope
- 1.2. Market Segmentation
- 1.3. Research Methodology
- 1.4. Definitions and Assumptions
- 2. Executive Summary
- 2.1. Introduction
- 3. Market Dynamics
- 3.1. Introduction
- 3.2. Market Drivers
- 3.2.1. Increasing Number of Research and Development Activity; Latest Advancement in Organoids
- 3.3. Market Restrains
- 3.3.1. Certain Charecteristics Differentiation with the Actual Organs
- 3.4. Market Trends
- 3.4.1. Drug Discovery & Personalized Medicine Segment Expected to Contribute a Significant Proportion in the Market
- 4. Market Factor Analysis
- 4.1. Porters Five Forces
- 4.2. Supply/Value Chain
- 4.3. PESTEL analysis
- 4.4. Market Entropy
- 4.5. Patent/Trademark Analysis
- 5. Global Organoids Market Analysis, Insights and Forecast, 2019-2031
- 5.1. Market Analysis, Insights and Forecast - by Product Type
- 5.1.1. Intestine
- 5.1.2. Liver
- 5.1.3. Stomach
- 5.1.4. Pancrease
- 5.1.5. Others
- 5.2. Market Analysis, Insights and Forecast - by Application
- 5.2.1. Drug Discovery and Personalized Medicine
- 5.2.2. Drug Toxicity and Efficacy Testing
- 5.2.3. Regenerative Medicine
- 5.2.4. Developmental Biology
- 5.2.5. Others
- 5.3. Market Analysis, Insights and Forecast - by End User
- 5.3.1. Pharmaceutical and Biotechnology Companies
- 5.3.2. Contract Research Organisations
- 5.3.3. Research Institutes
- 5.4. Market Analysis, Insights and Forecast - by Region
- 5.4.1. North America
- 5.4.2. Europe
- 5.4.3. Asia Pacific
- 5.4.4. Middle East and Africa
- 5.4.5. South America
- 5.1. Market Analysis, Insights and Forecast - by Product Type
- 6. North America Organoids Market Analysis, Insights and Forecast, 2019-2031
- 6.1. Market Analysis, Insights and Forecast - by Product Type
- 6.1.1. Intestine
- 6.1.2. Liver
- 6.1.3. Stomach
- 6.1.4. Pancrease
- 6.1.5. Others
- 6.2. Market Analysis, Insights and Forecast - by Application
- 6.2.1. Drug Discovery and Personalized Medicine
- 6.2.2. Drug Toxicity and Efficacy Testing
- 6.2.3. Regenerative Medicine
- 6.2.4. Developmental Biology
- 6.2.5. Others
- 6.3. Market Analysis, Insights and Forecast - by End User
- 6.3.1. Pharmaceutical and Biotechnology Companies
- 6.3.2. Contract Research Organisations
- 6.3.3. Research Institutes
- 6.1. Market Analysis, Insights and Forecast - by Product Type
- 7. Europe Organoids Market Analysis, Insights and Forecast, 2019-2031
- 7.1. Market Analysis, Insights and Forecast - by Product Type
- 7.1.1. Intestine
- 7.1.2. Liver
- 7.1.3. Stomach
- 7.1.4. Pancrease
- 7.1.5. Others
- 7.2. Market Analysis, Insights and Forecast - by Application
- 7.2.1. Drug Discovery and Personalized Medicine
- 7.2.2. Drug Toxicity and Efficacy Testing
- 7.2.3. Regenerative Medicine
- 7.2.4. Developmental Biology
- 7.2.5. Others
- 7.3. Market Analysis, Insights and Forecast - by End User
- 7.3.1. Pharmaceutical and Biotechnology Companies
- 7.3.2. Contract Research Organisations
- 7.3.3. Research Institutes
- 7.1. Market Analysis, Insights and Forecast - by Product Type
- 8. Asia Pacific Organoids Market Analysis, Insights and Forecast, 2019-2031
- 8.1. Market Analysis, Insights and Forecast - by Product Type
- 8.1.1. Intestine
- 8.1.2. Liver
- 8.1.3. Stomach
- 8.1.4. Pancrease
- 8.1.5. Others
- 8.2. Market Analysis, Insights and Forecast - by Application
- 8.2.1. Drug Discovery and Personalized Medicine
- 8.2.2. Drug Toxicity and Efficacy Testing
- 8.2.3. Regenerative Medicine
- 8.2.4. Developmental Biology
- 8.2.5. Others
- 8.3. Market Analysis, Insights and Forecast - by End User
- 8.3.1. Pharmaceutical and Biotechnology Companies
- 8.3.2. Contract Research Organisations
- 8.3.3. Research Institutes
- 8.1. Market Analysis, Insights and Forecast - by Product Type
- 9. Middle East and Africa Organoids Market Analysis, Insights and Forecast, 2019-2031
- 9.1. Market Analysis, Insights and Forecast - by Product Type
- 9.1.1. Intestine
- 9.1.2. Liver
- 9.1.3. Stomach
- 9.1.4. Pancrease
- 9.1.5. Others
- 9.2. Market Analysis, Insights and Forecast - by Application
- 9.2.1. Drug Discovery and Personalized Medicine
- 9.2.2. Drug Toxicity and Efficacy Testing
- 9.2.3. Regenerative Medicine
- 9.2.4. Developmental Biology
- 9.2.5. Others
- 9.3. Market Analysis, Insights and Forecast - by End User
- 9.3.1. Pharmaceutical and Biotechnology Companies
- 9.3.2. Contract Research Organisations
- 9.3.3. Research Institutes
- 9.1. Market Analysis, Insights and Forecast - by Product Type
- 10. South America Organoids Market Analysis, Insights and Forecast, 2019-2031
- 10.1. Market Analysis, Insights and Forecast - by Product Type
- 10.1.1. Intestine
- 10.1.2. Liver
- 10.1.3. Stomach
- 10.1.4. Pancrease
- 10.1.5. Others
- 10.2. Market Analysis, Insights and Forecast - by Application
- 10.2.1. Drug Discovery and Personalized Medicine
- 10.2.2. Drug Toxicity and Efficacy Testing
- 10.2.3. Regenerative Medicine
- 10.2.4. Developmental Biology
- 10.2.5. Others
- 10.3. Market Analysis, Insights and Forecast - by End User
- 10.3.1. Pharmaceutical and Biotechnology Companies
- 10.3.2. Contract Research Organisations
- 10.3.3. Research Institutes
- 10.1. Market Analysis, Insights and Forecast - by Product Type
- 11. North America Organoids Market Analysis, Insights and Forecast, 2019-2031
- 11.1. Market Analysis, Insights and Forecast - By Country/Sub-region
- 11.1.1 United States
- 11.1.2 Canada
- 11.1.3 Mexico
- 12. Europe Organoids Market Analysis, Insights and Forecast, 2019-2031
- 12.1. Market Analysis, Insights and Forecast - By Country/Sub-region
- 12.1.1 Germany
- 12.1.2 United Kingdom
- 12.1.3 France
- 12.1.4 Italy
- 12.1.5 Spain
- 12.1.6 Rest of Europe
- 13. Asia Pacific Organoids Market Analysis, Insights and Forecast, 2019-2031
- 13.1. Market Analysis, Insights and Forecast - By Country/Sub-region
- 13.1.1 China
- 13.1.2 Japan
- 13.1.3 India
- 13.1.4 Australia
- 13.1.5 South Korea
- 13.1.6 Rest of Asia Pacific
- 14. Middle East and Africa Organoids Market Analysis, Insights and Forecast, 2019-2031
- 14.1. Market Analysis, Insights and Forecast - By Country/Sub-region
- 14.1.1 GCC
- 14.1.2 South Africa
- 14.1.3 Rest of Middle East and Africa
- 15. South America Organoids Market Analysis, Insights and Forecast, 2019-2031
- 15.1. Market Analysis, Insights and Forecast - By Country/Sub-region
- 15.1.1 Brazil
- 15.1.2 Argentina
- 15.1.3 Rest of South America
- 16. Competitive Analysis
- 16.1. Global Market Share Analysis 2024
- 16.2. Company Profiles
- 16.2.1 Cellesce Ltd
- 16.2.1.1. Overview
- 16.2.1.2. Products
- 16.2.1.3. SWOT Analysis
- 16.2.1.4. Recent Developments
- 16.2.1.5. Financials (Based on Availability)
- 16.2.2 Hubrecht Organoid Technology
- 16.2.2.1. Overview
- 16.2.2.2. Products
- 16.2.2.3. SWOT Analysis
- 16.2.2.4. Recent Developments
- 16.2.2.5. Financials (Based on Availability)
- 16.2.3 Merck KGaA
- 16.2.3.1. Overview
- 16.2.3.2. Products
- 16.2.3.3. SWOT Analysis
- 16.2.3.4. Recent Developments
- 16.2.3.5. Financials (Based on Availability)
- 16.2.4 R&D Systems Inc
- 16.2.4.1. Overview
- 16.2.4.2. Products
- 16.2.4.3. SWOT Analysis
- 16.2.4.4. Recent Developments
- 16.2.4.5. Financials (Based on Availability)
- 16.2.5 Known Medicine
- 16.2.5.1. Overview
- 16.2.5.2. Products
- 16.2.5.3. SWOT Analysis
- 16.2.5.4. Recent Developments
- 16.2.5.5. Financials (Based on Availability)
- 16.2.6 3Dnamics Inc
- 16.2.6.1. Overview
- 16.2.6.2. Products
- 16.2.6.3. SWOT Analysis
- 16.2.6.4. Recent Developments
- 16.2.6.5. Financials (Based on Availability)
- 16.2.7 Dynomics Inc
- 16.2.7.1. Overview
- 16.2.7.2. Products
- 16.2.7.3. SWOT Analysis
- 16.2.7.4. Recent Developments
- 16.2.7.5. Financials (Based on Availability)
- 16.2.8 Definigen
- 16.2.8.1. Overview
- 16.2.8.2. Products
- 16.2.8.3. SWOT Analysis
- 16.2.8.4. Recent Developments
- 16.2.8.5. Financials (Based on Availability)
- 16.2.1 Cellesce Ltd
List of Figures
- Figure 1: Global Organoids Market Revenue Breakdown (Million, %) by Region 2024 & 2032
- Figure 2: Global Organoids Market Volume Breakdown (K Unit, %) by Region 2024 & 2032
- Figure 3: North America Organoids Market Revenue (Million), by Country 2024 & 2032
- Figure 4: North America Organoids Market Volume (K Unit), by Country 2024 & 2032
- Figure 5: North America Organoids Market Revenue Share (%), by Country 2024 & 2032
- Figure 6: North America Organoids Market Volume Share (%), by Country 2024 & 2032
- Figure 7: Europe Organoids Market Revenue (Million), by Country 2024 & 2032
- Figure 8: Europe Organoids Market Volume (K Unit), by Country 2024 & 2032
- Figure 9: Europe Organoids Market Revenue Share (%), by Country 2024 & 2032
- Figure 10: Europe Organoids Market Volume Share (%), by Country 2024 & 2032
- Figure 11: Asia Pacific Organoids Market Revenue (Million), by Country 2024 & 2032
- Figure 12: Asia Pacific Organoids Market Volume (K Unit), by Country 2024 & 2032
- Figure 13: Asia Pacific Organoids Market Revenue Share (%), by Country 2024 & 2032
- Figure 14: Asia Pacific Organoids Market Volume Share (%), by Country 2024 & 2032
- Figure 15: Middle East and Africa Organoids Market Revenue (Million), by Country 2024 & 2032
- Figure 16: Middle East and Africa Organoids Market Volume (K Unit), by Country 2024 & 2032
- Figure 17: Middle East and Africa Organoids Market Revenue Share (%), by Country 2024 & 2032
- Figure 18: Middle East and Africa Organoids Market Volume Share (%), by Country 2024 & 2032
- Figure 19: South America Organoids Market Revenue (Million), by Country 2024 & 2032
- Figure 20: South America Organoids Market Volume (K Unit), by Country 2024 & 2032
- Figure 21: South America Organoids Market Revenue Share (%), by Country 2024 & 2032
- Figure 22: South America Organoids Market Volume Share (%), by Country 2024 & 2032
- Figure 23: North America Organoids Market Revenue (Million), by Product Type 2024 & 2032
- Figure 24: North America Organoids Market Volume (K Unit), by Product Type 2024 & 2032
- Figure 25: North America Organoids Market Revenue Share (%), by Product Type 2024 & 2032
- Figure 26: North America Organoids Market Volume Share (%), by Product Type 2024 & 2032
- Figure 27: North America Organoids Market Revenue (Million), by Application 2024 & 2032
- Figure 28: North America Organoids Market Volume (K Unit), by Application 2024 & 2032
- Figure 29: North America Organoids Market Revenue Share (%), by Application 2024 & 2032
- Figure 30: North America Organoids Market Volume Share (%), by Application 2024 & 2032
- Figure 31: North America Organoids Market Revenue (Million), by End User 2024 & 2032
- Figure 32: North America Organoids Market Volume (K Unit), by End User 2024 & 2032
- Figure 33: North America Organoids Market Revenue Share (%), by End User 2024 & 2032
- Figure 34: North America Organoids Market Volume Share (%), by End User 2024 & 2032
- Figure 35: North America Organoids Market Revenue (Million), by Country 2024 & 2032
- Figure 36: North America Organoids Market Volume (K Unit), by Country 2024 & 2032
- Figure 37: North America Organoids Market Revenue Share (%), by Country 2024 & 2032
- Figure 38: North America Organoids Market Volume Share (%), by Country 2024 & 2032
- Figure 39: Europe Organoids Market Revenue (Million), by Product Type 2024 & 2032
- Figure 40: Europe Organoids Market Volume (K Unit), by Product Type 2024 & 2032
- Figure 41: Europe Organoids Market Revenue Share (%), by Product Type 2024 & 2032
- Figure 42: Europe Organoids Market Volume Share (%), by Product Type 2024 & 2032
- Figure 43: Europe Organoids Market Revenue (Million), by Application 2024 & 2032
- Figure 44: Europe Organoids Market Volume (K Unit), by Application 2024 & 2032
- Figure 45: Europe Organoids Market Revenue Share (%), by Application 2024 & 2032
- Figure 46: Europe Organoids Market Volume Share (%), by Application 2024 & 2032
- Figure 47: Europe Organoids Market Revenue (Million), by End User 2024 & 2032
- Figure 48: Europe Organoids Market Volume (K Unit), by End User 2024 & 2032
- Figure 49: Europe Organoids Market Revenue Share (%), by End User 2024 & 2032
- Figure 50: Europe Organoids Market Volume Share (%), by End User 2024 & 2032
- Figure 51: Europe Organoids Market Revenue (Million), by Country 2024 & 2032
- Figure 52: Europe Organoids Market Volume (K Unit), by Country 2024 & 2032
- Figure 53: Europe Organoids Market Revenue Share (%), by Country 2024 & 2032
- Figure 54: Europe Organoids Market Volume Share (%), by Country 2024 & 2032
- Figure 55: Asia Pacific Organoids Market Revenue (Million), by Product Type 2024 & 2032
- Figure 56: Asia Pacific Organoids Market Volume (K Unit), by Product Type 2024 & 2032
- Figure 57: Asia Pacific Organoids Market Revenue Share (%), by Product Type 2024 & 2032
- Figure 58: Asia Pacific Organoids Market Volume Share (%), by Product Type 2024 & 2032
- Figure 59: Asia Pacific Organoids Market Revenue (Million), by Application 2024 & 2032
- Figure 60: Asia Pacific Organoids Market Volume (K Unit), by Application 2024 & 2032
- Figure 61: Asia Pacific Organoids Market Revenue Share (%), by Application 2024 & 2032
- Figure 62: Asia Pacific Organoids Market Volume Share (%), by Application 2024 & 2032
- Figure 63: Asia Pacific Organoids Market Revenue (Million), by End User 2024 & 2032
- Figure 64: Asia Pacific Organoids Market Volume (K Unit), by End User 2024 & 2032
- Figure 65: Asia Pacific Organoids Market Revenue Share (%), by End User 2024 & 2032
- Figure 66: Asia Pacific Organoids Market Volume Share (%), by End User 2024 & 2032
- Figure 67: Asia Pacific Organoids Market Revenue (Million), by Country 2024 & 2032
- Figure 68: Asia Pacific Organoids Market Volume (K Unit), by Country 2024 & 2032
- Figure 69: Asia Pacific Organoids Market Revenue Share (%), by Country 2024 & 2032
- Figure 70: Asia Pacific Organoids Market Volume Share (%), by Country 2024 & 2032
- Figure 71: Middle East and Africa Organoids Market Revenue (Million), by Product Type 2024 & 2032
- Figure 72: Middle East and Africa Organoids Market Volume (K Unit), by Product Type 2024 & 2032
- Figure 73: Middle East and Africa Organoids Market Revenue Share (%), by Product Type 2024 & 2032
- Figure 74: Middle East and Africa Organoids Market Volume Share (%), by Product Type 2024 & 2032
- Figure 75: Middle East and Africa Organoids Market Revenue (Million), by Application 2024 & 2032
- Figure 76: Middle East and Africa Organoids Market Volume (K Unit), by Application 2024 & 2032
- Figure 77: Middle East and Africa Organoids Market Revenue Share (%), by Application 2024 & 2032
- Figure 78: Middle East and Africa Organoids Market Volume Share (%), by Application 2024 & 2032
- Figure 79: Middle East and Africa Organoids Market Revenue (Million), by End User 2024 & 2032
- Figure 80: Middle East and Africa Organoids Market Volume (K Unit), by End User 2024 & 2032
- Figure 81: Middle East and Africa Organoids Market Revenue Share (%), by End User 2024 & 2032
- Figure 82: Middle East and Africa Organoids Market Volume Share (%), by End User 2024 & 2032
- Figure 83: Middle East and Africa Organoids Market Revenue (Million), by Country 2024 & 2032
- Figure 84: Middle East and Africa Organoids Market Volume (K Unit), by Country 2024 & 2032
- Figure 85: Middle East and Africa Organoids Market Revenue Share (%), by Country 2024 & 2032
- Figure 86: Middle East and Africa Organoids Market Volume Share (%), by Country 2024 & 2032
- Figure 87: South America Organoids Market Revenue (Million), by Product Type 2024 & 2032
- Figure 88: South America Organoids Market Volume (K Unit), by Product Type 2024 & 2032
- Figure 89: South America Organoids Market Revenue Share (%), by Product Type 2024 & 2032
- Figure 90: South America Organoids Market Volume Share (%), by Product Type 2024 & 2032
- Figure 91: South America Organoids Market Revenue (Million), by Application 2024 & 2032
- Figure 92: South America Organoids Market Volume (K Unit), by Application 2024 & 2032
- Figure 93: South America Organoids Market Revenue Share (%), by Application 2024 & 2032
- Figure 94: South America Organoids Market Volume Share (%), by Application 2024 & 2032
- Figure 95: South America Organoids Market Revenue (Million), by End User 2024 & 2032
- Figure 96: South America Organoids Market Volume (K Unit), by End User 2024 & 2032
- Figure 97: South America Organoids Market Revenue Share (%), by End User 2024 & 2032
- Figure 98: South America Organoids Market Volume Share (%), by End User 2024 & 2032
- Figure 99: South America Organoids Market Revenue (Million), by Country 2024 & 2032
- Figure 100: South America Organoids Market Volume (K Unit), by Country 2024 & 2032
- Figure 101: South America Organoids Market Revenue Share (%), by Country 2024 & 2032
- Figure 102: South America Organoids Market Volume Share (%), by Country 2024 & 2032
List of Tables
- Table 1: Global Organoids Market Revenue Million Forecast, by Region 2019 & 2032
- Table 2: Global Organoids Market Volume K Unit Forecast, by Region 2019 & 2032
- Table 3: Global Organoids Market Revenue Million Forecast, by Product Type 2019 & 2032
- Table 4: Global Organoids Market Volume K Unit Forecast, by Product Type 2019 & 2032
- Table 5: Global Organoids Market Revenue Million Forecast, by Application 2019 & 2032
- Table 6: Global Organoids Market Volume K Unit Forecast, by Application 2019 & 2032
- Table 7: Global Organoids Market Revenue Million Forecast, by End User 2019 & 2032
- Table 8: Global Organoids Market Volume K Unit Forecast, by End User 2019 & 2032
- Table 9: Global Organoids Market Revenue Million Forecast, by Region 2019 & 2032
- Table 10: Global Organoids Market Volume K Unit Forecast, by Region 2019 & 2032
- Table 11: Global Organoids Market Revenue Million Forecast, by Country 2019 & 2032
- Table 12: Global Organoids Market Volume K Unit Forecast, by Country 2019 & 2032
- Table 13: United States Organoids Market Revenue (Million) Forecast, by Application 2019 & 2032
- Table 14: United States Organoids Market Volume (K Unit) Forecast, by Application 2019 & 2032
- Table 15: Canada Organoids Market Revenue (Million) Forecast, by Application 2019 & 2032
- Table 16: Canada Organoids Market Volume (K Unit) Forecast, by Application 2019 & 2032
- Table 17: Mexico Organoids Market Revenue (Million) Forecast, by Application 2019 & 2032
- Table 18: Mexico Organoids Market Volume (K Unit) Forecast, by Application 2019 & 2032
- Table 19: Global Organoids Market Revenue Million Forecast, by Country 2019 & 2032
- Table 20: Global Organoids Market Volume K Unit Forecast, by Country 2019 & 2032
- Table 21: Germany Organoids Market Revenue (Million) Forecast, by Application 2019 & 2032
- Table 22: Germany Organoids Market Volume (K Unit) Forecast, by Application 2019 & 2032
- Table 23: United Kingdom Organoids Market Revenue (Million) Forecast, by Application 2019 & 2032
- Table 24: United Kingdom Organoids Market Volume (K Unit) Forecast, by Application 2019 & 2032
- Table 25: France Organoids Market Revenue (Million) Forecast, by Application 2019 & 2032
- Table 26: France Organoids Market Volume (K Unit) Forecast, by Application 2019 & 2032
- Table 27: Italy Organoids Market Revenue (Million) Forecast, by Application 2019 & 2032
- Table 28: Italy Organoids Market Volume (K Unit) Forecast, by Application 2019 & 2032
- Table 29: Spain Organoids Market Revenue (Million) Forecast, by Application 2019 & 2032
- Table 30: Spain Organoids Market Volume (K Unit) Forecast, by Application 2019 & 2032
- Table 31: Rest of Europe Organoids Market Revenue (Million) Forecast, by Application 2019 & 2032
- Table 32: Rest of Europe Organoids Market Volume (K Unit) Forecast, by Application 2019 & 2032
- Table 33: Global Organoids Market Revenue Million Forecast, by Country 2019 & 2032
- Table 34: Global Organoids Market Volume K Unit Forecast, by Country 2019 & 2032
- Table 35: China Organoids Market Revenue (Million) Forecast, by Application 2019 & 2032
- Table 36: China Organoids Market Volume (K Unit) Forecast, by Application 2019 & 2032
- Table 37: Japan Organoids Market Revenue (Million) Forecast, by Application 2019 & 2032
- Table 38: Japan Organoids Market Volume (K Unit) Forecast, by Application 2019 & 2032
- Table 39: India Organoids Market Revenue (Million) Forecast, by Application 2019 & 2032
- Table 40: India Organoids Market Volume (K Unit) Forecast, by Application 2019 & 2032
- Table 41: Australia Organoids Market Revenue (Million) Forecast, by Application 2019 & 2032
- Table 42: Australia Organoids Market Volume (K Unit) Forecast, by Application 2019 & 2032
- Table 43: South Korea Organoids Market Revenue (Million) Forecast, by Application 2019 & 2032
- Table 44: South Korea Organoids Market Volume (K Unit) Forecast, by Application 2019 & 2032
- Table 45: Rest of Asia Pacific Organoids Market Revenue (Million) Forecast, by Application 2019 & 2032
- Table 46: Rest of Asia Pacific Organoids Market Volume (K Unit) Forecast, by Application 2019 & 2032
- Table 47: Global Organoids Market Revenue Million Forecast, by Country 2019 & 2032
- Table 48: Global Organoids Market Volume K Unit Forecast, by Country 2019 & 2032
- Table 49: GCC Organoids Market Revenue (Million) Forecast, by Application 2019 & 2032
- Table 50: GCC Organoids Market Volume (K Unit) Forecast, by Application 2019 & 2032
- Table 51: South Africa Organoids Market Revenue (Million) Forecast, by Application 2019 & 2032
- Table 52: South Africa Organoids Market Volume (K Unit) Forecast, by Application 2019 & 2032
- Table 53: Rest of Middle East and Africa Organoids Market Revenue (Million) Forecast, by Application 2019 & 2032
- Table 54: Rest of Middle East and Africa Organoids Market Volume (K Unit) Forecast, by Application 2019 & 2032
- Table 55: Global Organoids Market Revenue Million Forecast, by Country 2019 & 2032
- Table 56: Global Organoids Market Volume K Unit Forecast, by Country 2019 & 2032
- Table 57: Brazil Organoids Market Revenue (Million) Forecast, by Application 2019 & 2032
- Table 58: Brazil Organoids Market Volume (K Unit) Forecast, by Application 2019 & 2032
- Table 59: Argentina Organoids Market Revenue (Million) Forecast, by Application 2019 & 2032
- Table 60: Argentina Organoids Market Volume (K Unit) Forecast, by Application 2019 & 2032
- Table 61: Rest of South America Organoids Market Revenue (Million) Forecast, by Application 2019 & 2032
- Table 62: Rest of South America Organoids Market Volume (K Unit) Forecast, by Application 2019 & 2032
- Table 63: Global Organoids Market Revenue Million Forecast, by Product Type 2019 & 2032
- Table 64: Global Organoids Market Volume K Unit Forecast, by Product Type 2019 & 2032
- Table 65: Global Organoids Market Revenue Million Forecast, by Application 2019 & 2032
- Table 66: Global Organoids Market Volume K Unit Forecast, by Application 2019 & 2032
- Table 67: Global Organoids Market Revenue Million Forecast, by End User 2019 & 2032
- Table 68: Global Organoids Market Volume K Unit Forecast, by End User 2019 & 2032
- Table 69: Global Organoids Market Revenue Million Forecast, by Country 2019 & 2032
- Table 70: Global Organoids Market Volume K Unit Forecast, by Country 2019 & 2032
- Table 71: United States Organoids Market Revenue (Million) Forecast, by Application 2019 & 2032
- Table 72: United States Organoids Market Volume (K Unit) Forecast, by Application 2019 & 2032
- Table 73: Canada Organoids Market Revenue (Million) Forecast, by Application 2019 & 2032
- Table 74: Canada Organoids Market Volume (K Unit) Forecast, by Application 2019 & 2032
- Table 75: Mexico Organoids Market Revenue (Million) Forecast, by Application 2019 & 2032
- Table 76: Mexico Organoids Market Volume (K Unit) Forecast, by Application 2019 & 2032
- Table 77: Global Organoids Market Revenue Million Forecast, by Product Type 2019 & 2032
- Table 78: Global Organoids Market Volume K Unit Forecast, by Product Type 2019 & 2032
- Table 79: Global Organoids Market Revenue Million Forecast, by Application 2019 & 2032
- Table 80: Global Organoids Market Volume K Unit Forecast, by Application 2019 & 2032
- Table 81: Global Organoids Market Revenue Million Forecast, by End User 2019 & 2032
- Table 82: Global Organoids Market Volume K Unit Forecast, by End User 2019 & 2032
- Table 83: Global Organoids Market Revenue Million Forecast, by Country 2019 & 2032
- Table 84: Global Organoids Market Volume K Unit Forecast, by Country 2019 & 2032
- Table 85: Germany Organoids Market Revenue (Million) Forecast, by Application 2019 & 2032
- Table 86: Germany Organoids Market Volume (K Unit) Forecast, by Application 2019 & 2032
- Table 87: United Kingdom Organoids Market Revenue (Million) Forecast, by Application 2019 & 2032
- Table 88: United Kingdom Organoids Market Volume (K Unit) Forecast, by Application 2019 & 2032
- Table 89: France Organoids Market Revenue (Million) Forecast, by Application 2019 & 2032
- Table 90: France Organoids Market Volume (K Unit) Forecast, by Application 2019 & 2032
- Table 91: Italy Organoids Market Revenue (Million) Forecast, by Application 2019 & 2032
- Table 92: Italy Organoids Market Volume (K Unit) Forecast, by Application 2019 & 2032
- Table 93: Spain Organoids Market Revenue (Million) Forecast, by Application 2019 & 2032
- Table 94: Spain Organoids Market Volume (K Unit) Forecast, by Application 2019 & 2032
- Table 95: Rest of Europe Organoids Market Revenue (Million) Forecast, by Application 2019 & 2032
- Table 96: Rest of Europe Organoids Market Volume (K Unit) Forecast, by Application 2019 & 2032
- Table 97: Global Organoids Market Revenue Million Forecast, by Product Type 2019 & 2032
- Table 98: Global Organoids Market Volume K Unit Forecast, by Product Type 2019 & 2032
- Table 99: Global Organoids Market Revenue Million Forecast, by Application 2019 & 2032
- Table 100: Global Organoids Market Volume K Unit Forecast, by Application 2019 & 2032
- Table 101: Global Organoids Market Revenue Million Forecast, by End User 2019 & 2032
- Table 102: Global Organoids Market Volume K Unit Forecast, by End User 2019 & 2032
- Table 103: Global Organoids Market Revenue Million Forecast, by Country 2019 & 2032
- Table 104: Global Organoids Market Volume K Unit Forecast, by Country 2019 & 2032
- Table 105: China Organoids Market Revenue (Million) Forecast, by Application 2019 & 2032
- Table 106: China Organoids Market Volume (K Unit) Forecast, by Application 2019 & 2032
- Table 107: Japan Organoids Market Revenue (Million) Forecast, by Application 2019 & 2032
- Table 108: Japan Organoids Market Volume (K Unit) Forecast, by Application 2019 & 2032
- Table 109: India Organoids Market Revenue (Million) Forecast, by Application 2019 & 2032
- Table 110: India Organoids Market Volume (K Unit) Forecast, by Application 2019 & 2032
- Table 111: Australia Organoids Market Revenue (Million) Forecast, by Application 2019 & 2032
- Table 112: Australia Organoids Market Volume (K Unit) Forecast, by Application 2019 & 2032
- Table 113: South Korea Organoids Market Revenue (Million) Forecast, by Application 2019 & 2032
- Table 114: South Korea Organoids Market Volume (K Unit) Forecast, by Application 2019 & 2032
- Table 115: Rest of Asia Pacific Organoids Market Revenue (Million) Forecast, by Application 2019 & 2032
- Table 116: Rest of Asia Pacific Organoids Market Volume (K Unit) Forecast, by Application 2019 & 2032
- Table 117: Global Organoids Market Revenue Million Forecast, by Product Type 2019 & 2032
- Table 118: Global Organoids Market Volume K Unit Forecast, by Product Type 2019 & 2032
- Table 119: Global Organoids Market Revenue Million Forecast, by Application 2019 & 2032
- Table 120: Global Organoids Market Volume K Unit Forecast, by Application 2019 & 2032
- Table 121: Global Organoids Market Revenue Million Forecast, by End User 2019 & 2032
- Table 122: Global Organoids Market Volume K Unit Forecast, by End User 2019 & 2032
- Table 123: Global Organoids Market Revenue Million Forecast, by Country 2019 & 2032
- Table 124: Global Organoids Market Volume K Unit Forecast, by Country 2019 & 2032
- Table 125: GCC Organoids Market Revenue (Million) Forecast, by Application 2019 & 2032
- Table 126: GCC Organoids Market Volume (K Unit) Forecast, by Application 2019 & 2032
- Table 127: South Africa Organoids Market Revenue (Million) Forecast, by Application 2019 & 2032
- Table 128: South Africa Organoids Market Volume (K Unit) Forecast, by Application 2019 & 2032
- Table 129: Rest of Middle East and Africa Organoids Market Revenue (Million) Forecast, by Application 2019 & 2032
- Table 130: Rest of Middle East and Africa Organoids Market Volume (K Unit) Forecast, by Application 2019 & 2032
- Table 131: Global Organoids Market Revenue Million Forecast, by Product Type 2019 & 2032
- Table 132: Global Organoids Market Volume K Unit Forecast, by Product Type 2019 & 2032
- Table 133: Global Organoids Market Revenue Million Forecast, by Application 2019 & 2032
- Table 134: Global Organoids Market Volume K Unit Forecast, by Application 2019 & 2032
- Table 135: Global Organoids Market Revenue Million Forecast, by End User 2019 & 2032
- Table 136: Global Organoids Market Volume K Unit Forecast, by End User 2019 & 2032
- Table 137: Global Organoids Market Revenue Million Forecast, by Country 2019 & 2032
- Table 138: Global Organoids Market Volume K Unit Forecast, by Country 2019 & 2032
- Table 139: Brazil Organoids Market Revenue (Million) Forecast, by Application 2019 & 2032
- Table 140: Brazil Organoids Market Volume (K Unit) Forecast, by Application 2019 & 2032
- Table 141: Argentina Organoids Market Revenue (Million) Forecast, by Application 2019 & 2032
- Table 142: Argentina Organoids Market Volume (K Unit) Forecast, by Application 2019 & 2032
- Table 143: Rest of South America Organoids Market Revenue (Million) Forecast, by Application 2019 & 2032
- Table 144: Rest of South America Organoids Market Volume (K Unit) Forecast, by Application 2019 & 2032
Frequently Asked Questions
1. What is the projected Compound Annual Growth Rate (CAGR) of the Organoids Market?
The projected CAGR is approximately 17.10%.
2. Which companies are prominent players in the Organoids Market?
Key companies in the market include Cellesce Ltd, Hubrecht Organoid Technology, Merck KGaA, R&D Systems Inc, Known Medicine, 3Dnamics Inc, Dynomics Inc , Definigen.
3. What are the main segments of the Organoids Market?
The market segments include Product Type, Application, End User.
4. Can you provide details about the market size?
The market size is estimated to be USD XX Million as of 2022.
5. What are some drivers contributing to market growth?
Increasing Number of Research and Development Activity; Latest Advancement in Organoids.
6. What are the notable trends driving market growth?
Drug Discovery & Personalized Medicine Segment Expected to Contribute a Significant Proportion in the Market.
7. Are there any restraints impacting market growth?
Certain Charecteristics Differentiation with the Actual Organs.
8. Can you provide examples of recent developments in the market?
October 2022: AIM Biotech Pte. Ltd., introduced the organiX System, a 3D tissue culture platform that can add vascularization and immune competence to organoids, spheroids, and tumor biopsies. This assists the company in close modeling of human disease.
9. What pricing options are available for accessing the report?
Pricing options include single-user, multi-user, and enterprise licenses priced at USD 4750, USD 5250, and USD 8750 respectively.
10. Is the market size provided in terms of value or volume?
The market size is provided in terms of value, measured in Million and volume, measured in K Unit.
11. Are there any specific market keywords associated with the report?
Yes, the market keyword associated with the report is "Organoids Market," which aids in identifying and referencing the specific market segment covered.
12. How do I determine which pricing option suits my needs best?
The pricing options vary based on user requirements and access needs. Individual users may opt for single-user licenses, while businesses requiring broader access may choose multi-user or enterprise licenses for cost-effective access to the report.
13. Are there any additional resources or data provided in the Organoids Market report?
While the report offers comprehensive insights, it's advisable to review the specific contents or supplementary materials provided to ascertain if additional resources or data are available.
14. How can I stay updated on further developments or reports in the Organoids Market?
To stay informed about further developments, trends, and reports in the Organoids Market, consider subscribing to industry newsletters, following relevant companies and organizations, or regularly checking reputable industry news sources and publications.
Methodology
Step 1 - Identification of Relevant Samples Size from Population Database


Step 2 - Approaches for Defining Global Market Size (Value, Volume* & Price*)

Note*: In applicable scenarios
Step 3 - Data Sources
Primary Research
- Web Analytics
- Survey Reports
- Research Institute
- Latest Research Reports
- Opinion Leaders
Secondary Research
- Annual Reports
- White Paper
- Latest Press Release
- Industry Association
- Paid Database
- Investor Presentations

Step 4 - Data Triangulation
Involves using different sources of information in order to increase the validity of a study
These sources are likely to be stakeholders in a program - participants, other researchers, program staff, other community members, and so on.
Then we put all data in single framework & apply various statistical tools to find out the dynamic on the market.
During the analysis stage, feedback from the stakeholder groups would be compared to determine areas of agreement as well as areas of divergence


