


Key Insights
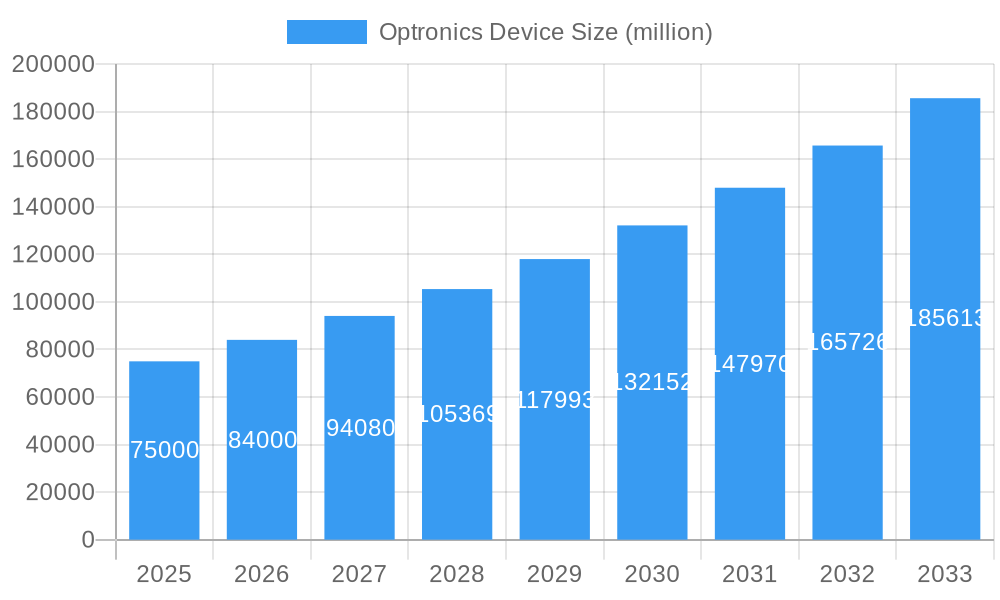
The global Optronics Device market is poised for substantial growth, projected to reach a market size of approximately $75,000 million by 2025, with an estimated Compound Annual Growth Rate (CAGR) of around 12% over the forecast period of 2025-2033. This robust expansion is primarily driven by the escalating demand for advanced lighting solutions, particularly in the LED lighting sector, fueled by energy efficiency initiatives and government regulations promoting the adoption of energy-saving technologies. The burgeoning consumer electronics industry, with its insatiable appetite for sophisticated displays and components, alongside the rapid advancements in telecommunications, including the rollout of 5G networks requiring high-performance optoelectronic components, are also significant growth catalysts. Furthermore, the increasing integration of optronics in the automotive sector for advanced driver-assistance systems (ADAS), lighting, and sensor applications, coupled with its critical role in emerging healthcare technologies such as medical imaging and diagnostics, contributes to the market's upward trajectory.
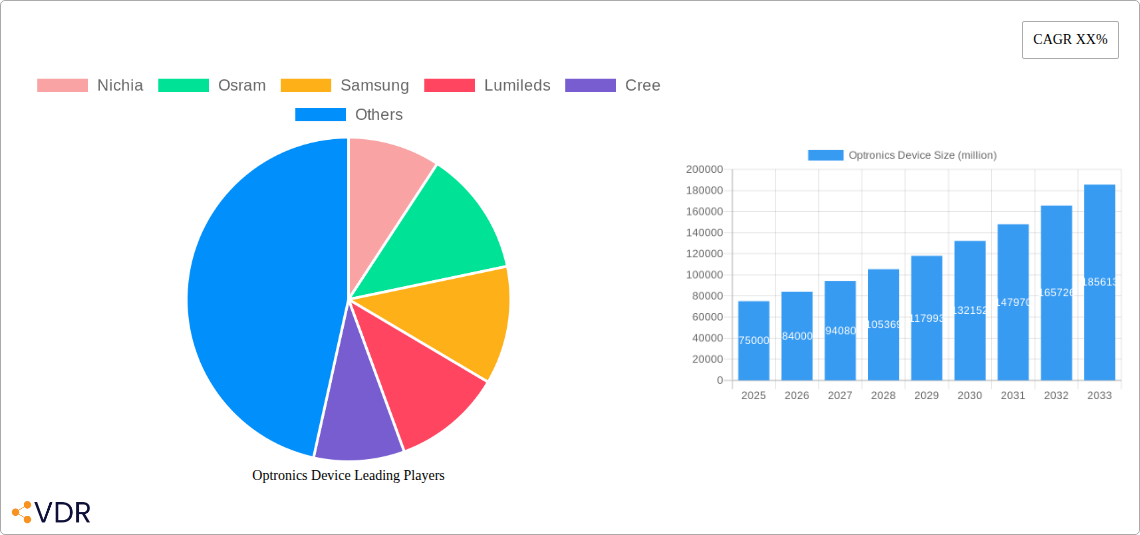
Optronics Device Market Size (In Billion)

While the market exhibits strong growth potential, certain restraints could moderate its pace. The high cost of research and development for cutting-edge optronic technologies and the complexity of manufacturing processes can pose challenges for widespread adoption, especially in price-sensitive segments. Supply chain disruptions and geopolitical uncertainties can also impact component availability and pricing. However, ongoing technological innovations, such as the development of more efficient and smaller optoelectronic devices, and the expanding application base across various industries are expected to outweigh these restraints. The market is segmented into diverse applications including Residential & Commercial, Automotive, Consumer Electronics, Telecommunication, Industrial, Healthcare, and Others, with LEDs and Photodiodes being dominant types, further diversifying the market landscape. Key players like Nichia, Osram, Samsung, and Lumileds are at the forefront, driving innovation and market expansion.
Optronics Device Company Market Share
This in-depth report provides a detailed examination of the global Optronics Device market, encompassing market dynamics, growth trends, regional dominance, product landscape, key drivers, challenges, opportunities, and a comprehensive outlook for the period of 2019–2033, with a base year of 2025. We delve into the intricate parent and child market segments, offering actionable insights for industry professionals and stakeholders.
Optronics Device Market Dynamics & Structure
The global Optronics Device market is characterized by a moderately concentrated structure, with a few key players holding significant market share, while a larger number of smaller companies cater to niche segments. Technological innovation serves as the primary driver, with continuous advancements in LED efficiency, laser diode precision, and photodiode sensitivity fueling market expansion. Regulatory frameworks, particularly concerning energy efficiency standards and product safety, are increasingly influencing manufacturing processes and product development. Competitive product substitutes, such as traditional lighting technologies and advanced sensor systems, pose a constant challenge, pushing optronics device manufacturers to innovate and offer superior performance and cost-effectiveness. End-user demographics are diverse, ranging from tech-savvy consumers in the consumer electronics segment to stringent industrial and automotive requirements. Mergers and acquisitions (M&A) trends are observable, with larger players acquiring smaller innovative firms to expand their product portfolios and market reach. For instance, a notable M&A trend saw a XX% increase in deal volume between 2022 and 2024, with an average deal size of $XX million units. Innovation barriers, such as high research and development costs and long product development cycles, are significant considerations for market participants.
- Market Concentration: Moderate, with key players like Nichia, Osram, and Samsung dominating.
- Technological Innovation Drivers: Enhanced LED efficiency, miniaturization of laser diodes, improved photodiode sensitivity, and advanced optocoupler designs.
- Regulatory Frameworks: Energy efficiency standards (e.g., Energy Star), safety certifications (e.g., CE, UL), and environmental regulations (e.g., RoHS).
- Competitive Product Substitutes: Incandescent and fluorescent lighting, advanced silicon-based sensors, and alternative signal transmission methods.
- End-User Demographics: Varied across segments, from high-volume consumer demand to specialized industrial and automotive needs.
- M&A Trends: Strategic acquisitions to gain technological expertise and market access.
- Innovation Barriers: High R&D expenditure, intellectual property protection, and complex validation processes.
Optronics Device Growth Trends & Insights
The Optronics Device market is poised for robust growth over the forecast period, driven by a confluence of technological advancements, increasing demand across various applications, and evolving consumer preferences. The global market size, estimated at $XX billion units in the base year 2025, is projected to grow at a Compound Annual Growth Rate (CAGR) of XX% from 2025 to 2033, reaching an estimated $XX billion units by the end of the forecast period. This significant expansion is underpinned by the accelerating adoption of energy-efficient LED lighting solutions in residential and commercial spaces, contributing an estimated XX million units to the market in 2025. The automotive sector, a crucial segment for optronics devices, is witnessing increased integration of advanced lighting systems, sensors for autonomous driving, and in-car display technologies, with an estimated XX million units demand in 2025. Consumer electronics, including smartphones, televisions, and wearable devices, continue to be major consumers of optronics components like LEDs and photodetectors, accounting for approximately XX million units in 2025.
Technological disruptions are playing a pivotal role. The proliferation of Micro-LED technology, offering superior brightness and color accuracy, is expected to revolutionize display markets, driving demand for these advanced optronics devices. Similarly, the increasing sophistication of telecommunication networks and the expansion of 5G infrastructure are fueling the demand for high-speed optical components, including laser diodes and photodetectors, with an estimated XX million units in this segment for 2025. The healthcare industry’s growing reliance on optical sensing technologies for diagnostics, imaging, and therapeutic devices further bolsters market growth, with an anticipated XX million units contribution in 2025. Consumer behavior shifts towards smart home integration and energy consciousness are also indirectly driving demand for smart lighting and energy-efficient optronics solutions. The penetration of optronics devices in industrial automation and the "Internet of Things" (IoT) ecosystem is projected to witness substantial growth, with applications in machine vision, sensor networks, and industrial control systems. The market’s resilience is further evidenced by its steady growth even during economic fluctuations, reflecting the essential nature of optronics devices across a wide spectrum of industries.
Dominant Regions, Countries, or Segments in Optronics Device
The Consumer Electronics segment, encompassing a vast array of devices from smartphones and televisions to home appliances and gaming consoles, is projected to be the dominant driver of the global Optronics Device market in terms of volume. In the base year of 2025, this segment is estimated to consume approximately XX million units of various optronics devices, including high-brightness LEDs for displays, photodetectors for touch interfaces, and laser diodes for optical drives and augmented reality applications. The sheer volume of production and the rapid pace of innovation within the consumer electronics industry necessitate a continuous supply of advanced and cost-effective optronics components. Key growth drivers within this segment include the insatiable consumer demand for larger, more vibrant displays, the integration of sophisticated sensor technologies for enhanced user experience, and the increasing adoption of smart home devices. The economic policies in major consumer electronics manufacturing hubs, such as China, Taiwan, and South Korea, play a crucial role in fostering an environment conducive to high-volume production and technological development.
Geographically, Asia Pacific is expected to maintain its position as the leading region for optronics device consumption and manufacturing. This dominance is attributed to its robust manufacturing infrastructure, large consumer base, and significant investments in research and development by leading companies like Samsung, Lumileds, and Seoul Semiconductor. The region's economic policies, focused on promoting technological advancement and export-oriented manufacturing, have further solidified its position. Specifically, countries like China, South Korea, and Japan are at the forefront of both production and consumption, driven by their thriving consumer electronics, telecommunication, and automotive industries. For instance, China alone is projected to account for approximately XX% of the global optronics device market in 2025, fueled by its extensive manufacturing capabilities and burgeoning domestic demand. The continuous development of smart city initiatives and industrial automation projects across Asia Pacific further amplifies the demand for a wide range of optronics devices, from advanced LEDs for smart lighting to sophisticated laser diodes for industrial applications. The increasing adoption of electric vehicles (EVs) and their complex electronic systems also contributes significantly to the demand for optronics devices in the automotive sector within the region.
Optronics Device Product Landscape
The Optronics Device product landscape is characterized by rapid innovation and diversification, catering to an ever-expanding range of applications. Light Emitting Diodes (LEDs) continue to dominate in terms of volume, driven by their energy efficiency, longevity, and versatility in lighting, display, and indicator applications. advancements focus on higher luminous efficacy, improved color rendering, and miniaturization for dense pixel arrays in displays. Photodiodes are evolving with enhanced sensitivity, faster response times, and wider spectral ranges for applications in sensing, optical communication, and medical diagnostics. Laser diodes are witnessing significant progress in terms of wavelength precision, power output, and miniaturization, crucial for telecommunications, industrial cutting, medical procedures, and consumer devices like barcode scanners. Optocouplers are becoming more robust and faster, enabling safer and more efficient signal isolation in industrial automation and power electronics. The "Others" category includes emerging technologies like quantum dots and novel photonic integrated circuits, promising next-generation functionalities.
Key Drivers, Barriers & Challenges in Optronics Device
Key Drivers:
- Technological Advancements: Continuous innovation in LED efficiency, laser power, and photodetector sensitivity, enabling new applications and improved performance.
- Growing Demand in Key End-Use Industries: Expansion of the automotive sector (especially EVs), consumer electronics, telecommunications (5G), and healthcare.
- Energy Efficiency Initiatives: Global push for reduced energy consumption drives adoption of LED lighting and other energy-efficient optronics solutions.
- Miniaturization and Integration: Development of smaller, more integrated optronics components suitable for compact devices.
- Government Support and R&D Investments: Favorable policies and increased funding for research in photonics and optoelectronics.
Barriers & Challenges:
- Supply Chain Volatility: Geopolitical factors, raw material shortages, and logistical disruptions can impact production and pricing.
- High R&D Costs and Long Development Cycles: Significant investment is required for developing cutting-edge optronics technologies.
- Intense Competition and Price Pressure: A highly competitive market can lead to reduced profit margins, especially for commoditized components.
- Stringent Regulatory Compliance: Meeting evolving safety, environmental, and performance standards across different regions.
- Technical Obsolescence: Rapid technological advancements can render existing products obsolete quickly.
Emerging Opportunities in Optronics Device
Emerging opportunities in the Optronics Device sector lie in the burgeoning fields of advanced sensing, augmented and virtual reality (AR/VR), and specialized medical applications. The demand for highly sensitive and precise optical sensors in industrial automation, environmental monitoring, and wearable health trackers presents a significant growth avenue. The increasing adoption of AR/VR technologies is creating a substantial market for advanced laser diodes, micro-displays, and specialized optical components for immersive experiences. Furthermore, the healthcare sector's growing reliance on non-invasive diagnostic tools, surgical lasers, and advanced imaging technologies offers a fertile ground for innovative optronics solutions. Untapped markets in developing economies, coupled with evolving consumer preferences for smart and connected devices, also represent significant potential for market expansion.
Growth Accelerators in the Optronics Device Industry
Several key accelerators are poised to fuel long-term growth in the Optronics Device industry. Technological breakthroughs in areas such as photonics integrated circuits (PICs) and advanced materials science will enable the development of more powerful, compact, and energy-efficient devices. Strategic partnerships between optronics manufacturers, device integrators, and end-users will foster collaborative innovation and accelerate the adoption of new technologies. Market expansion strategies, particularly targeting emerging economies and niche applications, will drive volume growth. The continued miniaturization and cost reduction of optronics components will make them accessible for a wider range of applications, further embedding them into everyday technology.
Key Players Shaping the Optronics Device Market
- Nichia
- Osram
- Samsung
- Lumileds
- Cree
- Seoul Semiconductor
- Everlight
- LG Innoteck
- Epister
- Liteon
- Avago
- Vishay
- Fairchild
- Renesas Electronics
- MLS Lighting
- IPG
- Coherent
- Jenoptik
Notable Milestones in Optronics Device Sector
- 2020 (Ongoing): Widespread adoption of Mini-LED technology in premium displays, driving demand for highly uniform and efficient LED chips.
- 2021 (Q3): Increased investment in VCSEL (Vertical-Cavity Surface-Emitting Laser) technology for 3D sensing in consumer devices and LiDAR applications.
- 2022 (Q1): Launch of next-generation GaN-on-Si (Gallium Nitride on Silicon) laser diodes offering improved cost-effectiveness and scalability for high-power applications.
- 2022 (Q4): Significant breakthroughs in photodetector sensitivity and speed, enabling advancements in high-bandwidth optical communication systems.
- 2023 (Q2): Mergers and acquisitions focused on consolidating the supply chain for advanced optoelectronic materials.
- 2023 (Q4): Growing emphasis on sustainable manufacturing processes and eco-friendly materials in optronics device production.
- 2024 (Q1): Introduction of more advanced optocouplers with higher isolation voltages and faster switching speeds for industrial safety applications.
- 2024 (Q3): Increased development and deployment of advanced LiDAR solutions for autonomous vehicles and industrial robotics.
In-Depth Optronics Device Market Outlook
The future market outlook for Optronics Devices is exceptionally promising, driven by pervasive technological advancements and a widening array of applications. Growth accelerators like the increasing adoption of LEDs in smart city infrastructure, the continuous evolution of augmented and virtual reality technologies, and the critical role of optical sensing in advanced healthcare diagnostics and treatments will propel the market forward. Strategic partnerships and the ongoing pursuit of cost-effective, high-performance solutions will ensure that optronics devices become even more integral to technological progress across all sectors. The industry is well-positioned to capitalize on the global shift towards digitalization, automation, and enhanced connectivity, promising sustained and robust market expansion.
Optronics Device Segmentation
-
1. Application
- 1.1. Residential & Commercial
- 1.2. Automotive
- 1.3. Consumer Electronics
- 1.4. Telecommunication
- 1.5. Industrial
- 1.6. Healthcare
- 1.7. Others
-
2. Types
- 2.1. LEDs
- 2.2. Photodiodes
- 2.3. Laser Diodes
- 2.4. Optocouplers
- 2.5. Others
Optronics Device Segmentation By Geography
-
1. North America
- 1.1. United States
- 1.2. Canada
- 1.3. Mexico
-
2. South America
- 2.1. Brazil
- 2.2. Argentina
- 2.3. Rest of South America
-
3. Europe
- 3.1. United Kingdom
- 3.2. Germany
- 3.3. France
- 3.4. Italy
- 3.5. Spain
- 3.6. Russia
- 3.7. Benelux
- 3.8. Nordics
- 3.9. Rest of Europe
-
4. Middle East & Africa
- 4.1. Turkey
- 4.2. Israel
- 4.3. GCC
- 4.4. North Africa
- 4.5. South Africa
- 4.6. Rest of Middle East & Africa
-
5. Asia Pacific
- 5.1. China
- 5.2. India
- 5.3. Japan
- 5.4. South Korea
- 5.5. ASEAN
- 5.6. Oceania
- 5.7. Rest of Asia Pacific
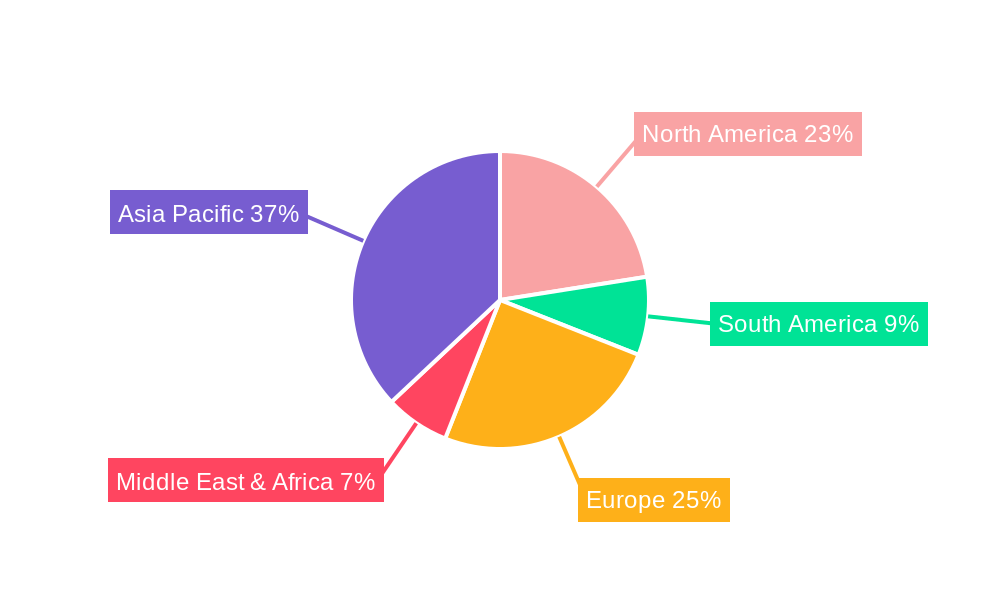
Optronics Device Regional Market Share
Geographic Coverage of Optronics Device
Optronics Device REPORT HIGHLIGHTS
| Aspects | Details |
|---|---|
| Study Period | 2020-2034 |
| Base Year | 2025 |
| Estimated Year | 2026 |
| Forecast Period | 2026-2034 |
| Historical Period | 2020-2025 |
| Growth Rate | CAGR of XX% from 2020-2034 |
| Segmentation |
|
Table of Contents
- 1. Introduction
- 1.1. Research Scope
- 1.2. Market Segmentation
- 1.3. Research Methodology
- 1.4. Definitions and Assumptions
- 2. Executive Summary
- 2.1. Introduction
- 3. Market Dynamics
- 3.1. Introduction
- 3.2. Market Drivers
- 3.3. Market Restrains
- 3.4. Market Trends
- 4. Market Factor Analysis
- 4.1. Porters Five Forces
- 4.2. Supply/Value Chain
- 4.3. PESTEL analysis
- 4.4. Market Entropy
- 4.5. Patent/Trademark Analysis
- 5. Global Optronics Device Analysis, Insights and Forecast, 2020-2032
- 5.1. Market Analysis, Insights and Forecast - by Application
- 5.1.1. Residential & Commercial
- 5.1.2. Automotive
- 5.1.3. Consumer Electronics
- 5.1.4. Telecommunication
- 5.1.5. Industrial
- 5.1.6. Healthcare
- 5.1.7. Others
- 5.2. Market Analysis, Insights and Forecast - by Types
- 5.2.1. LEDs
- 5.2.2. Photodiodes
- 5.2.3. Laser Diodes
- 5.2.4. Optocouplers
- 5.2.5. Others
- 5.3. Market Analysis, Insights and Forecast - by Region
- 5.3.1. North America
- 5.3.2. South America
- 5.3.3. Europe
- 5.3.4. Middle East & Africa
- 5.3.5. Asia Pacific
- 5.1. Market Analysis, Insights and Forecast - by Application
- 6. North America Optronics Device Analysis, Insights and Forecast, 2020-2032
- 6.1. Market Analysis, Insights and Forecast - by Application
- 6.1.1. Residential & Commercial
- 6.1.2. Automotive
- 6.1.3. Consumer Electronics
- 6.1.4. Telecommunication
- 6.1.5. Industrial
- 6.1.6. Healthcare
- 6.1.7. Others
- 6.2. Market Analysis, Insights and Forecast - by Types
- 6.2.1. LEDs
- 6.2.2. Photodiodes
- 6.2.3. Laser Diodes
- 6.2.4. Optocouplers
- 6.2.5. Others
- 6.1. Market Analysis, Insights and Forecast - by Application
- 7. South America Optronics Device Analysis, Insights and Forecast, 2020-2032
- 7.1. Market Analysis, Insights and Forecast - by Application
- 7.1.1. Residential & Commercial
- 7.1.2. Automotive
- 7.1.3. Consumer Electronics
- 7.1.4. Telecommunication
- 7.1.5. Industrial
- 7.1.6. Healthcare
- 7.1.7. Others
- 7.2. Market Analysis, Insights and Forecast - by Types
- 7.2.1. LEDs
- 7.2.2. Photodiodes
- 7.2.3. Laser Diodes
- 7.2.4. Optocouplers
- 7.2.5. Others
- 7.1. Market Analysis, Insights and Forecast - by Application
- 8. Europe Optronics Device Analysis, Insights and Forecast, 2020-2032
- 8.1. Market Analysis, Insights and Forecast - by Application
- 8.1.1. Residential & Commercial
- 8.1.2. Automotive
- 8.1.3. Consumer Electronics
- 8.1.4. Telecommunication
- 8.1.5. Industrial
- 8.1.6. Healthcare
- 8.1.7. Others
- 8.2. Market Analysis, Insights and Forecast - by Types
- 8.2.1. LEDs
- 8.2.2. Photodiodes
- 8.2.3. Laser Diodes
- 8.2.4. Optocouplers
- 8.2.5. Others
- 8.1. Market Analysis, Insights and Forecast - by Application
- 9. Middle East & Africa Optronics Device Analysis, Insights and Forecast, 2020-2032
- 9.1. Market Analysis, Insights and Forecast - by Application
- 9.1.1. Residential & Commercial
- 9.1.2. Automotive
- 9.1.3. Consumer Electronics
- 9.1.4. Telecommunication
- 9.1.5. Industrial
- 9.1.6. Healthcare
- 9.1.7. Others
- 9.2. Market Analysis, Insights and Forecast - by Types
- 9.2.1. LEDs
- 9.2.2. Photodiodes
- 9.2.3. Laser Diodes
- 9.2.4. Optocouplers
- 9.2.5. Others
- 9.1. Market Analysis, Insights and Forecast - by Application
- 10. Asia Pacific Optronics Device Analysis, Insights and Forecast, 2020-2032
- 10.1. Market Analysis, Insights and Forecast - by Application
- 10.1.1. Residential & Commercial
- 10.1.2. Automotive
- 10.1.3. Consumer Electronics
- 10.1.4. Telecommunication
- 10.1.5. Industrial
- 10.1.6. Healthcare
- 10.1.7. Others
- 10.2. Market Analysis, Insights and Forecast - by Types
- 10.2.1. LEDs
- 10.2.2. Photodiodes
- 10.2.3. Laser Diodes
- 10.2.4. Optocouplers
- 10.2.5. Others
- 10.1. Market Analysis, Insights and Forecast - by Application
- 11. Competitive Analysis
- 11.1. Global Market Share Analysis 2025
- 11.2. Company Profiles
- 11.2.1 Nichia
- 11.2.1.1. Overview
- 11.2.1.2. Products
- 11.2.1.3. SWOT Analysis
- 11.2.1.4. Recent Developments
- 11.2.1.5. Financials (Based on Availability)
- 11.2.2 Osram
- 11.2.2.1. Overview
- 11.2.2.2. Products
- 11.2.2.3. SWOT Analysis
- 11.2.2.4. Recent Developments
- 11.2.2.5. Financials (Based on Availability)
- 11.2.3 Samsung
- 11.2.3.1. Overview
- 11.2.3.2. Products
- 11.2.3.3. SWOT Analysis
- 11.2.3.4. Recent Developments
- 11.2.3.5. Financials (Based on Availability)
- 11.2.4 Lumileds
- 11.2.4.1. Overview
- 11.2.4.2. Products
- 11.2.4.3. SWOT Analysis
- 11.2.4.4. Recent Developments
- 11.2.4.5. Financials (Based on Availability)
- 11.2.5 Cree
- 11.2.5.1. Overview
- 11.2.5.2. Products
- 11.2.5.3. SWOT Analysis
- 11.2.5.4. Recent Developments
- 11.2.5.5. Financials (Based on Availability)
- 11.2.6 Seoul Semiconductor
- 11.2.6.1. Overview
- 11.2.6.2. Products
- 11.2.6.3. SWOT Analysis
- 11.2.6.4. Recent Developments
- 11.2.6.5. Financials (Based on Availability)
- 11.2.7 Everlight
- 11.2.7.1. Overview
- 11.2.7.2. Products
- 11.2.7.3. SWOT Analysis
- 11.2.7.4. Recent Developments
- 11.2.7.5. Financials (Based on Availability)
- 11.2.8 LG Innoteck
- 11.2.8.1. Overview
- 11.2.8.2. Products
- 11.2.8.3. SWOT Analysis
- 11.2.8.4. Recent Developments
- 11.2.8.5. Financials (Based on Availability)
- 11.2.9 Epister
- 11.2.9.1. Overview
- 11.2.9.2. Products
- 11.2.9.3. SWOT Analysis
- 11.2.9.4. Recent Developments
- 11.2.9.5. Financials (Based on Availability)
- 11.2.10 Liteon
- 11.2.10.1. Overview
- 11.2.10.2. Products
- 11.2.10.3. SWOT Analysis
- 11.2.10.4. Recent Developments
- 11.2.10.5. Financials (Based on Availability)
- 11.2.11 Avago
- 11.2.11.1. Overview
- 11.2.11.2. Products
- 11.2.11.3. SWOT Analysis
- 11.2.11.4. Recent Developments
- 11.2.11.5. Financials (Based on Availability)
- 11.2.12 Vishay
- 11.2.12.1. Overview
- 11.2.12.2. Products
- 11.2.12.3. SWOT Analysis
- 11.2.12.4. Recent Developments
- 11.2.12.5. Financials (Based on Availability)
- 11.2.13 Fairchild
- 11.2.13.1. Overview
- 11.2.13.2. Products
- 11.2.13.3. SWOT Analysis
- 11.2.13.4. Recent Developments
- 11.2.13.5. Financials (Based on Availability)
- 11.2.14 Renesas Electronics
- 11.2.14.1. Overview
- 11.2.14.2. Products
- 11.2.14.3. SWOT Analysis
- 11.2.14.4. Recent Developments
- 11.2.14.5. Financials (Based on Availability)
- 11.2.15 MLS Lighting
- 11.2.15.1. Overview
- 11.2.15.2. Products
- 11.2.15.3. SWOT Analysis
- 11.2.15.4. Recent Developments
- 11.2.15.5. Financials (Based on Availability)
- 11.2.16 IPG
- 11.2.16.1. Overview
- 11.2.16.2. Products
- 11.2.16.3. SWOT Analysis
- 11.2.16.4. Recent Developments
- 11.2.16.5. Financials (Based on Availability)
- 11.2.17 Coherent
- 11.2.17.1. Overview
- 11.2.17.2. Products
- 11.2.17.3. SWOT Analysis
- 11.2.17.4. Recent Developments
- 11.2.17.5. Financials (Based on Availability)
- 11.2.18 Jenoptik
- 11.2.18.1. Overview
- 11.2.18.2. Products
- 11.2.18.3. SWOT Analysis
- 11.2.18.4. Recent Developments
- 11.2.18.5. Financials (Based on Availability)
- 11.2.1 Nichia
List of Figures
- Figure 1: Global Optronics Device Revenue Breakdown (million, %) by Region 2025 & 2033
- Figure 2: Global Optronics Device Volume Breakdown (K, %) by Region 2025 & 2033
- Figure 3: North America Optronics Device Revenue (million), by Application 2025 & 2033
- Figure 4: North America Optronics Device Volume (K), by Application 2025 & 2033
- Figure 5: North America Optronics Device Revenue Share (%), by Application 2025 & 2033
- Figure 6: North America Optronics Device Volume Share (%), by Application 2025 & 2033
- Figure 7: North America Optronics Device Revenue (million), by Types 2025 & 2033
- Figure 8: North America Optronics Device Volume (K), by Types 2025 & 2033
- Figure 9: North America Optronics Device Revenue Share (%), by Types 2025 & 2033
- Figure 10: North America Optronics Device Volume Share (%), by Types 2025 & 2033
- Figure 11: North America Optronics Device Revenue (million), by Country 2025 & 2033
- Figure 12: North America Optronics Device Volume (K), by Country 2025 & 2033
- Figure 13: North America Optronics Device Revenue Share (%), by Country 2025 & 2033
- Figure 14: North America Optronics Device Volume Share (%), by Country 2025 & 2033
- Figure 15: South America Optronics Device Revenue (million), by Application 2025 & 2033
- Figure 16: South America Optronics Device Volume (K), by Application 2025 & 2033
- Figure 17: South America Optronics Device Revenue Share (%), by Application 2025 & 2033
- Figure 18: South America Optronics Device Volume Share (%), by Application 2025 & 2033
- Figure 19: South America Optronics Device Revenue (million), by Types 2025 & 2033
- Figure 20: South America Optronics Device Volume (K), by Types 2025 & 2033
- Figure 21: South America Optronics Device Revenue Share (%), by Types 2025 & 2033
- Figure 22: South America Optronics Device Volume Share (%), by Types 2025 & 2033
- Figure 23: South America Optronics Device Revenue (million), by Country 2025 & 2033
- Figure 24: South America Optronics Device Volume (K), by Country 2025 & 2033
- Figure 25: South America Optronics Device Revenue Share (%), by Country 2025 & 2033
- Figure 26: South America Optronics Device Volume Share (%), by Country 2025 & 2033
- Figure 27: Europe Optronics Device Revenue (million), by Application 2025 & 2033
- Figure 28: Europe Optronics Device Volume (K), by Application 2025 & 2033
- Figure 29: Europe Optronics Device Revenue Share (%), by Application 2025 & 2033
- Figure 30: Europe Optronics Device Volume Share (%), by Application 2025 & 2033
- Figure 31: Europe Optronics Device Revenue (million), by Types 2025 & 2033
- Figure 32: Europe Optronics Device Volume (K), by Types 2025 & 2033
- Figure 33: Europe Optronics Device Revenue Share (%), by Types 2025 & 2033
- Figure 34: Europe Optronics Device Volume Share (%), by Types 2025 & 2033
- Figure 35: Europe Optronics Device Revenue (million), by Country 2025 & 2033
- Figure 36: Europe Optronics Device Volume (K), by Country 2025 & 2033
- Figure 37: Europe Optronics Device Revenue Share (%), by Country 2025 & 2033
- Figure 38: Europe Optronics Device Volume Share (%), by Country 2025 & 2033
- Figure 39: Middle East & Africa Optronics Device Revenue (million), by Application 2025 & 2033
- Figure 40: Middle East & Africa Optronics Device Volume (K), by Application 2025 & 2033
- Figure 41: Middle East & Africa Optronics Device Revenue Share (%), by Application 2025 & 2033
- Figure 42: Middle East & Africa Optronics Device Volume Share (%), by Application 2025 & 2033
- Figure 43: Middle East & Africa Optronics Device Revenue (million), by Types 2025 & 2033
- Figure 44: Middle East & Africa Optronics Device Volume (K), by Types 2025 & 2033
- Figure 45: Middle East & Africa Optronics Device Revenue Share (%), by Types 2025 & 2033
- Figure 46: Middle East & Africa Optronics Device Volume Share (%), by Types 2025 & 2033
- Figure 47: Middle East & Africa Optronics Device Revenue (million), by Country 2025 & 2033
- Figure 48: Middle East & Africa Optronics Device Volume (K), by Country 2025 & 2033
- Figure 49: Middle East & Africa Optronics Device Revenue Share (%), by Country 2025 & 2033
- Figure 50: Middle East & Africa Optronics Device Volume Share (%), by Country 2025 & 2033
- Figure 51: Asia Pacific Optronics Device Revenue (million), by Application 2025 & 2033
- Figure 52: Asia Pacific Optronics Device Volume (K), by Application 2025 & 2033
- Figure 53: Asia Pacific Optronics Device Revenue Share (%), by Application 2025 & 2033
- Figure 54: Asia Pacific Optronics Device Volume Share (%), by Application 2025 & 2033
- Figure 55: Asia Pacific Optronics Device Revenue (million), by Types 2025 & 2033
- Figure 56: Asia Pacific Optronics Device Volume (K), by Types 2025 & 2033
- Figure 57: Asia Pacific Optronics Device Revenue Share (%), by Types 2025 & 2033
- Figure 58: Asia Pacific Optronics Device Volume Share (%), by Types 2025 & 2033
- Figure 59: Asia Pacific Optronics Device Revenue (million), by Country 2025 & 2033
- Figure 60: Asia Pacific Optronics Device Volume (K), by Country 2025 & 2033
- Figure 61: Asia Pacific Optronics Device Revenue Share (%), by Country 2025 & 2033
- Figure 62: Asia Pacific Optronics Device Volume Share (%), by Country 2025 & 2033
List of Tables
- Table 1: Global Optronics Device Revenue million Forecast, by Application 2020 & 2033
- Table 2: Global Optronics Device Volume K Forecast, by Application 2020 & 2033
- Table 3: Global Optronics Device Revenue million Forecast, by Types 2020 & 2033
- Table 4: Global Optronics Device Volume K Forecast, by Types 2020 & 2033
- Table 5: Global Optronics Device Revenue million Forecast, by Region 2020 & 2033
- Table 6: Global Optronics Device Volume K Forecast, by Region 2020 & 2033
- Table 7: Global Optronics Device Revenue million Forecast, by Application 2020 & 2033
- Table 8: Global Optronics Device Volume K Forecast, by Application 2020 & 2033
- Table 9: Global Optronics Device Revenue million Forecast, by Types 2020 & 2033
- Table 10: Global Optronics Device Volume K Forecast, by Types 2020 & 2033
- Table 11: Global Optronics Device Revenue million Forecast, by Country 2020 & 2033
- Table 12: Global Optronics Device Volume K Forecast, by Country 2020 & 2033
- Table 13: United States Optronics Device Revenue (million) Forecast, by Application 2020 & 2033
- Table 14: United States Optronics Device Volume (K) Forecast, by Application 2020 & 2033
- Table 15: Canada Optronics Device Revenue (million) Forecast, by Application 2020 & 2033
- Table 16: Canada Optronics Device Volume (K) Forecast, by Application 2020 & 2033
- Table 17: Mexico Optronics Device Revenue (million) Forecast, by Application 2020 & 2033
- Table 18: Mexico Optronics Device Volume (K) Forecast, by Application 2020 & 2033
- Table 19: Global Optronics Device Revenue million Forecast, by Application 2020 & 2033
- Table 20: Global Optronics Device Volume K Forecast, by Application 2020 & 2033
- Table 21: Global Optronics Device Revenue million Forecast, by Types 2020 & 2033
- Table 22: Global Optronics Device Volume K Forecast, by Types 2020 & 2033
- Table 23: Global Optronics Device Revenue million Forecast, by Country 2020 & 2033
- Table 24: Global Optronics Device Volume K Forecast, by Country 2020 & 2033
- Table 25: Brazil Optronics Device Revenue (million) Forecast, by Application 2020 & 2033
- Table 26: Brazil Optronics Device Volume (K) Forecast, by Application 2020 & 2033
- Table 27: Argentina Optronics Device Revenue (million) Forecast, by Application 2020 & 2033
- Table 28: Argentina Optronics Device Volume (K) Forecast, by Application 2020 & 2033
- Table 29: Rest of South America Optronics Device Revenue (million) Forecast, by Application 2020 & 2033
- Table 30: Rest of South America Optronics Device Volume (K) Forecast, by Application 2020 & 2033
- Table 31: Global Optronics Device Revenue million Forecast, by Application 2020 & 2033
- Table 32: Global Optronics Device Volume K Forecast, by Application 2020 & 2033
- Table 33: Global Optronics Device Revenue million Forecast, by Types 2020 & 2033
- Table 34: Global Optronics Device Volume K Forecast, by Types 2020 & 2033
- Table 35: Global Optronics Device Revenue million Forecast, by Country 2020 & 2033
- Table 36: Global Optronics Device Volume K Forecast, by Country 2020 & 2033
- Table 37: United Kingdom Optronics Device Revenue (million) Forecast, by Application 2020 & 2033
- Table 38: United Kingdom Optronics Device Volume (K) Forecast, by Application 2020 & 2033
- Table 39: Germany Optronics Device Revenue (million) Forecast, by Application 2020 & 2033
- Table 40: Germany Optronics Device Volume (K) Forecast, by Application 2020 & 2033
- Table 41: France Optronics Device Revenue (million) Forecast, by Application 2020 & 2033
- Table 42: France Optronics Device Volume (K) Forecast, by Application 2020 & 2033
- Table 43: Italy Optronics Device Revenue (million) Forecast, by Application 2020 & 2033
- Table 44: Italy Optronics Device Volume (K) Forecast, by Application 2020 & 2033
- Table 45: Spain Optronics Device Revenue (million) Forecast, by Application 2020 & 2033
- Table 46: Spain Optronics Device Volume (K) Forecast, by Application 2020 & 2033
- Table 47: Russia Optronics Device Revenue (million) Forecast, by Application 2020 & 2033
- Table 48: Russia Optronics Device Volume (K) Forecast, by Application 2020 & 2033
- Table 49: Benelux Optronics Device Revenue (million) Forecast, by Application 2020 & 2033
- Table 50: Benelux Optronics Device Volume (K) Forecast, by Application 2020 & 2033
- Table 51: Nordics Optronics Device Revenue (million) Forecast, by Application 2020 & 2033
- Table 52: Nordics Optronics Device Volume (K) Forecast, by Application 2020 & 2033
- Table 53: Rest of Europe Optronics Device Revenue (million) Forecast, by Application 2020 & 2033
- Table 54: Rest of Europe Optronics Device Volume (K) Forecast, by Application 2020 & 2033
- Table 55: Global Optronics Device Revenue million Forecast, by Application 2020 & 2033
- Table 56: Global Optronics Device Volume K Forecast, by Application 2020 & 2033
- Table 57: Global Optronics Device Revenue million Forecast, by Types 2020 & 2033
- Table 58: Global Optronics Device Volume K Forecast, by Types 2020 & 2033
- Table 59: Global Optronics Device Revenue million Forecast, by Country 2020 & 2033
- Table 60: Global Optronics Device Volume K Forecast, by Country 2020 & 2033
- Table 61: Turkey Optronics Device Revenue (million) Forecast, by Application 2020 & 2033
- Table 62: Turkey Optronics Device Volume (K) Forecast, by Application 2020 & 2033
- Table 63: Israel Optronics Device Revenue (million) Forecast, by Application 2020 & 2033
- Table 64: Israel Optronics Device Volume (K) Forecast, by Application 2020 & 2033
- Table 65: GCC Optronics Device Revenue (million) Forecast, by Application 2020 & 2033
- Table 66: GCC Optronics Device Volume (K) Forecast, by Application 2020 & 2033
- Table 67: North Africa Optronics Device Revenue (million) Forecast, by Application 2020 & 2033
- Table 68: North Africa Optronics Device Volume (K) Forecast, by Application 2020 & 2033
- Table 69: South Africa Optronics Device Revenue (million) Forecast, by Application 2020 & 2033
- Table 70: South Africa Optronics Device Volume (K) Forecast, by Application 2020 & 2033
- Table 71: Rest of Middle East & Africa Optronics Device Revenue (million) Forecast, by Application 2020 & 2033
- Table 72: Rest of Middle East & Africa Optronics Device Volume (K) Forecast, by Application 2020 & 2033
- Table 73: Global Optronics Device Revenue million Forecast, by Application 2020 & 2033
- Table 74: Global Optronics Device Volume K Forecast, by Application 2020 & 2033
- Table 75: Global Optronics Device Revenue million Forecast, by Types 2020 & 2033
- Table 76: Global Optronics Device Volume K Forecast, by Types 2020 & 2033
- Table 77: Global Optronics Device Revenue million Forecast, by Country 2020 & 2033
- Table 78: Global Optronics Device Volume K Forecast, by Country 2020 & 2033
- Table 79: China Optronics Device Revenue (million) Forecast, by Application 2020 & 2033
- Table 80: China Optronics Device Volume (K) Forecast, by Application 2020 & 2033
- Table 81: India Optronics Device Revenue (million) Forecast, by Application 2020 & 2033
- Table 82: India Optronics Device Volume (K) Forecast, by Application 2020 & 2033
- Table 83: Japan Optronics Device Revenue (million) Forecast, by Application 2020 & 2033
- Table 84: Japan Optronics Device Volume (K) Forecast, by Application 2020 & 2033
- Table 85: South Korea Optronics Device Revenue (million) Forecast, by Application 2020 & 2033
- Table 86: South Korea Optronics Device Volume (K) Forecast, by Application 2020 & 2033
- Table 87: ASEAN Optronics Device Revenue (million) Forecast, by Application 2020 & 2033
- Table 88: ASEAN Optronics Device Volume (K) Forecast, by Application 2020 & 2033
- Table 89: Oceania Optronics Device Revenue (million) Forecast, by Application 2020 & 2033
- Table 90: Oceania Optronics Device Volume (K) Forecast, by Application 2020 & 2033
- Table 91: Rest of Asia Pacific Optronics Device Revenue (million) Forecast, by Application 2020 & 2033
- Table 92: Rest of Asia Pacific Optronics Device Volume (K) Forecast, by Application 2020 & 2033
Frequently Asked Questions
1. What is the projected Compound Annual Growth Rate (CAGR) of the Optronics Device?
The projected CAGR is approximately XX%.
2. Which companies are prominent players in the Optronics Device?
Key companies in the market include Nichia, Osram, Samsung, Lumileds, Cree, Seoul Semiconductor, Everlight, LG Innoteck, Epister, Liteon, Avago, Vishay, Fairchild, Renesas Electronics, MLS Lighting, IPG, Coherent, Jenoptik.
3. What are the main segments of the Optronics Device?
The market segments include Application, Types.
4. Can you provide details about the market size?
The market size is estimated to be USD XXX million as of 2022.
5. What are some drivers contributing to market growth?
N/A
6. What are the notable trends driving market growth?
N/A
7. Are there any restraints impacting market growth?
N/A
8. Can you provide examples of recent developments in the market?
N/A
9. What pricing options are available for accessing the report?
Pricing options include single-user, multi-user, and enterprise licenses priced at USD 3350.00, USD 5025.00, and USD 6700.00 respectively.
10. Is the market size provided in terms of value or volume?
The market size is provided in terms of value, measured in million and volume, measured in K.
11. Are there any specific market keywords associated with the report?
Yes, the market keyword associated with the report is "Optronics Device," which aids in identifying and referencing the specific market segment covered.
12. How do I determine which pricing option suits my needs best?
The pricing options vary based on user requirements and access needs. Individual users may opt for single-user licenses, while businesses requiring broader access may choose multi-user or enterprise licenses for cost-effective access to the report.
13. Are there any additional resources or data provided in the Optronics Device report?
While the report offers comprehensive insights, it's advisable to review the specific contents or supplementary materials provided to ascertain if additional resources or data are available.
14. How can I stay updated on further developments or reports in the Optronics Device?
To stay informed about further developments, trends, and reports in the Optronics Device, consider subscribing to industry newsletters, following relevant companies and organizations, or regularly checking reputable industry news sources and publications.
Methodology
Step 1 - Identification of Relevant Samples Size from Population Database


Step 2 - Approaches for Defining Global Market Size (Value, Volume* & Price*)

Note*: In applicable scenarios
Step 3 - Data Sources
Primary Research
- Web Analytics
- Survey Reports
- Research Institute
- Latest Research Reports
- Opinion Leaders
Secondary Research
- Annual Reports
- White Paper
- Latest Press Release
- Industry Association
- Paid Database
- Investor Presentations

Step 4 - Data Triangulation
Involves using different sources of information in order to increase the validity of a study
These sources are likely to be stakeholders in a program - participants, other researchers, program staff, other community members, and so on.
Then we put all data in single framework & apply various statistical tools to find out the dynamic on the market.
During the analysis stage, feedback from the stakeholder groups would be compared to determine areas of agreement as well as areas of divergence