

Key Insights
The global online lottery market, valued at $19.43 billion in the base year 2025, is projected to grow at a Compound Annual Growth Rate (CAGR) of 9.5% through 2033. This growth trajectory, while moderate, signals ongoing market maturation and persistent expansion opportunities. Key catalysts include widespread smartphone adoption, the escalating appeal of online gaming, and the inherent convenience of digital platforms. Emerging trends, such as advanced mobile application integration featuring intuitive interfaces and gamified elements, are actively reshaping consumer engagement. Conversely, stringent regulatory landscapes and the imperative of responsible gambling present significant market constraints.
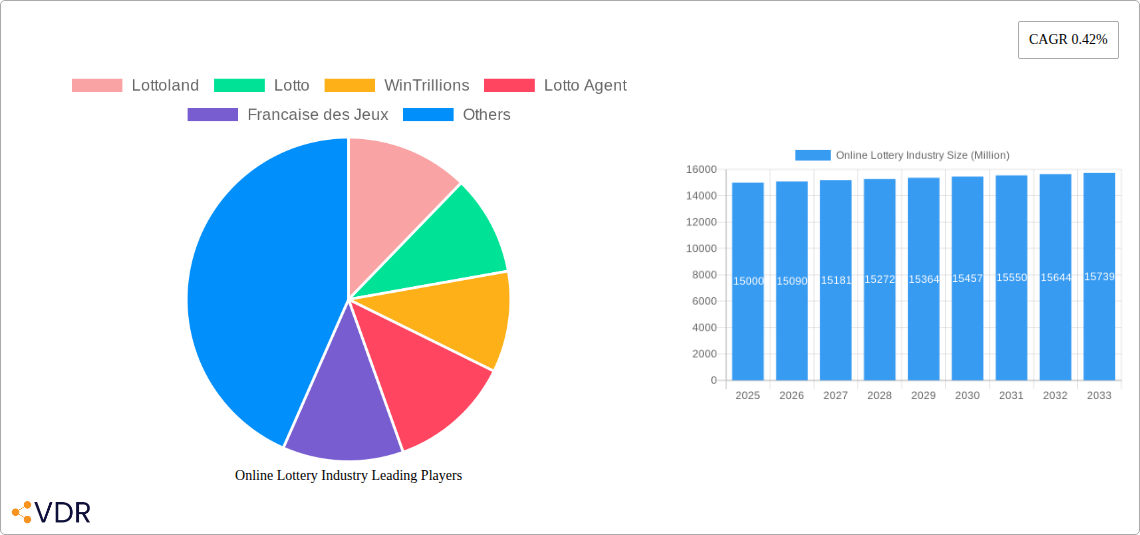
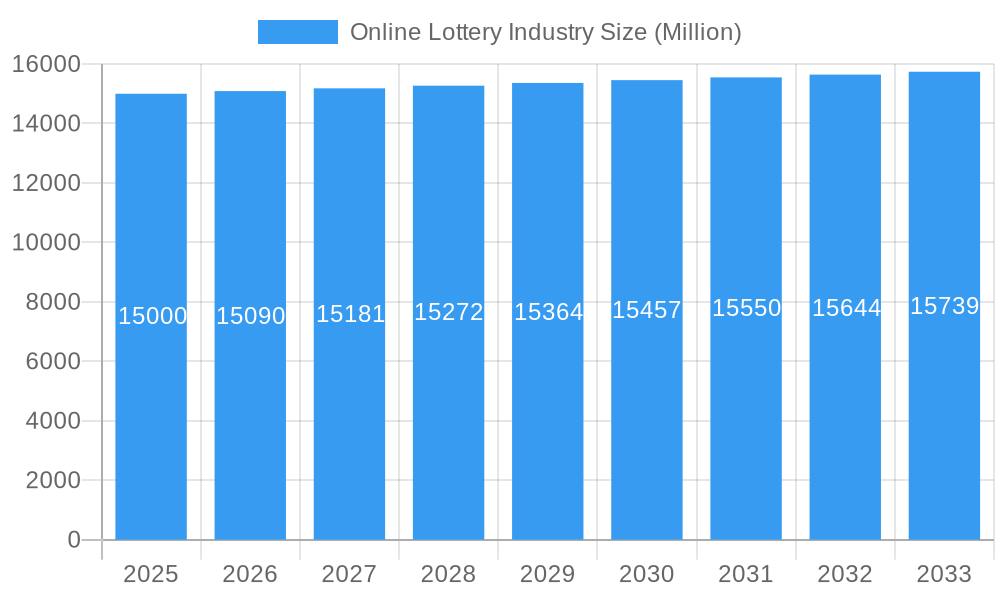
Online Lottery Industry Market Size (In Billion)
The market is segmented by end-user (desktop and mobile) and product type (lotto, sports betting, video lottery terminals (VLTs), scratch cards, and others). The mobile segment is anticipated to lead due to its unparalleled accessibility and user convenience. Lotto and scratch cards currently represent the largest product categories, with sports betting poised for substantial expansion, fueled by increasing popularity and expanding legalization across diverse regions. The competitive arena is characterized by the presence of major international operators such as Lottoland, Lotto, WinTrillions, and Camelot Group, alongside regional and specialized niche players. Geographically, North America and Europe command significant market share, supported by well-established online gaming infrastructure and high internet penetration rates. The Asia Pacific region offers considerable growth potential, albeit influenced by regulatory complexities and varying levels of digital access.
Online Lottery Industry Company Market Share
Sustained expansion within the online lottery sector will depend on agile adaptation to evolving regulatory environments, reinforced commitment to responsible gambling practices, and continuous enhancement of user experience. Innovative product development, personalized promotional strategies, and strategic alliances with established gaming entities will be pivotal for long-term success. The distinct regional market dynamics necessitate localized strategies that account for specific regulations, cultural nuances, and technological infrastructure. Companies demonstrating robust security protocols and comprehensive compliance frameworks will secure a competitive advantage, fostering trust and customer loyalty in a sector highly sensitive to security and ethical considerations. Future market trajectory will be shaped by the effective navigation of these challenges and the astute capitalization on emerging technological advancements.
Online Lottery Industry Market Report: 2019-2033
This comprehensive report provides a detailed analysis of the global online lottery industry, encompassing market dynamics, growth trends, competitive landscape, and future outlook. With a study period spanning 2019-2033, a base year of 2025, and a forecast period of 2025-2033, this report is an invaluable resource for industry professionals, investors, and anyone seeking to understand this dynamic sector. The report leverages extensive data analysis to provide actionable insights into the parent market (Gambling and Gaming) and child markets (Online Lottery) for informed decision-making. The total market size is projected to reach xx Million by 2033.
Online Lottery Industry Market Dynamics & Structure
The online lottery market is a dynamic and evolving sector characterized by a moderate level of concentration. Leading operators such as Lottoland, Lotto, WinTrillions, and ZEAL Network SE command a significant share, but the landscape is also influenced by emerging players and innovative platforms. A paramount driver of this market is continuous technological innovation. This includes the widespread adoption of mobile gaming, enabling players to participate anytime, anywhere, and the development of sophisticated, secure payment processing systems that enhance convenience and trust. The regulatory environment presents a complex tapestry, varying considerably across different jurisdictions. While these diverse frameworks can pose challenges, they also create unique opportunities for operators who can navigate them effectively. The competitive arena is broad, with other forms of online gambling, such as online casinos and sports betting, acting as significant substitutes that can impact market penetration and player acquisition strategies. End-user demographics are notably diversifying; we're witnessing a growing influx of younger audiences who are increasingly comfortable and engaged with digital platforms. Looking ahead, Mergers & Acquisitions (M&A) activity is anticipated to remain robust, as established, larger players strategically seek to consolidate their market positions and expand their reach through acquisitions of smaller operators or complementary businesses.
- Market Concentration: Moderately concentrated, with top 5 players holding an estimated 65-75% market share in 2024.
- Technological Drivers: Advanced mobile gaming platforms, secure and diverse payment gateways (including e-wallets and cryptocurrencies), intuitive and gamified user interfaces, AI-powered personalization, and robust data analytics.
- Regulatory Landscape: Highly fragmented and evolving, with strict regulations in some established markets and more liberal approaches in others. Ongoing legislative changes are a key factor to monitor.
- Competitive Substitutes: Online casino games, live dealer games, sports betting, fantasy sports, poker, and other forms of digital entertainment offering immediate gratification.
- End-User Demographics: Rapidly shifting towards younger demographics (millennials and Gen Z) with increased mobile device penetration, a preference for instant results, and a growing interest in gamified experiences.
- M&A Trends: Consolidation is expected to accelerate, with larger, well-funded players acquiring smaller operators to gain market share, access new technologies, or enter new geographic regions. An estimated 15-25 significant M&A deals are projected in 2024.
Online Lottery Industry Growth Trends & Insights
The online lottery market has witnessed significant growth over the past few years, driven by increasing internet penetration, the rising popularity of online gaming, and the convenience of playing lotteries from anywhere. The Compound Annual Growth Rate (CAGR) during the historical period (2019-2024) was xx%, and is projected to reach xx% during the forecast period (2025-2033). Technological advancements, such as mobile apps and improved user interfaces, have significantly impacted adoption rates. Consumer behavior shifts towards digital platforms continue to fuel market growth, leading to higher market penetration in mature markets and rapid growth in emerging markets. Market size is expected to reach xx Million in 2025 and xx Million by 2033. Changing consumer preferences towards instant-win games and personalized experiences are creating new opportunities.
Dominant Regions, Countries, or Segments in Online Lottery Industry
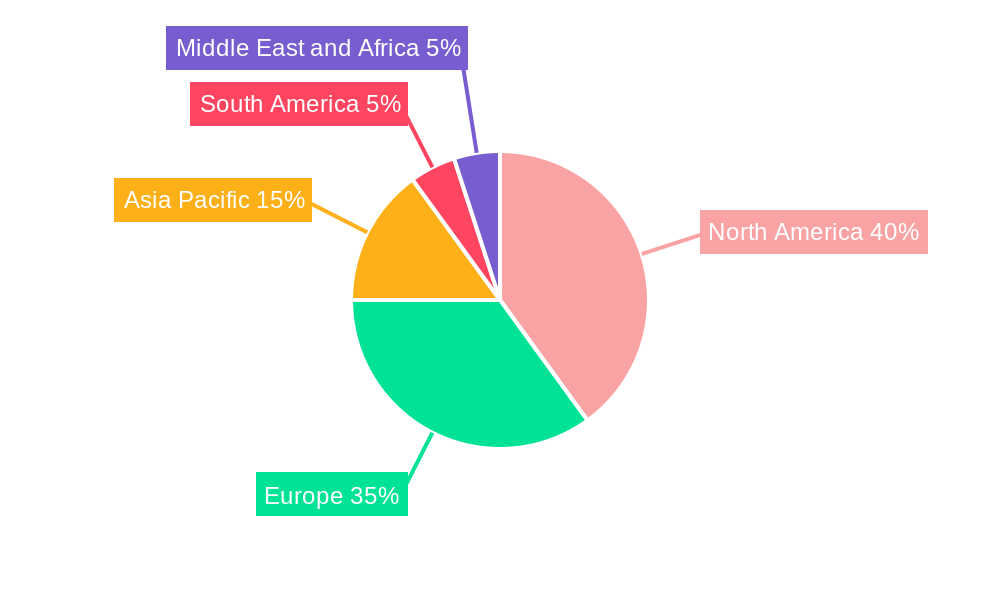
The North American and European markets currently dominate the online lottery industry, accounting for xx% of the global market share in 2024. However, Asia-Pacific is projected to experience the fastest growth rate due to expanding internet access and rising disposable incomes. Within product segments, Lotto remains the most popular, followed by scratch cards. Mobile is the fastest-growing end-user segment, surpassing desktop usage.
- Key Drivers (North America & Europe): Established regulatory frameworks, high internet penetration, high disposable incomes.
- Key Drivers (Asia-Pacific): Rapidly expanding internet and mobile penetration, rising middle class.
- Segment Dominance: Lotto (xx% market share), followed by scratch cards and VLTs.
- End-User Dominance: Mobile is the leading segment, expected to reach xx% market share by 2033.
Online Lottery Industry Product Landscape
The online lottery market presents a rich and diverse product portfolio designed to cater to a wide spectrum of player preferences. Beyond the traditional lottos that mimic terrestrial equivalents, the sector encompasses a variety of engaging options. These include innovative sports betting integrations, where lottery-style mechanics are applied to sporting events, and Virtual Lottery Terminals (VLTs) offering instant win games with dynamic graphics. Digital scratch cards, designed for quick play and immediate results, are also a significant segment. A key focus for innovation is on elevating the user experience. This is achieved through mobile-first designs that are intuitive and responsive, personalized game recommendations driven by player data, and the introduction of novel game formats that blend elements of chance with engaging gameplay. The integration of emerging technologies like blockchain is also gaining traction, holding the potential to revolutionize trust and transparency by providing immutable records of draws and transactions. Key performance indicators that define success in this landscape include robust ticket sales, sustained user engagement metrics, and a healthy Average Revenue Per User (ARPU), all of which are closely monitored and optimized.
Key Drivers, Barriers & Challenges in Online Lottery Industry
Key Drivers: Increasing internet and smartphone penetration, rising disposable incomes in emerging markets, legalization and regulation in new jurisdictions, and the development of innovative game formats and platforms.
Key Challenges: Stringent regulatory requirements, competition from other forms of online gambling, security and fraud concerns (estimated to cost the industry xx Million annually), and the need for robust anti-money laundering (AML) and know-your-customer (KYC) compliance.
Emerging Opportunities in Online Lottery Industry
The online lottery industry is ripe with untapped potential, presenting significant opportunities for growth and innovation. A major frontier lies in expanding into developing countries, where increasing internet penetration and a burgeoning middle class represent a vast, underserved market. The continued rise of mobile gaming is a critical enabler, allowing for more accessible and engaging lottery experiences. Furthermore, the development of social lottery platforms, which integrate community and interactive elements, offers a compelling avenue for player acquisition and retention. The transformative potential of blockchain technology cannot be overstated; its application promises enhanced security, verifiable fairness, and greater transparency, which are crucial for building player trust. Looking towards the future, personalized gaming experiences, tailored to individual player preferences and behaviors, will become increasingly important. The implementation of sophisticated loyalty programs that reward consistent play and the integration of cutting-edge technologies like Augmented Reality (AR) for immersive gameplay are poised to redefine product development and captivate consumer engagement.
Growth Accelerators in the Online Lottery Industry
Several key factors are acting as significant growth accelerators for the online lottery industry. Foremost among these are technological advancements. Innovations such as the creation of seamless, intuitive mobile interfaces and the pioneering integration of blockchain technology for enhanced security and transparency are pivotal. Strategic partnerships between established online lottery platforms and traditional, land-based lottery operators are proving to be a powerful growth lever, enabling expanded market reach and cross-promotional opportunities. Furthermore, ambitious expansion into new geographic markets, particularly in emerging economies with rapidly growing internet access and a burgeoning consumer base, will contribute substantially to long-term market expansion and revenue growth. The continuous development of novel game mechanics and features that enhance player engagement and offer more varied entertainment will also fuel sustained growth.
Key Players Shaping the Online Lottery Industry Market
- Lottoland
- Lotto
- WinTrillions
- Lotto Agent
- Francaise des Jeux
- Camelot Group
- LottoKings
- ZEAL Network SE
- Lotto Direct Limited
- Annexio Limited
Notable Milestones in Online Lottery Industry Sector
- December 2021: Crypto Millions Lotto launched four new lottery games (India Fantasy 5, India Million Lotto, Powerball+, Mega Millions+).
- February 2022: ZEAL Network SE partnered with Lotto Hessian, providing 15 online instant win games.
- October 2022: ZEAL Network SE expanded internationally, integrating its games into Park Avenue Gaming's platforms in Argentina and Peru.
In-Depth Online Lottery Industry Market Outlook
The future outlook for the online lottery market is exceptionally promising, with consistent and substantial growth anticipated. This trajectory will be underpinned by a confluence of powerful forces, including the relentless pace of technological advancements, the strategic forging of new partnerships, and a concerted push for expansion into underserved and emerging markets. A critical element for success will be an unwavering focus on enhancing the end-user experience. This involves the continued development of mobile-first designs, the introduction of innovative and engaging game formats, and the implementation of personalized player journeys. The competitive landscape will continue to be shaped by strategic acquisitions and collaborations, leading to further market consolidation and the emergence of stronger, more dominant players. The market presents a fertile ground for both established industry giants seeking to fortify their positions and agile new entrants eager to capitalize on evolving consumer preferences, particularly those who can adeptly leverage technological innovation and demonstrate a deep understanding of the changing needs and desires of the modern player.
Online Lottery Industry Segmentation
-
1. End User
- 1.1. Desktop
- 1.2. Mobile
Online Lottery Industry Segmentation By Geography
-
1. North America
- 1.1. United States
- 1.2. Canada
- 1.3. Mexico
- 1.4. Rest of North America
-
2. Europe
- 2.1. Spain
- 2.2. United Kingdom
- 2.3. Germany
- 2.4. France
- 2.5. Italy
- 2.6. Sweden
- 2.7. Rest of Europe
-
3. Asia Pacific
- 3.1. China
- 3.2. India
- 3.3. Japan
- 3.4. Australia
- 3.5. Rest of Asia Pacific
-
4. South America
- 4.1. Brazil
- 4.2. Argentina
- 4.3. Rest of South America
-
5. Middle East and Africa
- 5.1. South Africa
- 5.2. United Arab Emirates
- 5.3. Rest of Middle East and Africa
Online Lottery Industry Regional Market Share
Geographic Coverage of Online Lottery Industry
Online Lottery Industry REPORT HIGHLIGHTS
| Aspects | Details |
|---|---|
| Study Period | 2020-2034 |
| Base Year | 2025 |
| Estimated Year | 2026 |
| Forecast Period | 2026-2034 |
| Historical Period | 2020-2025 |
| Growth Rate | CAGR of 9.5% from 2020-2034 |
| Segmentation |
|
Table of Contents
- 1. Introduction
- 1.1. Research Scope
- 1.2. Market Segmentation
- 1.3. Research Objective
- 1.4. Definitions and Assumptions
- 2. Executive Summary
- 2.1. Market Snapshot
- 3. Market Dynamics
- 3.1. Market Drivers
- 3.2. Market Restrains
- 3.3. Market Trends
- 3.4. Market Opportunities
- 4. Market Factor Analysis
- 4.1. Porters Five Forces
- 4.1.1. Bargaining Power of Suppliers
- 4.1.2. Bargaining Power of Buyers
- 4.1.3. Threat of New Entrants
- 4.1.4. Threat of Substitutes
- 4.1.5. Competitive Rivalry
- 4.2. PESTEL analysis
- 4.3. BCG Analysis
- 4.3.1. Stars (High Growth, High Market Share)
- 4.3.2. Cash Cows (Low Growth, High Market Share)
- 4.3.3. Question Mark (High Growth, Low Market Share)
- 4.3.4. Dogs (Low Growth, Low Market Share)
- 4.4. Ansoff Matrix Analysis
- 4.5. Supply Chain Analysis
- 4.6. Regulatory Landscape
- 4.7. Current Market Potential and Opportunity Assessment (TAM–SAM–SOM Framework)
- 4.8. VDR Analyst Note
- 4.1. Porters Five Forces
- 5. Market Analysis, Insights and Forecast 2021-2033
- 5.1. Market Analysis, Insights and Forecast - by End User
- 5.1.1. Desktop
- 5.1.2. Mobile
- 5.2. Market Analysis, Insights and Forecast - by Region
- 5.2.1. North America
- 5.2.2. Europe
- 5.2.3. Asia Pacific
- 5.2.4. South America
- 5.2.5. Middle East and Africa
- 5.1. Market Analysis, Insights and Forecast - by End User
- 6. Global Online Lottery Industry Analysis, Insights and Forecast, 2021-2033
- 6.1. Market Analysis, Insights and Forecast - by End User
- 6.1.1. Desktop
- 6.1.2. Mobile
- 6.1. Market Analysis, Insights and Forecast - by End User
- 7. North America Online Lottery Industry Analysis, Insights and Forecast, 2021-2033
- 7.1. Market Analysis, Insights and Forecast - by End User
- 7.1.1. Desktop
- 7.1.2. Mobile
- 7.1. Market Analysis, Insights and Forecast - by End User
- 8. Europe Online Lottery Industry Analysis, Insights and Forecast, 2021-2033
- 8.1. Market Analysis, Insights and Forecast - by End User
- 8.1.1. Desktop
- 8.1.2. Mobile
- 8.1. Market Analysis, Insights and Forecast - by End User
- 9. Asia Pacific Online Lottery Industry Analysis, Insights and Forecast, 2021-2033
- 9.1. Market Analysis, Insights and Forecast - by End User
- 9.1.1. Desktop
- 9.1.2. Mobile
- 9.1. Market Analysis, Insights and Forecast - by End User
- 10. South America Online Lottery Industry Analysis, Insights and Forecast, 2021-2033
- 10.1. Market Analysis, Insights and Forecast - by End User
- 10.1.1. Desktop
- 10.1.2. Mobile
- 10.1. Market Analysis, Insights and Forecast - by End User
- 11. Middle East and Africa Online Lottery Industry Analysis, Insights and Forecast, 2021-2033
- 11.1. Market Analysis, Insights and Forecast - by End User
- 11.1.1. Desktop
- 11.1.2. Mobile
- 11.1. Market Analysis, Insights and Forecast - by End User
- 12. Competitive Analysis
- 12.1. Company Profiles
- 12.1.1 Lottoland
- 12.1.1.1. Company Overview
- 12.1.1.2. Products
- 12.1.1.3. Company Financials
- 12.1.1.4. SWOT Analysis
- 12.1.2 Lotto
- 12.1.2.1. Company Overview
- 12.1.2.2. Products
- 12.1.2.3. Company Financials
- 12.1.2.4. SWOT Analysis
- 12.1.3 WinTrillions
- 12.1.3.1. Company Overview
- 12.1.3.2. Products
- 12.1.3.3. Company Financials
- 12.1.3.4. SWOT Analysis
- 12.1.4 Lotto Agent
- 12.1.4.1. Company Overview
- 12.1.4.2. Products
- 12.1.4.3. Company Financials
- 12.1.4.4. SWOT Analysis
- 12.1.5 Francaise des Jeux
- 12.1.5.1. Company Overview
- 12.1.5.2. Products
- 12.1.5.3. Company Financials
- 12.1.5.4. SWOT Analysis
- 12.1.6 Camelot Group
- 12.1.6.1. Company Overview
- 12.1.6.2. Products
- 12.1.6.3. Company Financials
- 12.1.6.4. SWOT Analysis
- 12.1.7 LottoKings
- 12.1.7.1. Company Overview
- 12.1.7.2. Products
- 12.1.7.3. Company Financials
- 12.1.7.4. SWOT Analysis
- 12.1.8 ZEAL Network SE
- 12.1.8.1. Company Overview
- 12.1.8.2. Products
- 12.1.8.3. Company Financials
- 12.1.8.4. SWOT Analysis
- 12.1.9 Lotto Direct Limited
- 12.1.9.1. Company Overview
- 12.1.9.2. Products
- 12.1.9.3. Company Financials
- 12.1.9.4. SWOT Analysis
- 12.1.10 Annexio Limited*List Not Exhaustive
- 12.1.10.1. Company Overview
- 12.1.10.2. Products
- 12.1.10.3. Company Financials
- 12.1.10.4. SWOT Analysis
- 12.1.1 Lottoland
- 12.2. Market Entropy
- 12.2.1 Company's Key Areas Served
- 12.2.2 Recent Developments
- 12.3. Company Market Share Analysis 2025
- 12.3.1 Top 5 Companies Market Share Analysis
- 12.3.2 Top 3 Companies Market Share Analysis
- 12.4. List of Potential Customers
- 13. Research Methodology
List of Figures
- Figure 1: Global Online Lottery Industry Revenue Breakdown (billion, %) by Region 2025 & 2033
- Figure 2: North America Online Lottery Industry Revenue (billion), by End User 2025 & 2033
- Figure 3: North America Online Lottery Industry Revenue Share (%), by End User 2025 & 2033
- Figure 4: North America Online Lottery Industry Revenue (billion), by Country 2025 & 2033
- Figure 5: North America Online Lottery Industry Revenue Share (%), by Country 2025 & 2033
- Figure 6: Europe Online Lottery Industry Revenue (billion), by End User 2025 & 2033
- Figure 7: Europe Online Lottery Industry Revenue Share (%), by End User 2025 & 2033
- Figure 8: Europe Online Lottery Industry Revenue (billion), by Country 2025 & 2033
- Figure 9: Europe Online Lottery Industry Revenue Share (%), by Country 2025 & 2033
- Figure 10: Asia Pacific Online Lottery Industry Revenue (billion), by End User 2025 & 2033
- Figure 11: Asia Pacific Online Lottery Industry Revenue Share (%), by End User 2025 & 2033
- Figure 12: Asia Pacific Online Lottery Industry Revenue (billion), by Country 2025 & 2033
- Figure 13: Asia Pacific Online Lottery Industry Revenue Share (%), by Country 2025 & 2033
- Figure 14: South America Online Lottery Industry Revenue (billion), by End User 2025 & 2033
- Figure 15: South America Online Lottery Industry Revenue Share (%), by End User 2025 & 2033
- Figure 16: South America Online Lottery Industry Revenue (billion), by Country 2025 & 2033
- Figure 17: South America Online Lottery Industry Revenue Share (%), by Country 2025 & 2033
- Figure 18: Middle East and Africa Online Lottery Industry Revenue (billion), by End User 2025 & 2033
- Figure 19: Middle East and Africa Online Lottery Industry Revenue Share (%), by End User 2025 & 2033
- Figure 20: Middle East and Africa Online Lottery Industry Revenue (billion), by Country 2025 & 2033
- Figure 21: Middle East and Africa Online Lottery Industry Revenue Share (%), by Country 2025 & 2033
List of Tables
- Table 1: Global Online Lottery Industry Revenue billion Forecast, by End User 2020 & 2033
- Table 2: Global Online Lottery Industry Revenue billion Forecast, by Region 2020 & 2033
- Table 3: Global Online Lottery Industry Revenue billion Forecast, by End User 2020 & 2033
- Table 4: Global Online Lottery Industry Revenue billion Forecast, by Country 2020 & 2033
- Table 5: United States Online Lottery Industry Revenue (billion) Forecast, by Application 2020 & 2033
- Table 6: Canada Online Lottery Industry Revenue (billion) Forecast, by Application 2020 & 2033
- Table 7: Mexico Online Lottery Industry Revenue (billion) Forecast, by Application 2020 & 2033
- Table 8: Rest of North America Online Lottery Industry Revenue (billion) Forecast, by Application 2020 & 2033
- Table 9: Global Online Lottery Industry Revenue billion Forecast, by End User 2020 & 2033
- Table 10: Global Online Lottery Industry Revenue billion Forecast, by Country 2020 & 2033
- Table 11: Spain Online Lottery Industry Revenue (billion) Forecast, by Application 2020 & 2033
- Table 12: United Kingdom Online Lottery Industry Revenue (billion) Forecast, by Application 2020 & 2033
- Table 13: Germany Online Lottery Industry Revenue (billion) Forecast, by Application 2020 & 2033
- Table 14: France Online Lottery Industry Revenue (billion) Forecast, by Application 2020 & 2033
- Table 15: Italy Online Lottery Industry Revenue (billion) Forecast, by Application 2020 & 2033
- Table 16: Sweden Online Lottery Industry Revenue (billion) Forecast, by Application 2020 & 2033
- Table 17: Rest of Europe Online Lottery Industry Revenue (billion) Forecast, by Application 2020 & 2033
- Table 18: Global Online Lottery Industry Revenue billion Forecast, by End User 2020 & 2033
- Table 19: Global Online Lottery Industry Revenue billion Forecast, by Country 2020 & 2033
- Table 20: China Online Lottery Industry Revenue (billion) Forecast, by Application 2020 & 2033
- Table 21: India Online Lottery Industry Revenue (billion) Forecast, by Application 2020 & 2033
- Table 22: Japan Online Lottery Industry Revenue (billion) Forecast, by Application 2020 & 2033
- Table 23: Australia Online Lottery Industry Revenue (billion) Forecast, by Application 2020 & 2033
- Table 24: Rest of Asia Pacific Online Lottery Industry Revenue (billion) Forecast, by Application 2020 & 2033
- Table 25: Global Online Lottery Industry Revenue billion Forecast, by End User 2020 & 2033
- Table 26: Global Online Lottery Industry Revenue billion Forecast, by Country 2020 & 2033
- Table 27: Brazil Online Lottery Industry Revenue (billion) Forecast, by Application 2020 & 2033
- Table 28: Argentina Online Lottery Industry Revenue (billion) Forecast, by Application 2020 & 2033
- Table 29: Rest of South America Online Lottery Industry Revenue (billion) Forecast, by Application 2020 & 2033
- Table 30: Global Online Lottery Industry Revenue billion Forecast, by End User 2020 & 2033
- Table 31: Global Online Lottery Industry Revenue billion Forecast, by Country 2020 & 2033
- Table 32: South Africa Online Lottery Industry Revenue (billion) Forecast, by Application 2020 & 2033
- Table 33: United Arab Emirates Online Lottery Industry Revenue (billion) Forecast, by Application 2020 & 2033
- Table 34: Rest of Middle East and Africa Online Lottery Industry Revenue (billion) Forecast, by Application 2020 & 2033
Frequently Asked Questions
1. What is the projected Compound Annual Growth Rate (CAGR) of the Online Lottery Industry?
The projected CAGR is approximately 9.5%.
2. Which companies are prominent players in the Online Lottery Industry?
Key companies in the market include Lottoland, Lotto, WinTrillions, Lotto Agent, Francaise des Jeux, Camelot Group, LottoKings, ZEAL Network SE, Lotto Direct Limited, Annexio Limited*List Not Exhaustive.
3. What are the main segments of the Online Lottery Industry?
The market segments include End User.
4. Can you provide details about the market size?
The market size is estimated to be USD 19.43 billion as of 2022.
5. What are some drivers contributing to market growth?
Growing Appeal for Multi-functional and Damage Control Hair Care Products; Prevalence of Different Hair Concerns Remains the Major Driving Force.
6. What are the notable trends driving market growth?
Improved Internet Connections. Advances in Security. and Increased Number of Internet Users.
7. Are there any restraints impacting market growth?
Growing Availability of Counterfeit Products.
8. Can you provide examples of recent developments in the market?
October 2022: Zeal Network SE expanded its games business internationally. The German market leader for online lotteries collaborated with American online lottery provider Park Avenue Gaming to integrate the online instant games of Zeal into its video lottery terminal business in Argentina and its online platforms in Peru.
9. What pricing options are available for accessing the report?
Pricing options include single-user, multi-user, and enterprise licenses priced at USD 4750, USD 5250, and USD 8750 respectively.
10. Is the market size provided in terms of value or volume?
The market size is provided in terms of value, measured in billion.
11. Are there any specific market keywords associated with the report?
Yes, the market keyword associated with the report is "Online Lottery Industry," which aids in identifying and referencing the specific market segment covered.
12. How do I determine which pricing option suits my needs best?
The pricing options vary based on user requirements and access needs. Individual users may opt for single-user licenses, while businesses requiring broader access may choose multi-user or enterprise licenses for cost-effective access to the report.
13. Are there any additional resources or data provided in the Online Lottery Industry report?
While the report offers comprehensive insights, it's advisable to review the specific contents or supplementary materials provided to ascertain if additional resources or data are available.
14. How can I stay updated on further developments or reports in the Online Lottery Industry?
To stay informed about further developments, trends, and reports in the Online Lottery Industry, consider subscribing to industry newsletters, following relevant companies and organizations, or regularly checking reputable industry news sources and publications.
Methodology
Step 1 - Identification of Relevant Samples Size from Population Database


Step 2 - Approaches for Defining Global Market Size (Value, Volume* & Price*)

Note*: In applicable scenarios
Step 3 - Data Sources
Primary Research
- Web Analytics
- Survey Reports
- Research Institute
- Latest Research Reports
- Opinion Leaders
Secondary Research
- Annual Reports
- White Paper
- Latest Press Release
- Industry Association
- Paid Database
- Investor Presentations

Step 4 - Data Triangulation
Involves using different sources of information in order to increase the validity of a study
These sources are likely to be stakeholders in a program - participants, other researchers, program staff, other community members, and so on.
Then we put all data in single framework & apply various statistical tools to find out the dynamic on the market.
During the analysis stage, feedback from the stakeholder groups would be compared to determine areas of agreement as well as areas of divergence