
Key Insights
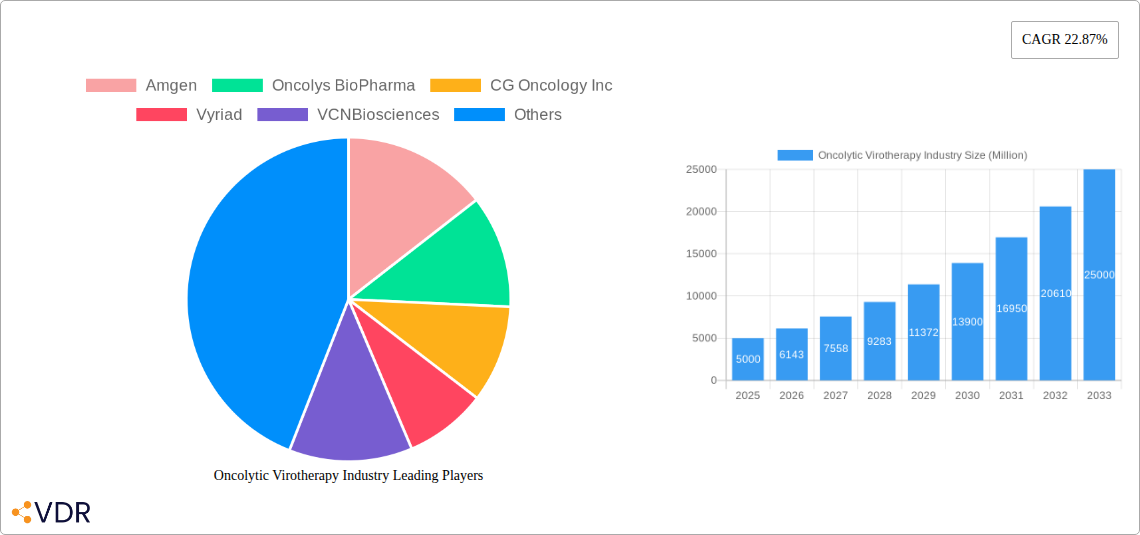
The oncolytic virotherapy market is experiencing robust growth, driven by the increasing prevalence of various cancers, particularly melanoma, prostate, breast, ovarian, and lung cancers. The market's Compound Annual Growth Rate (CAGR) of 22.87% from 2019 to 2024 indicates significant investor interest and a burgeoning demand for effective cancer treatment options. This growth is fueled by advancements in virotherapy technology, leading to the development of more targeted and effective oncolytic viruses. Key innovations include the development of HSV-based and adenovirus-based oncolytic viruses, exhibiting improved tumor selectivity and reduced side effects. Furthermore, ongoing clinical trials and approvals of new oncolytic virotherapies are contributing to market expansion. The significant investments by leading pharmaceutical companies like Amgen, Oncolys BioPharma, and others reflect the substantial potential of this therapeutic modality. While challenges remain, including the potential for toxicity and the complexity of manufacturing processes, the continued research and development efforts are paving the way for wider adoption of oncolytic virotherapy as a promising cancer treatment strategy.
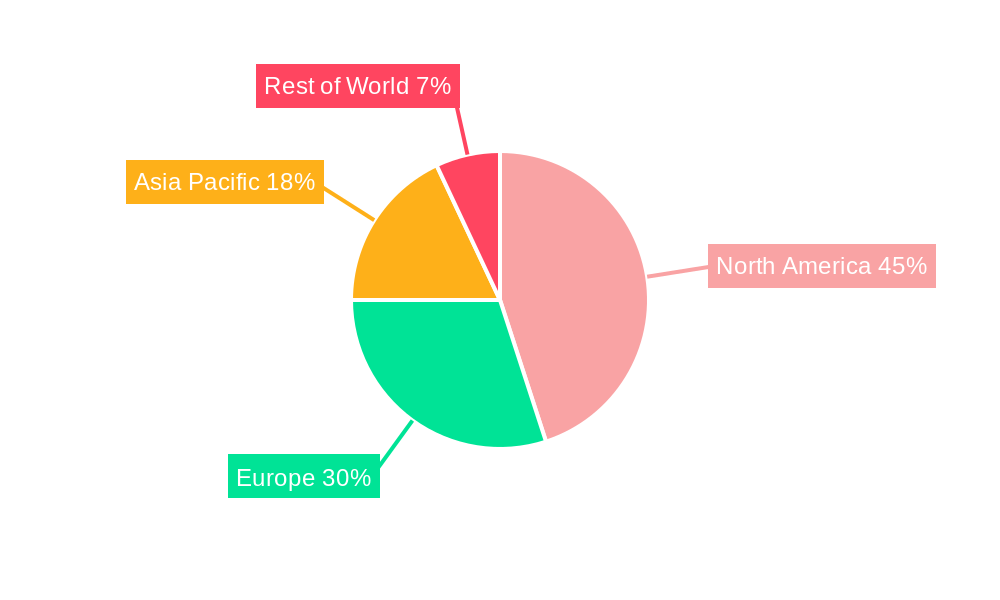
The geographical distribution of the market reflects the concentration of research and healthcare infrastructure in developed regions. North America, particularly the United States, currently holds a dominant market share due to its robust healthcare system, high cancer incidence rates, and substantial investments in biomedical research. However, emerging markets in Asia Pacific and other regions are showing considerable growth potential driven by increasing awareness of oncolytic virotherapy, rising healthcare expenditure, and the expanding oncology treatment landscape. The segmented approach based on virus type (HSV-based, adenovirus-based, others) and cancer type (melanoma, prostate, breast, etc.) offers further insights into the specific market dynamics within each segment. Future market growth will depend on the continued success of clinical trials, regulatory approvals, and the development of novel, safer, and more effective oncolytic viruses tailored to specific cancer types and patient populations. The competitive landscape is dynamic, featuring both established pharmaceutical giants and emerging biotech companies vying for market share, driving innovation and competition in the field.
Oncolytic Virotherapy Market Report: 2019-2033
This comprehensive report provides a detailed analysis of the Oncolytic Virotherapy market, encompassing market dynamics, growth trends, regional insights, product landscape, key players, and future outlook. The study period covers 2019-2033, with a base year of 2025 and a forecast period of 2025-2033. The report offers valuable insights for industry professionals, investors, and stakeholders seeking to understand and capitalize on the opportunities within this rapidly evolving therapeutic area. The market is segmented by type (HSV-based Oncolytic Viruses, Adenoviruses-based Oncolytic Viruses, Others) and application (Melanoma, Prostate Cancer, Breast Cancer, Ovarian Cancer, Lung Cancer, Others). The total market value in 2025 is estimated at xx Million and is projected to reach xx Million by 2033.
Oncolytic Virotherapy Industry Market Dynamics & Structure
The Oncolytic Virotherapy market is characterized by a moderately fragmented landscape, with several key players vying for market share. Technological innovation, particularly in viral vector engineering and targeted delivery systems, is a significant driver. Stringent regulatory frameworks influence market entry and product approvals, while the emergence of novel immunotherapies presents both opportunities and competitive challenges. The market is witnessing increased M&A activity as larger pharmaceutical companies seek to expand their oncology portfolios.
- Market Concentration: Moderately fragmented, with no single dominant player. The top 5 companies hold an estimated xx% market share in 2025.
- Technological Innovation: Focus on enhancing viral tropism, improving safety profiles, and combining oncolytic viruses with other therapies (e.g., immunotherapy).
- Regulatory Landscape: Stringent regulatory pathways impact time to market and development costs. Successful navigation of these pathways is crucial for market success.
- Competitive Substitutes: Other cancer therapies, including chemotherapy, radiation therapy, and targeted therapies, pose competitive challenges.
- End-User Demographics: The market caters primarily to patients with advanced-stage cancers where other treatments have failed.
- M&A Trends: Increasing consolidation within the sector, with larger companies acquiring smaller biotech firms with promising oncolytic virotherapy pipelines. An estimated xx M&A deals were completed in the historical period (2019-2024).
Oncolytic Virotherapy Industry Growth Trends & Insights
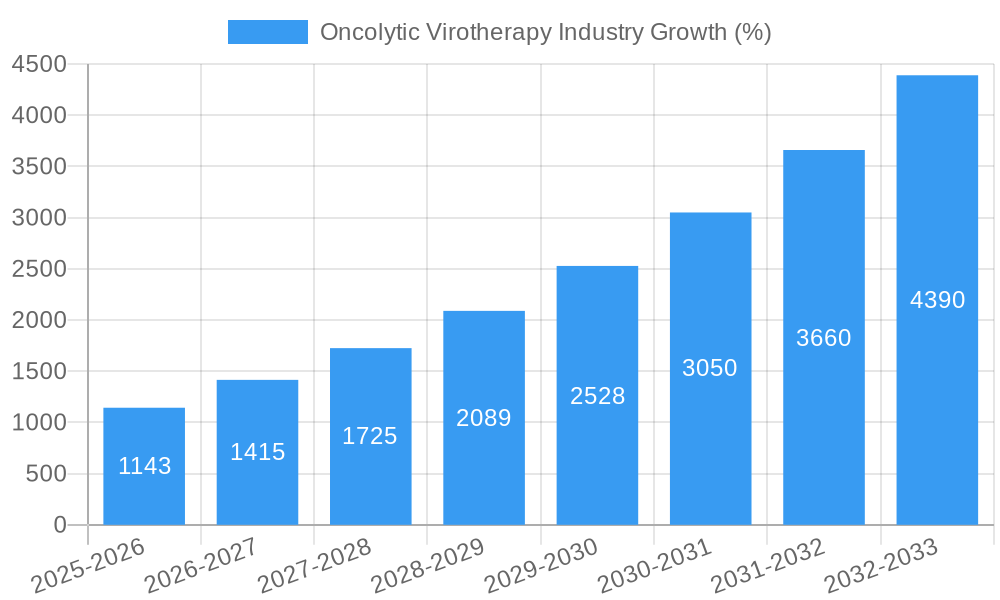
The Oncolytic Virotherapy market is experiencing robust growth, driven by the increasing prevalence of cancer, limitations of conventional therapies, and the emergence of innovative treatment approaches. The market size has shown significant expansion during the historical period (2019-2024), and this trend is projected to continue throughout the forecast period. Technological advancements are improving the efficacy and safety of oncolytic viruses, leading to increased adoption rates among oncologists and a shift in treatment paradigms. Consumer awareness of alternative cancer treatment options is also contributing to market growth. The Compound Annual Growth Rate (CAGR) during the forecast period (2025-2033) is estimated to be xx%. Market penetration is expected to increase from xx% in 2025 to xx% by 2033.
Dominant Regions, Countries, or Segments in Oncolytic Virotherapy Industry
North America currently holds the largest market share in the Oncolytic Virotherapy market, driven by robust research and development activities, early adoption of new therapies, and favorable regulatory environments. However, the European and Asia-Pacific regions are expected to exhibit significant growth in the forecast period. Within the segments, Melanoma and Prostate cancer applications are currently leading the market due to a higher prevalence and clinical success in these indications. HSV-based Oncolytic Viruses currently dominate the types segment due to their established safety profile and efficacy data.
- Key Drivers (North America): Strong clinical infrastructure, substantial funding for research and development, higher healthcare expenditure, and early adoption of innovative therapies.
- Key Drivers (Europe): Increasing R&D investments, growing government support for healthcare initiatives, and favorable regulatory environments.
- Key Drivers (Asia-Pacific): Rising cancer incidence, increasing disposable income, and improving healthcare infrastructure.
- Dominant Segments: Melanoma and Prostate Cancer applications; HSV-based Oncolytic Viruses.
Oncolytic Virotherapy Industry Product Landscape
The Oncolytic Virotherapy product landscape is characterized by a diverse range of viral vectors, including HSV-based, adenovirus-based, and other engineered viruses. These viruses are engineered to target specific cancer cells, minimizing damage to healthy tissues. Recent advancements focus on enhancing viral tropism, improving delivery mechanisms, and combining oncolytic viruses with other therapies to achieve synergistic effects. Key product differentiators include safety profiles, efficacy data, and ease of administration.
Key Drivers, Barriers & Challenges in Oncolytic Virotherapy Industry
Key Drivers:
- Increasing cancer incidence and unmet medical needs in oncology.
- Technological advancements leading to safer and more effective oncolytic viruses.
- Growing investment in research and development from both public and private sectors.
- Increased awareness among patients and oncologists about the potential benefits of this therapy.
Challenges and Restraints:
- High development costs and long timelines for clinical trials and regulatory approvals.
- Potential for adverse effects, including immune-related toxicities.
- Limited market penetration due to high treatment costs and challenges in patient selection.
- Competition from other cancer therapies and limited reimbursement coverage in certain regions.
Emerging Opportunities in Oncolytic Virotherapy Industry
- Expansion into new cancer indications and patient populations.
- Development of combination therapies to enhance efficacy and overcome treatment resistance.
- Exploration of novel viral vectors and delivery systems.
- Development of personalized oncolytic virotherapy approaches.
Growth Accelerators in the Oncolytic Virotherapy Industry
Technological breakthroughs in viral vector engineering, advancements in targeted delivery systems, and the development of combination therapies with other cancer treatments will be key growth accelerators. Strategic partnerships between pharmaceutical companies and biotech firms, along with expansion into emerging markets, are also expected to drive market growth.
Key Players Shaping the Oncolytic Virotherapy Industry Market
- Amgen
- Oncolys BioPharma
- CG Oncology Inc
- Vyriad
- VCN Biosciences
- Transgene SA
- DNAtrix
- Lokon Pharma
- Replimune Group Inc
- TILT Biotherapeutics
- Targovax
- Sorrento Therapeutics
Notable Milestones in Oncolytic Virotherapy Industry Sector
- 2021-Q4: Replimune Group Inc. announces positive clinical trial data for its lead oncolytic virotherapy candidate.
- 2022-Q2: Amgen acquires a biotech company specializing in oncolytic virotherapy.
- 2023-Q1: FDA approves a new oncolytic virotherapy for the treatment of melanoma. (xx - predicted event)
In-Depth Oncolytic Virotherapy Industry Market Outlook
The Oncolytic Virotherapy market is poised for substantial growth in the coming years, driven by continued technological advancements, increased research and development, and growing demand for effective cancer therapies. Strategic partnerships, targeted marketing campaigns, and expansion into new geographic regions will be crucial factors in shaping the future competitive landscape. The focus on personalized medicine and combination therapies presents significant opportunities for innovation and market expansion.
Oncolytic Virotherapy Industry Segmentation
-
1. Types
- 1.1. HSV-based Oncolytic Viruses
- 1.2. Adenoviruses-based Oncolytic Viruses
- 1.3. Others
-
2. Applications
- 2.1. Melanoma
- 2.2. Prostate Cancer
- 2.3. Breast Cancer
- 2.4. Ovarian Cancer
- 2.5. Lung Cancer
- 2.6. Others
Oncolytic Virotherapy Industry Segmentation By Geography
- 1. North America
- 2. Europe
- 3. Asia Pacific
- 4. Middle East and Africa
- 5. South America
Oncolytic Virotherapy Industry REPORT HIGHLIGHTS
| Aspects | Details |
|---|---|
| Study Period | 2019-2033 |
| Base Year | 2024 |
| Estimated Year | 2025 |
| Forecast Period | 2025-2033 |
| Historical Period | 2019-2024 |
| Growth Rate | CAGR of 22.87% from 2019-2033 |
| Segmentation |
|
Table of Contents
- 1. Introduction
- 1.1. Research Scope
- 1.2. Market Segmentation
- 1.3. Research Methodology
- 1.4. Definitions and Assumptions
- 2. Executive Summary
- 2.1. Introduction
- 3. Market Dynamics
- 3.1. Introduction
- 3.2. Market Drivers
- 3.2.1. Rising incidences of cancer and growing cases of Genetic diseases; Increasing investment in Research and development
- 3.3. Market Restrains
- 3.3.1. Stringent Regulatory Standards; High Cost and Risk associate with the treatment
- 3.4. Market Trends
- 3.4.1. Adenovirus-based Oncolytic Viruses Segment Dominates the Market
- 4. Market Factor Analysis
- 4.1. Porters Five Forces
- 4.2. Supply/Value Chain
- 4.3. PESTEL analysis
- 4.4. Market Entropy
- 4.5. Patent/Trademark Analysis
- 5. Global Oncolytic Virotherapy Industry Analysis, Insights and Forecast, 2019-2031
- 5.1. Market Analysis, Insights and Forecast - by Types
- 5.1.1. HSV-based Oncolytic Viruses
- 5.1.2. Adenoviruses-based Oncolytic Viruses
- 5.1.3. Others
- 5.2. Market Analysis, Insights and Forecast - by Applications
- 5.2.1. Melanoma
- 5.2.2. Prostate Cancer
- 5.2.3. Breast Cancer
- 5.2.4. Ovarian Cancer
- 5.2.5. Lung Cancer
- 5.2.6. Others
- 5.3. Market Analysis, Insights and Forecast - by Region
- 5.3.1. North America
- 5.3.2. Europe
- 5.3.3. Asia Pacific
- 5.3.4. Middle East and Africa
- 5.3.5. South America
- 5.1. Market Analysis, Insights and Forecast - by Types
- 6. North America Oncolytic Virotherapy Industry Analysis, Insights and Forecast, 2019-2031
- 6.1. Market Analysis, Insights and Forecast - by Types
- 6.1.1. HSV-based Oncolytic Viruses
- 6.1.2. Adenoviruses-based Oncolytic Viruses
- 6.1.3. Others
- 6.2. Market Analysis, Insights and Forecast - by Applications
- 6.2.1. Melanoma
- 6.2.2. Prostate Cancer
- 6.2.3. Breast Cancer
- 6.2.4. Ovarian Cancer
- 6.2.5. Lung Cancer
- 6.2.6. Others
- 6.1. Market Analysis, Insights and Forecast - by Types
- 7. Europe Oncolytic Virotherapy Industry Analysis, Insights and Forecast, 2019-2031
- 7.1. Market Analysis, Insights and Forecast - by Types
- 7.1.1. HSV-based Oncolytic Viruses
- 7.1.2. Adenoviruses-based Oncolytic Viruses
- 7.1.3. Others
- 7.2. Market Analysis, Insights and Forecast - by Applications
- 7.2.1. Melanoma
- 7.2.2. Prostate Cancer
- 7.2.3. Breast Cancer
- 7.2.4. Ovarian Cancer
- 7.2.5. Lung Cancer
- 7.2.6. Others
- 7.1. Market Analysis, Insights and Forecast - by Types
- 8. Asia Pacific Oncolytic Virotherapy Industry Analysis, Insights and Forecast, 2019-2031
- 8.1. Market Analysis, Insights and Forecast - by Types
- 8.1.1. HSV-based Oncolytic Viruses
- 8.1.2. Adenoviruses-based Oncolytic Viruses
- 8.1.3. Others
- 8.2. Market Analysis, Insights and Forecast - by Applications
- 8.2.1. Melanoma
- 8.2.2. Prostate Cancer
- 8.2.3. Breast Cancer
- 8.2.4. Ovarian Cancer
- 8.2.5. Lung Cancer
- 8.2.6. Others
- 8.1. Market Analysis, Insights and Forecast - by Types
- 9. Middle East and Africa Oncolytic Virotherapy Industry Analysis, Insights and Forecast, 2019-2031
- 9.1. Market Analysis, Insights and Forecast - by Types
- 9.1.1. HSV-based Oncolytic Viruses
- 9.1.2. Adenoviruses-based Oncolytic Viruses
- 9.1.3. Others
- 9.2. Market Analysis, Insights and Forecast - by Applications
- 9.2.1. Melanoma
- 9.2.2. Prostate Cancer
- 9.2.3. Breast Cancer
- 9.2.4. Ovarian Cancer
- 9.2.5. Lung Cancer
- 9.2.6. Others
- 9.1. Market Analysis, Insights and Forecast - by Types
- 10. South America Oncolytic Virotherapy Industry Analysis, Insights and Forecast, 2019-2031
- 10.1. Market Analysis, Insights and Forecast - by Types
- 10.1.1. HSV-based Oncolytic Viruses
- 10.1.2. Adenoviruses-based Oncolytic Viruses
- 10.1.3. Others
- 10.2. Market Analysis, Insights and Forecast - by Applications
- 10.2.1. Melanoma
- 10.2.2. Prostate Cancer
- 10.2.3. Breast Cancer
- 10.2.4. Ovarian Cancer
- 10.2.5. Lung Cancer
- 10.2.6. Others
- 10.1. Market Analysis, Insights and Forecast - by Types
- 11. North America Oncolytic Virotherapy Industry Analysis, Insights and Forecast, 2019-2031
- 11.1. Market Analysis, Insights and Forecast - By Country/Sub-region
- 11.1.1 United States
- 11.1.2 Canada
- 11.1.3 Mexico
- 12. Europe Oncolytic Virotherapy Industry Analysis, Insights and Forecast, 2019-2031
- 12.1. Market Analysis, Insights and Forecast - By Country/Sub-region
- 12.1.1 Germany
- 12.1.2 United Kingdom
- 12.1.3 France
- 12.1.4 Spain
- 12.1.5 Italy
- 12.1.6 Spain
- 12.1.7 Belgium
- 12.1.8 Netherland
- 12.1.9 Nordics
- 12.1.10 Rest of Europe
- 13. Asia Pacific Oncolytic Virotherapy Industry Analysis, Insights and Forecast, 2019-2031
- 13.1. Market Analysis, Insights and Forecast - By Country/Sub-region
- 13.1.1 China
- 13.1.2 Japan
- 13.1.3 India
- 13.1.4 South Korea
- 13.1.5 Southeast Asia
- 13.1.6 Australia
- 13.1.7 Indonesia
- 13.1.8 Phillipes
- 13.1.9 Singapore
- 13.1.10 Thailandc
- 13.1.11 Rest of Asia Pacific
- 14. South America Oncolytic Virotherapy Industry Analysis, Insights and Forecast, 2019-2031
- 14.1. Market Analysis, Insights and Forecast - By Country/Sub-region
- 14.1.1 Brazil
- 14.1.2 Argentina
- 14.1.3 Peru
- 14.1.4 Chile
- 14.1.5 Colombia
- 14.1.6 Ecuador
- 14.1.7 Venezuela
- 14.1.8 Rest of South America
- 15. North America Oncolytic Virotherapy Industry Analysis, Insights and Forecast, 2019-2031
- 15.1. Market Analysis, Insights and Forecast - By Country/Sub-region
- 15.1.1 United States
- 15.1.2 Canada
- 15.1.3 Mexico
- 16. MEA Oncolytic Virotherapy Industry Analysis, Insights and Forecast, 2019-2031
- 16.1. Market Analysis, Insights and Forecast - By Country/Sub-region
- 16.1.1 United Arab Emirates
- 16.1.2 Saudi Arabia
- 16.1.3 South Africa
- 16.1.4 Rest of Middle East and Africa
- 17. Competitive Analysis
- 17.1. Global Market Share Analysis 2024
- 17.2. Company Profiles
- 17.2.1 Amgen
- 17.2.1.1. Overview
- 17.2.1.2. Products
- 17.2.1.3. SWOT Analysis
- 17.2.1.4. Recent Developments
- 17.2.1.5. Financials (Based on Availability)
- 17.2.2 Oncolys BioPharma
- 17.2.2.1. Overview
- 17.2.2.2. Products
- 17.2.2.3. SWOT Analysis
- 17.2.2.4. Recent Developments
- 17.2.2.5. Financials (Based on Availability)
- 17.2.3 CG Oncology Inc
- 17.2.3.1. Overview
- 17.2.3.2. Products
- 17.2.3.3. SWOT Analysis
- 17.2.3.4. Recent Developments
- 17.2.3.5. Financials (Based on Availability)
- 17.2.4 Vyriad
- 17.2.4.1. Overview
- 17.2.4.2. Products
- 17.2.4.3. SWOT Analysis
- 17.2.4.4. Recent Developments
- 17.2.4.5. Financials (Based on Availability)
- 17.2.5 VCNBiosciences
- 17.2.5.1. Overview
- 17.2.5.2. Products
- 17.2.5.3. SWOT Analysis
- 17.2.5.4. Recent Developments
- 17.2.5.5. Financials (Based on Availability)
- 17.2.6 Transgene SA
- 17.2.6.1. Overview
- 17.2.6.2. Products
- 17.2.6.3. SWOT Analysis
- 17.2.6.4. Recent Developments
- 17.2.6.5. Financials (Based on Availability)
- 17.2.7 DNAtrix
- 17.2.7.1. Overview
- 17.2.7.2. Products
- 17.2.7.3. SWOT Analysis
- 17.2.7.4. Recent Developments
- 17.2.7.5. Financials (Based on Availability)
- 17.2.8 Lokon Pharma
- 17.2.8.1. Overview
- 17.2.8.2. Products
- 17.2.8.3. SWOT Analysis
- 17.2.8.4. Recent Developments
- 17.2.8.5. Financials (Based on Availability)
- 17.2.9 Replimune Group Inc
- 17.2.9.1. Overview
- 17.2.9.2. Products
- 17.2.9.3. SWOT Analysis
- 17.2.9.4. Recent Developments
- 17.2.9.5. Financials (Based on Availability)
- 17.2.10 TILT Biotherapeutics
- 17.2.10.1. Overview
- 17.2.10.2. Products
- 17.2.10.3. SWOT Analysis
- 17.2.10.4. Recent Developments
- 17.2.10.5. Financials (Based on Availability)
- 17.2.11 Targovax
- 17.2.11.1. Overview
- 17.2.11.2. Products
- 17.2.11.3. SWOT Analysis
- 17.2.11.4. Recent Developments
- 17.2.11.5. Financials (Based on Availability)
- 17.2.12 Sorrento Therapeutics
- 17.2.12.1. Overview
- 17.2.12.2. Products
- 17.2.12.3. SWOT Analysis
- 17.2.12.4. Recent Developments
- 17.2.12.5. Financials (Based on Availability)
- 17.2.1 Amgen
List of Figures
- Figure 1: Global Oncolytic Virotherapy Industry Revenue Breakdown (Million, %) by Region 2024 & 2032
- Figure 2: Global Oncolytic Virotherapy Industry Volume Breakdown (K Unit, %) by Region 2024 & 2032
- Figure 3: North America Oncolytic Virotherapy Industry Revenue (Million), by Country 2024 & 2032
- Figure 4: North America Oncolytic Virotherapy Industry Volume (K Unit), by Country 2024 & 2032
- Figure 5: North America Oncolytic Virotherapy Industry Revenue Share (%), by Country 2024 & 2032
- Figure 6: North America Oncolytic Virotherapy Industry Volume Share (%), by Country 2024 & 2032
- Figure 7: Europe Oncolytic Virotherapy Industry Revenue (Million), by Country 2024 & 2032
- Figure 8: Europe Oncolytic Virotherapy Industry Volume (K Unit), by Country 2024 & 2032
- Figure 9: Europe Oncolytic Virotherapy Industry Revenue Share (%), by Country 2024 & 2032
- Figure 10: Europe Oncolytic Virotherapy Industry Volume Share (%), by Country 2024 & 2032
- Figure 11: Asia Pacific Oncolytic Virotherapy Industry Revenue (Million), by Country 2024 & 2032
- Figure 12: Asia Pacific Oncolytic Virotherapy Industry Volume (K Unit), by Country 2024 & 2032
- Figure 13: Asia Pacific Oncolytic Virotherapy Industry Revenue Share (%), by Country 2024 & 2032
- Figure 14: Asia Pacific Oncolytic Virotherapy Industry Volume Share (%), by Country 2024 & 2032
- Figure 15: South America Oncolytic Virotherapy Industry Revenue (Million), by Country 2024 & 2032
- Figure 16: South America Oncolytic Virotherapy Industry Volume (K Unit), by Country 2024 & 2032
- Figure 17: South America Oncolytic Virotherapy Industry Revenue Share (%), by Country 2024 & 2032
- Figure 18: South America Oncolytic Virotherapy Industry Volume Share (%), by Country 2024 & 2032
- Figure 19: North America Oncolytic Virotherapy Industry Revenue (Million), by Country 2024 & 2032
- Figure 20: North America Oncolytic Virotherapy Industry Volume (K Unit), by Country 2024 & 2032
- Figure 21: North America Oncolytic Virotherapy Industry Revenue Share (%), by Country 2024 & 2032
- Figure 22: North America Oncolytic Virotherapy Industry Volume Share (%), by Country 2024 & 2032
- Figure 23: MEA Oncolytic Virotherapy Industry Revenue (Million), by Country 2024 & 2032
- Figure 24: MEA Oncolytic Virotherapy Industry Volume (K Unit), by Country 2024 & 2032
- Figure 25: MEA Oncolytic Virotherapy Industry Revenue Share (%), by Country 2024 & 2032
- Figure 26: MEA Oncolytic Virotherapy Industry Volume Share (%), by Country 2024 & 2032
- Figure 27: North America Oncolytic Virotherapy Industry Revenue (Million), by Types 2024 & 2032
- Figure 28: North America Oncolytic Virotherapy Industry Volume (K Unit), by Types 2024 & 2032
- Figure 29: North America Oncolytic Virotherapy Industry Revenue Share (%), by Types 2024 & 2032
- Figure 30: North America Oncolytic Virotherapy Industry Volume Share (%), by Types 2024 & 2032
- Figure 31: North America Oncolytic Virotherapy Industry Revenue (Million), by Applications 2024 & 2032
- Figure 32: North America Oncolytic Virotherapy Industry Volume (K Unit), by Applications 2024 & 2032
- Figure 33: North America Oncolytic Virotherapy Industry Revenue Share (%), by Applications 2024 & 2032
- Figure 34: North America Oncolytic Virotherapy Industry Volume Share (%), by Applications 2024 & 2032
- Figure 35: North America Oncolytic Virotherapy Industry Revenue (Million), by Country 2024 & 2032
- Figure 36: North America Oncolytic Virotherapy Industry Volume (K Unit), by Country 2024 & 2032
- Figure 37: North America Oncolytic Virotherapy Industry Revenue Share (%), by Country 2024 & 2032
- Figure 38: North America Oncolytic Virotherapy Industry Volume Share (%), by Country 2024 & 2032
- Figure 39: Europe Oncolytic Virotherapy Industry Revenue (Million), by Types 2024 & 2032
- Figure 40: Europe Oncolytic Virotherapy Industry Volume (K Unit), by Types 2024 & 2032
- Figure 41: Europe Oncolytic Virotherapy Industry Revenue Share (%), by Types 2024 & 2032
- Figure 42: Europe Oncolytic Virotherapy Industry Volume Share (%), by Types 2024 & 2032
- Figure 43: Europe Oncolytic Virotherapy Industry Revenue (Million), by Applications 2024 & 2032
- Figure 44: Europe Oncolytic Virotherapy Industry Volume (K Unit), by Applications 2024 & 2032
- Figure 45: Europe Oncolytic Virotherapy Industry Revenue Share (%), by Applications 2024 & 2032
- Figure 46: Europe Oncolytic Virotherapy Industry Volume Share (%), by Applications 2024 & 2032
- Figure 47: Europe Oncolytic Virotherapy Industry Revenue (Million), by Country 2024 & 2032
- Figure 48: Europe Oncolytic Virotherapy Industry Volume (K Unit), by Country 2024 & 2032
- Figure 49: Europe Oncolytic Virotherapy Industry Revenue Share (%), by Country 2024 & 2032
- Figure 50: Europe Oncolytic Virotherapy Industry Volume Share (%), by Country 2024 & 2032
- Figure 51: Asia Pacific Oncolytic Virotherapy Industry Revenue (Million), by Types 2024 & 2032
- Figure 52: Asia Pacific Oncolytic Virotherapy Industry Volume (K Unit), by Types 2024 & 2032
- Figure 53: Asia Pacific Oncolytic Virotherapy Industry Revenue Share (%), by Types 2024 & 2032
- Figure 54: Asia Pacific Oncolytic Virotherapy Industry Volume Share (%), by Types 2024 & 2032
- Figure 55: Asia Pacific Oncolytic Virotherapy Industry Revenue (Million), by Applications 2024 & 2032
- Figure 56: Asia Pacific Oncolytic Virotherapy Industry Volume (K Unit), by Applications 2024 & 2032
- Figure 57: Asia Pacific Oncolytic Virotherapy Industry Revenue Share (%), by Applications 2024 & 2032
- Figure 58: Asia Pacific Oncolytic Virotherapy Industry Volume Share (%), by Applications 2024 & 2032
- Figure 59: Asia Pacific Oncolytic Virotherapy Industry Revenue (Million), by Country 2024 & 2032
- Figure 60: Asia Pacific Oncolytic Virotherapy Industry Volume (K Unit), by Country 2024 & 2032
- Figure 61: Asia Pacific Oncolytic Virotherapy Industry Revenue Share (%), by Country 2024 & 2032
- Figure 62: Asia Pacific Oncolytic Virotherapy Industry Volume Share (%), by Country 2024 & 2032
- Figure 63: Middle East and Africa Oncolytic Virotherapy Industry Revenue (Million), by Types 2024 & 2032
- Figure 64: Middle East and Africa Oncolytic Virotherapy Industry Volume (K Unit), by Types 2024 & 2032
- Figure 65: Middle East and Africa Oncolytic Virotherapy Industry Revenue Share (%), by Types 2024 & 2032
- Figure 66: Middle East and Africa Oncolytic Virotherapy Industry Volume Share (%), by Types 2024 & 2032
- Figure 67: Middle East and Africa Oncolytic Virotherapy Industry Revenue (Million), by Applications 2024 & 2032
- Figure 68: Middle East and Africa Oncolytic Virotherapy Industry Volume (K Unit), by Applications 2024 & 2032
- Figure 69: Middle East and Africa Oncolytic Virotherapy Industry Revenue Share (%), by Applications 2024 & 2032
- Figure 70: Middle East and Africa Oncolytic Virotherapy Industry Volume Share (%), by Applications 2024 & 2032
- Figure 71: Middle East and Africa Oncolytic Virotherapy Industry Revenue (Million), by Country 2024 & 2032
- Figure 72: Middle East and Africa Oncolytic Virotherapy Industry Volume (K Unit), by Country 2024 & 2032
- Figure 73: Middle East and Africa Oncolytic Virotherapy Industry Revenue Share (%), by Country 2024 & 2032
- Figure 74: Middle East and Africa Oncolytic Virotherapy Industry Volume Share (%), by Country 2024 & 2032
- Figure 75: South America Oncolytic Virotherapy Industry Revenue (Million), by Types 2024 & 2032
- Figure 76: South America Oncolytic Virotherapy Industry Volume (K Unit), by Types 2024 & 2032
- Figure 77: South America Oncolytic Virotherapy Industry Revenue Share (%), by Types 2024 & 2032
- Figure 78: South America Oncolytic Virotherapy Industry Volume Share (%), by Types 2024 & 2032
- Figure 79: South America Oncolytic Virotherapy Industry Revenue (Million), by Applications 2024 & 2032
- Figure 80: South America Oncolytic Virotherapy Industry Volume (K Unit), by Applications 2024 & 2032
- Figure 81: South America Oncolytic Virotherapy Industry Revenue Share (%), by Applications 2024 & 2032
- Figure 82: South America Oncolytic Virotherapy Industry Volume Share (%), by Applications 2024 & 2032
- Figure 83: South America Oncolytic Virotherapy Industry Revenue (Million), by Country 2024 & 2032
- Figure 84: South America Oncolytic Virotherapy Industry Volume (K Unit), by Country 2024 & 2032
- Figure 85: South America Oncolytic Virotherapy Industry Revenue Share (%), by Country 2024 & 2032
- Figure 86: South America Oncolytic Virotherapy Industry Volume Share (%), by Country 2024 & 2032
List of Tables
- Table 1: Global Oncolytic Virotherapy Industry Revenue Million Forecast, by Region 2019 & 2032
- Table 2: Global Oncolytic Virotherapy Industry Volume K Unit Forecast, by Region 2019 & 2032
- Table 3: Global Oncolytic Virotherapy Industry Revenue Million Forecast, by Types 2019 & 2032
- Table 4: Global Oncolytic Virotherapy Industry Volume K Unit Forecast, by Types 2019 & 2032
- Table 5: Global Oncolytic Virotherapy Industry Revenue Million Forecast, by Applications 2019 & 2032
- Table 6: Global Oncolytic Virotherapy Industry Volume K Unit Forecast, by Applications 2019 & 2032
- Table 7: Global Oncolytic Virotherapy Industry Revenue Million Forecast, by Region 2019 & 2032
- Table 8: Global Oncolytic Virotherapy Industry Volume K Unit Forecast, by Region 2019 & 2032
- Table 9: Global Oncolytic Virotherapy Industry Revenue Million Forecast, by Country 2019 & 2032
- Table 10: Global Oncolytic Virotherapy Industry Volume K Unit Forecast, by Country 2019 & 2032
- Table 11: United States Oncolytic Virotherapy Industry Revenue (Million) Forecast, by Application 2019 & 2032
- Table 12: United States Oncolytic Virotherapy Industry Volume (K Unit) Forecast, by Application 2019 & 2032
- Table 13: Canada Oncolytic Virotherapy Industry Revenue (Million) Forecast, by Application 2019 & 2032
- Table 14: Canada Oncolytic Virotherapy Industry Volume (K Unit) Forecast, by Application 2019 & 2032
- Table 15: Mexico Oncolytic Virotherapy Industry Revenue (Million) Forecast, by Application 2019 & 2032
- Table 16: Mexico Oncolytic Virotherapy Industry Volume (K Unit) Forecast, by Application 2019 & 2032
- Table 17: Global Oncolytic Virotherapy Industry Revenue Million Forecast, by Country 2019 & 2032
- Table 18: Global Oncolytic Virotherapy Industry Volume K Unit Forecast, by Country 2019 & 2032
- Table 19: Germany Oncolytic Virotherapy Industry Revenue (Million) Forecast, by Application 2019 & 2032
- Table 20: Germany Oncolytic Virotherapy Industry Volume (K Unit) Forecast, by Application 2019 & 2032
- Table 21: United Kingdom Oncolytic Virotherapy Industry Revenue (Million) Forecast, by Application 2019 & 2032
- Table 22: United Kingdom Oncolytic Virotherapy Industry Volume (K Unit) Forecast, by Application 2019 & 2032
- Table 23: France Oncolytic Virotherapy Industry Revenue (Million) Forecast, by Application 2019 & 2032
- Table 24: France Oncolytic Virotherapy Industry Volume (K Unit) Forecast, by Application 2019 & 2032
- Table 25: Spain Oncolytic Virotherapy Industry Revenue (Million) Forecast, by Application 2019 & 2032
- Table 26: Spain Oncolytic Virotherapy Industry Volume (K Unit) Forecast, by Application 2019 & 2032
- Table 27: Italy Oncolytic Virotherapy Industry Revenue (Million) Forecast, by Application 2019 & 2032
- Table 28: Italy Oncolytic Virotherapy Industry Volume (K Unit) Forecast, by Application 2019 & 2032
- Table 29: Spain Oncolytic Virotherapy Industry Revenue (Million) Forecast, by Application 2019 & 2032
- Table 30: Spain Oncolytic Virotherapy Industry Volume (K Unit) Forecast, by Application 2019 & 2032
- Table 31: Belgium Oncolytic Virotherapy Industry Revenue (Million) Forecast, by Application 2019 & 2032
- Table 32: Belgium Oncolytic Virotherapy Industry Volume (K Unit) Forecast, by Application 2019 & 2032
- Table 33: Netherland Oncolytic Virotherapy Industry Revenue (Million) Forecast, by Application 2019 & 2032
- Table 34: Netherland Oncolytic Virotherapy Industry Volume (K Unit) Forecast, by Application 2019 & 2032
- Table 35: Nordics Oncolytic Virotherapy Industry Revenue (Million) Forecast, by Application 2019 & 2032
- Table 36: Nordics Oncolytic Virotherapy Industry Volume (K Unit) Forecast, by Application 2019 & 2032
- Table 37: Rest of Europe Oncolytic Virotherapy Industry Revenue (Million) Forecast, by Application 2019 & 2032
- Table 38: Rest of Europe Oncolytic Virotherapy Industry Volume (K Unit) Forecast, by Application 2019 & 2032
- Table 39: Global Oncolytic Virotherapy Industry Revenue Million Forecast, by Country 2019 & 2032
- Table 40: Global Oncolytic Virotherapy Industry Volume K Unit Forecast, by Country 2019 & 2032
- Table 41: China Oncolytic Virotherapy Industry Revenue (Million) Forecast, by Application 2019 & 2032
- Table 42: China Oncolytic Virotherapy Industry Volume (K Unit) Forecast, by Application 2019 & 2032
- Table 43: Japan Oncolytic Virotherapy Industry Revenue (Million) Forecast, by Application 2019 & 2032
- Table 44: Japan Oncolytic Virotherapy Industry Volume (K Unit) Forecast, by Application 2019 & 2032
- Table 45: India Oncolytic Virotherapy Industry Revenue (Million) Forecast, by Application 2019 & 2032
- Table 46: India Oncolytic Virotherapy Industry Volume (K Unit) Forecast, by Application 2019 & 2032
- Table 47: South Korea Oncolytic Virotherapy Industry Revenue (Million) Forecast, by Application 2019 & 2032
- Table 48: South Korea Oncolytic Virotherapy Industry Volume (K Unit) Forecast, by Application 2019 & 2032
- Table 49: Southeast Asia Oncolytic Virotherapy Industry Revenue (Million) Forecast, by Application 2019 & 2032
- Table 50: Southeast Asia Oncolytic Virotherapy Industry Volume (K Unit) Forecast, by Application 2019 & 2032
- Table 51: Australia Oncolytic Virotherapy Industry Revenue (Million) Forecast, by Application 2019 & 2032
- Table 52: Australia Oncolytic Virotherapy Industry Volume (K Unit) Forecast, by Application 2019 & 2032
- Table 53: Indonesia Oncolytic Virotherapy Industry Revenue (Million) Forecast, by Application 2019 & 2032
- Table 54: Indonesia Oncolytic Virotherapy Industry Volume (K Unit) Forecast, by Application 2019 & 2032
- Table 55: Phillipes Oncolytic Virotherapy Industry Revenue (Million) Forecast, by Application 2019 & 2032
- Table 56: Phillipes Oncolytic Virotherapy Industry Volume (K Unit) Forecast, by Application 2019 & 2032
- Table 57: Singapore Oncolytic Virotherapy Industry Revenue (Million) Forecast, by Application 2019 & 2032
- Table 58: Singapore Oncolytic Virotherapy Industry Volume (K Unit) Forecast, by Application 2019 & 2032
- Table 59: Thailandc Oncolytic Virotherapy Industry Revenue (Million) Forecast, by Application 2019 & 2032
- Table 60: Thailandc Oncolytic Virotherapy Industry Volume (K Unit) Forecast, by Application 2019 & 2032
- Table 61: Rest of Asia Pacific Oncolytic Virotherapy Industry Revenue (Million) Forecast, by Application 2019 & 2032
- Table 62: Rest of Asia Pacific Oncolytic Virotherapy Industry Volume (K Unit) Forecast, by Application 2019 & 2032
- Table 63: Global Oncolytic Virotherapy Industry Revenue Million Forecast, by Country 2019 & 2032
- Table 64: Global Oncolytic Virotherapy Industry Volume K Unit Forecast, by Country 2019 & 2032
- Table 65: Brazil Oncolytic Virotherapy Industry Revenue (Million) Forecast, by Application 2019 & 2032
- Table 66: Brazil Oncolytic Virotherapy Industry Volume (K Unit) Forecast, by Application 2019 & 2032
- Table 67: Argentina Oncolytic Virotherapy Industry Revenue (Million) Forecast, by Application 2019 & 2032
- Table 68: Argentina Oncolytic Virotherapy Industry Volume (K Unit) Forecast, by Application 2019 & 2032
- Table 69: Peru Oncolytic Virotherapy Industry Revenue (Million) Forecast, by Application 2019 & 2032
- Table 70: Peru Oncolytic Virotherapy Industry Volume (K Unit) Forecast, by Application 2019 & 2032
- Table 71: Chile Oncolytic Virotherapy Industry Revenue (Million) Forecast, by Application 2019 & 2032
- Table 72: Chile Oncolytic Virotherapy Industry Volume (K Unit) Forecast, by Application 2019 & 2032
- Table 73: Colombia Oncolytic Virotherapy Industry Revenue (Million) Forecast, by Application 2019 & 2032
- Table 74: Colombia Oncolytic Virotherapy Industry Volume (K Unit) Forecast, by Application 2019 & 2032
- Table 75: Ecuador Oncolytic Virotherapy Industry Revenue (Million) Forecast, by Application 2019 & 2032
- Table 76: Ecuador Oncolytic Virotherapy Industry Volume (K Unit) Forecast, by Application 2019 & 2032
- Table 77: Venezuela Oncolytic Virotherapy Industry Revenue (Million) Forecast, by Application 2019 & 2032
- Table 78: Venezuela Oncolytic Virotherapy Industry Volume (K Unit) Forecast, by Application 2019 & 2032
- Table 79: Rest of South America Oncolytic Virotherapy Industry Revenue (Million) Forecast, by Application 2019 & 2032
- Table 80: Rest of South America Oncolytic Virotherapy Industry Volume (K Unit) Forecast, by Application 2019 & 2032
- Table 81: Global Oncolytic Virotherapy Industry Revenue Million Forecast, by Country 2019 & 2032
- Table 82: Global Oncolytic Virotherapy Industry Volume K Unit Forecast, by Country 2019 & 2032
- Table 83: United States Oncolytic Virotherapy Industry Revenue (Million) Forecast, by Application 2019 & 2032
- Table 84: United States Oncolytic Virotherapy Industry Volume (K Unit) Forecast, by Application 2019 & 2032
- Table 85: Canada Oncolytic Virotherapy Industry Revenue (Million) Forecast, by Application 2019 & 2032
- Table 86: Canada Oncolytic Virotherapy Industry Volume (K Unit) Forecast, by Application 2019 & 2032
- Table 87: Mexico Oncolytic Virotherapy Industry Revenue (Million) Forecast, by Application 2019 & 2032
- Table 88: Mexico Oncolytic Virotherapy Industry Volume (K Unit) Forecast, by Application 2019 & 2032
- Table 89: Global Oncolytic Virotherapy Industry Revenue Million Forecast, by Country 2019 & 2032
- Table 90: Global Oncolytic Virotherapy Industry Volume K Unit Forecast, by Country 2019 & 2032
- Table 91: United Arab Emirates Oncolytic Virotherapy Industry Revenue (Million) Forecast, by Application 2019 & 2032
- Table 92: United Arab Emirates Oncolytic Virotherapy Industry Volume (K Unit) Forecast, by Application 2019 & 2032
- Table 93: Saudi Arabia Oncolytic Virotherapy Industry Revenue (Million) Forecast, by Application 2019 & 2032
- Table 94: Saudi Arabia Oncolytic Virotherapy Industry Volume (K Unit) Forecast, by Application 2019 & 2032
- Table 95: South Africa Oncolytic Virotherapy Industry Revenue (Million) Forecast, by Application 2019 & 2032
- Table 96: South Africa Oncolytic Virotherapy Industry Volume (K Unit) Forecast, by Application 2019 & 2032
- Table 97: Rest of Middle East and Africa Oncolytic Virotherapy Industry Revenue (Million) Forecast, by Application 2019 & 2032
- Table 98: Rest of Middle East and Africa Oncolytic Virotherapy Industry Volume (K Unit) Forecast, by Application 2019 & 2032
- Table 99: Global Oncolytic Virotherapy Industry Revenue Million Forecast, by Types 2019 & 2032
- Table 100: Global Oncolytic Virotherapy Industry Volume K Unit Forecast, by Types 2019 & 2032
- Table 101: Global Oncolytic Virotherapy Industry Revenue Million Forecast, by Applications 2019 & 2032
- Table 102: Global Oncolytic Virotherapy Industry Volume K Unit Forecast, by Applications 2019 & 2032
- Table 103: Global Oncolytic Virotherapy Industry Revenue Million Forecast, by Country 2019 & 2032
- Table 104: Global Oncolytic Virotherapy Industry Volume K Unit Forecast, by Country 2019 & 2032
- Table 105: Global Oncolytic Virotherapy Industry Revenue Million Forecast, by Types 2019 & 2032
- Table 106: Global Oncolytic Virotherapy Industry Volume K Unit Forecast, by Types 2019 & 2032
- Table 107: Global Oncolytic Virotherapy Industry Revenue Million Forecast, by Applications 2019 & 2032
- Table 108: Global Oncolytic Virotherapy Industry Volume K Unit Forecast, by Applications 2019 & 2032
- Table 109: Global Oncolytic Virotherapy Industry Revenue Million Forecast, by Country 2019 & 2032
- Table 110: Global Oncolytic Virotherapy Industry Volume K Unit Forecast, by Country 2019 & 2032
- Table 111: Global Oncolytic Virotherapy Industry Revenue Million Forecast, by Types 2019 & 2032
- Table 112: Global Oncolytic Virotherapy Industry Volume K Unit Forecast, by Types 2019 & 2032
- Table 113: Global Oncolytic Virotherapy Industry Revenue Million Forecast, by Applications 2019 & 2032
- Table 114: Global Oncolytic Virotherapy Industry Volume K Unit Forecast, by Applications 2019 & 2032
- Table 115: Global Oncolytic Virotherapy Industry Revenue Million Forecast, by Country 2019 & 2032
- Table 116: Global Oncolytic Virotherapy Industry Volume K Unit Forecast, by Country 2019 & 2032
- Table 117: Global Oncolytic Virotherapy Industry Revenue Million Forecast, by Types 2019 & 2032
- Table 118: Global Oncolytic Virotherapy Industry Volume K Unit Forecast, by Types 2019 & 2032
- Table 119: Global Oncolytic Virotherapy Industry Revenue Million Forecast, by Applications 2019 & 2032
- Table 120: Global Oncolytic Virotherapy Industry Volume K Unit Forecast, by Applications 2019 & 2032
- Table 121: Global Oncolytic Virotherapy Industry Revenue Million Forecast, by Country 2019 & 2032
- Table 122: Global Oncolytic Virotherapy Industry Volume K Unit Forecast, by Country 2019 & 2032
- Table 123: Global Oncolytic Virotherapy Industry Revenue Million Forecast, by Types 2019 & 2032
- Table 124: Global Oncolytic Virotherapy Industry Volume K Unit Forecast, by Types 2019 & 2032
- Table 125: Global Oncolytic Virotherapy Industry Revenue Million Forecast, by Applications 2019 & 2032
- Table 126: Global Oncolytic Virotherapy Industry Volume K Unit Forecast, by Applications 2019 & 2032
- Table 127: Global Oncolytic Virotherapy Industry Revenue Million Forecast, by Country 2019 & 2032
- Table 128: Global Oncolytic Virotherapy Industry Volume K Unit Forecast, by Country 2019 & 2032
Frequently Asked Questions
1. What is the projected Compound Annual Growth Rate (CAGR) of the Oncolytic Virotherapy Industry?
The projected CAGR is approximately 22.87%.
2. Which companies are prominent players in the Oncolytic Virotherapy Industry?
Key companies in the market include Amgen, Oncolys BioPharma, CG Oncology Inc, Vyriad, VCNBiosciences, Transgene SA, DNAtrix, Lokon Pharma, Replimune Group Inc, TILT Biotherapeutics, Targovax, Sorrento Therapeutics.
3. What are the main segments of the Oncolytic Virotherapy Industry?
The market segments include Types, Applications.
4. Can you provide details about the market size?
The market size is estimated to be USD XX Million as of 2022.
5. What are some drivers contributing to market growth?
Rising incidences of cancer and growing cases of Genetic diseases; Increasing investment in Research and development.
6. What are the notable trends driving market growth?
Adenovirus-based Oncolytic Viruses Segment Dominates the Market.
7. Are there any restraints impacting market growth?
Stringent Regulatory Standards; High Cost and Risk associate with the treatment.
8. Can you provide examples of recent developments in the market?
N/A
9. What pricing options are available for accessing the report?
Pricing options include single-user, multi-user, and enterprise licenses priced at USD 4750, USD 5250, and USD 8750 respectively.
10. Is the market size provided in terms of value or volume?
The market size is provided in terms of value, measured in Million and volume, measured in K Unit.
11. Are there any specific market keywords associated with the report?
Yes, the market keyword associated with the report is "Oncolytic Virotherapy Industry," which aids in identifying and referencing the specific market segment covered.
12. How do I determine which pricing option suits my needs best?
The pricing options vary based on user requirements and access needs. Individual users may opt for single-user licenses, while businesses requiring broader access may choose multi-user or enterprise licenses for cost-effective access to the report.
13. Are there any additional resources or data provided in the Oncolytic Virotherapy Industry report?
While the report offers comprehensive insights, it's advisable to review the specific contents or supplementary materials provided to ascertain if additional resources or data are available.
14. How can I stay updated on further developments or reports in the Oncolytic Virotherapy Industry?
To stay informed about further developments, trends, and reports in the Oncolytic Virotherapy Industry, consider subscribing to industry newsletters, following relevant companies and organizations, or regularly checking reputable industry news sources and publications.
Methodology
Step 1 - Identification of Relevant Samples Size from Population Database


Step 2 - Approaches for Defining Global Market Size (Value, Volume* & Price*)

Note*: In applicable scenarios
Step 3 - Data Sources
Primary Research
- Web Analytics
- Survey Reports
- Research Institute
- Latest Research Reports
- Opinion Leaders
Secondary Research
- Annual Reports
- White Paper
- Latest Press Release
- Industry Association
- Paid Database
- Investor Presentations

Step 4 - Data Triangulation
Involves using different sources of information in order to increase the validity of a study
These sources are likely to be stakeholders in a program - participants, other researchers, program staff, other community members, and so on.
Then we put all data in single framework & apply various statistical tools to find out the dynamic on the market.
During the analysis stage, feedback from the stakeholder groups would be compared to determine areas of agreement as well as areas of divergence


