
Key Insights
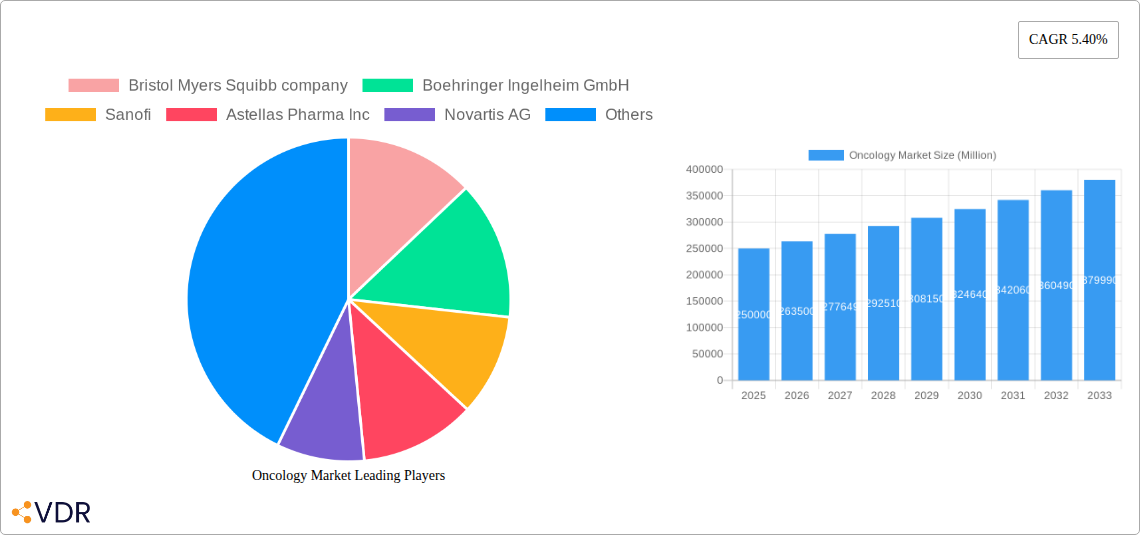
The global oncology market, currently exhibiting robust growth, is projected to reach a substantial size driven by several key factors. The rising prevalence of various cancer types, particularly lung, breast, and prostate cancers, fuels significant demand for innovative therapies. Technological advancements in cancer treatment, including targeted therapies, immunotherapies, and advancements in chemotherapy regimens, are major contributors to market expansion. Furthermore, increasing healthcare expenditure globally, coupled with improved diagnostic capabilities enabling earlier detection and treatment, significantly impact market growth. The market is segmented by treatment phase (I-IV), study design (treatment vs. observational), and cancer type, offering diversified opportunities for pharmaceutical companies. Competition is fierce among major players like Bristol Myers Squibb, Boehringer Ingelheim, and Novartis, leading to continuous innovation and the development of novel treatment options. Despite challenges such as high treatment costs and potential side effects, the market is expected to maintain a steady CAGR of 5.40% throughout the forecast period (2025-2033). The North American market, due to its advanced healthcare infrastructure and higher disposable income, currently holds a significant market share, though other regions like Asia-Pacific are experiencing rapid growth due to rising cancer incidence and increasing healthcare awareness.
The forecast period (2025-2033) will witness intensified research and development activities focused on personalized medicine and the development of less toxic treatments. Regulatory approvals for new oncology drugs will be crucial in shaping market dynamics. Government initiatives promoting cancer awareness and early detection programs also contribute positively. While pricing pressures and reimbursement challenges remain a concern, the long-term outlook for the oncology market remains overwhelmingly positive, fueled by an aging global population and the continuous effort to improve cancer treatment outcomes. The competitive landscape will likely see strategic alliances, mergers, and acquisitions as companies strive for market dominance. The market segmentation offers strategic opportunities for focusing on specific cancer types and treatment phases to achieve greater market penetration.
This comprehensive report provides a detailed analysis of the Oncology Market, encompassing market dynamics, growth trends, regional dominance, product landscape, key players, and future outlook. The study period covers 2019-2033, with 2025 as the base year and a forecast period of 2025-2033. The report segments the market by phase (Phase I, II, III, IV), design (Treatment Studies, Observational Studies), and cancer type (Lung Cancer, Breast Cancer, Leukemia, Prostate Cancer, Other Cancer Types). The report is invaluable for industry professionals, investors, and researchers seeking in-depth insights into this rapidly evolving market. The total market size is estimated at xx Million in 2025.
Oncology Market Dynamics & Structure
The oncology market is characterized by high market concentration amongst key players, intense competition, and significant technological innovation. The regulatory landscape plays a crucial role, impacting drug approvals and market access. The market is driven by an aging population, rising cancer incidence rates, and advancements in targeted therapies and immunotherapies. Mergers and acquisitions (M&A) are prevalent, shaping market consolidation and competitive dynamics.
- Market Concentration: Top 15 companies hold an estimated xx% market share (2025).
- Technological Innovation: Focus on personalized medicine, immunotherapy, targeted therapies, and gene therapy are key drivers.
- Regulatory Framework: Stringent regulatory approvals influence drug development timelines and market entry.
- Competitive Substitutes: Biosimilars and generic drugs pose competitive challenges to innovator drugs.
- End-User Demographics: Aging population and increased cancer incidence fuel market growth.
- M&A Trends: High volume of M&A activities, driven by expansion strategies and technological acquisition. xx M&A deals were recorded in 2024.
Oncology Market Growth Trends & Insights
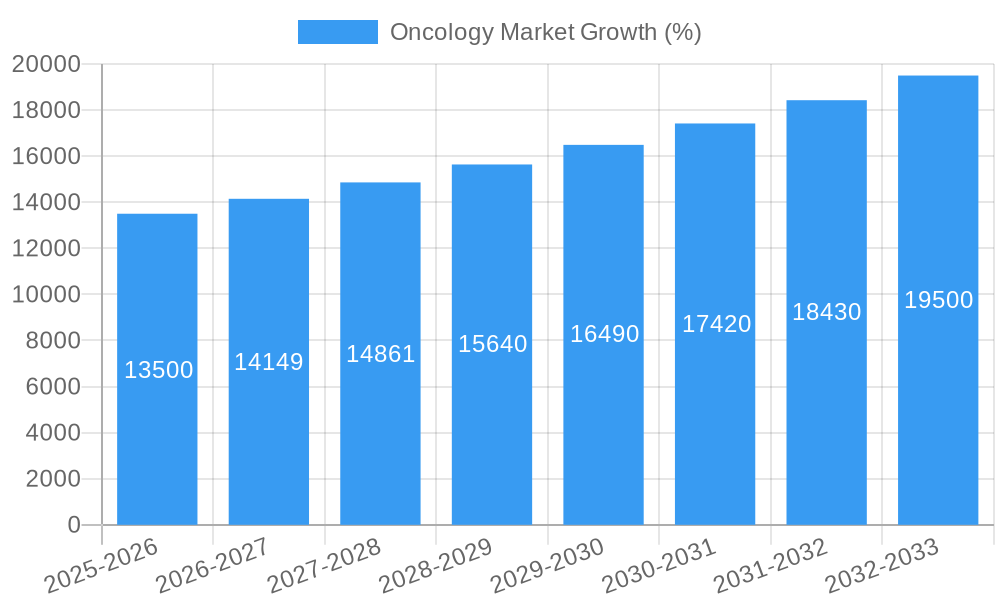
The oncology market is experiencing robust growth, driven by factors such as the increasing prevalence of cancer, advancements in treatment modalities, and rising healthcare expenditure. The market is projected to witness significant expansion throughout the forecast period, with a Compound Annual Growth Rate (CAGR) of xx% from 2025 to 2033. Technological advancements, including personalized medicine approaches and targeted therapies, are accelerating market adoption and improving patient outcomes. Changing consumer behavior, with increasing patient advocacy and demand for innovative treatments, further contributes to market growth. Market penetration is estimated at xx% in 2025.
Dominant Regions, Countries, or Segments in Oncology Market
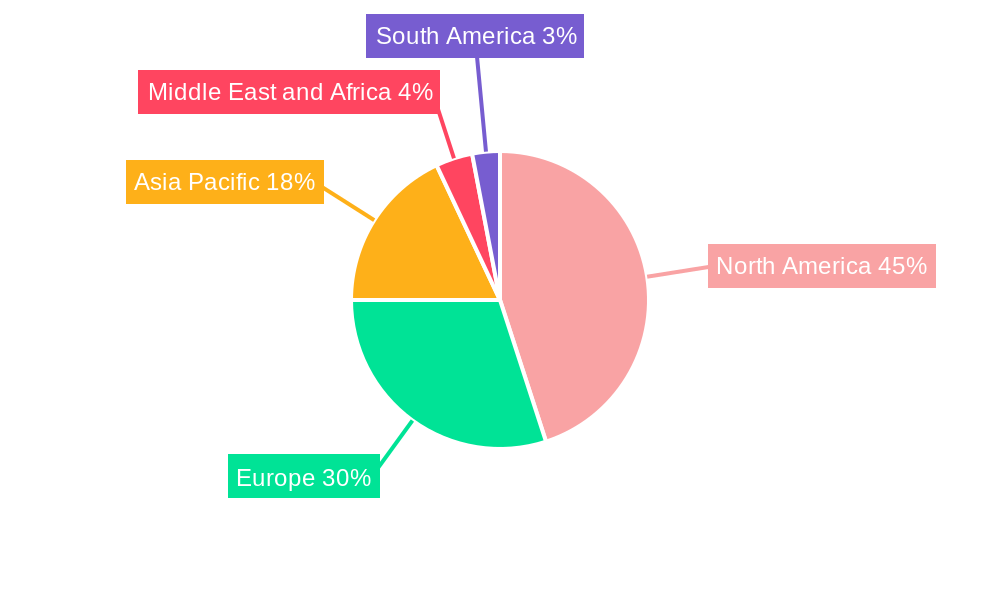
North America holds the largest market share due to advanced healthcare infrastructure, high cancer prevalence rates, and substantial investments in research and development. Within this region, the United States dominates. Europe is the second largest market, driven by a growing elderly population and increasing healthcare expenditure. Asia-Pacific shows significant growth potential with increasing awareness about cancer and rising disposable incomes.
- By Phase: Phase III clinical trials dominate the market due to late-stage development and regulatory approvals.
- By Design: Treatment studies hold a larger share than observational studies owing to their focus on direct treatment efficacy.
- By Cancer Type: Lung cancer, breast cancer, and prostate cancer represent significant market segments, reflecting high prevalence rates.
- Key Drivers: High prevalence of specific cancer types, technological advancements, and favorable regulatory frameworks.
Oncology Market Product Landscape
The oncology product landscape comprises a diverse range of therapeutic agents, including chemotherapy drugs, targeted therapies, immunotherapies, and supportive care medications. These products are characterized by varying mechanisms of action, efficacy profiles, and side effect profiles. Innovation is focused on improving treatment efficacy, minimizing toxicity, and personalizing treatment approaches. Key innovations include the development of targeted therapies, immunotherapies, and gene therapies that provide more effective and less toxic treatment options.
Key Drivers, Barriers & Challenges in Oncology Market
Key Drivers:
- Rising Cancer Incidence: Aging population and lifestyle factors drive increasing cancer cases.
- Technological Advancements: Novel therapies and diagnostic tools enhance treatment outcomes.
- Favorable Regulatory Policies: Accelerated approval pathways streamline drug development and market entry.
Challenges:
- High Drug Costs: The cost of novel cancer treatments presents a significant barrier to access. (Estimated impact: xx% reduction in market growth)
- Regulatory Hurdles: Stringent approval processes and clinical trial complexities delay market entry.
- Competitive Intensity: Many players are vying for market share, intensifying competition.
Emerging Opportunities in Oncology Market
- Expansion into Emerging Markets: Untapped potential in developing countries with growing healthcare infrastructure.
- Development of Novel Therapies: Focus on immunotherapy, gene therapy, and personalized medicine.
- Expansion of Biosimilars: Growing demand for cost-effective alternatives to innovator drugs.
Growth Accelerators in the Oncology Market Industry
Technological advancements in targeted therapies, immunotherapies, and diagnostics are accelerating market growth. Strategic partnerships between pharmaceutical companies and research institutions are fostering innovation. Expansion into emerging markets and the development of biosimilars are further contributing to market expansion.
Key Players Shaping the Oncology Market Market
- Bristol Myers Squibb company
- Boehringer Ingelheim GmbH
- Sanofi
- Astellas Pharma Inc
- Novartis AG
- Merck & Co Inc
- AstraZeneca PLC
- Eli Lilly and Company
- F Hoffmann-La Roche Ltd
- AbbVie Inc
- Johnson & Johnson
- Takeda Pharmaceutical Company Limited
- GlaxoSmithKline PLC
- Pfizer Inc
Notable Milestones in Oncology Market Sector
- June 2022: Novartis announced positive Phase III RATIONALE 306 trial results for tislelizumab in esophageal squamous cell carcinoma.
- March 2021: Merck Sharp & Dohme Corp. initiated a Phase II clinical trial for pembrolizumab/quavonlimab plus lenvatinib in hepatocellular carcinoma.
In-Depth Oncology Market Market Outlook
The oncology market is poised for sustained growth driven by continuous innovation in therapies and diagnostics, expanding access in emerging markets, and the increasing prevalence of cancer globally. Strategic partnerships, acquisitions, and focused R&D efforts will further shape market dynamics. The market presents significant opportunities for companies focused on developing and commercializing innovative cancer treatments and diagnostic tools.
Oncology Market Segmentation
-
1. Phase
- 1.1. Phase I
- 1.2. Phase II
- 1.3. Phase III
- 1.4. Phase IV
-
2. Design
- 2.1. Treatment Studies
- 2.2. Observational Studies
-
3. Cancer Type
- 3.1. Lung Cancer
- 3.2. Breast Cancer
- 3.3. Leukemia
- 3.4. Prostate Cancer
- 3.5. Other Cancer Types
Oncology Market Segmentation By Geography
-
1. North America
- 1.1. United States
- 1.2. Canada
- 1.3. Mexico
-
2. Europe
- 2.1. Germany
- 2.2. United Kingdom
- 2.3. France
- 2.4. Italy
- 2.5. Spain
- 2.6. Rest of Europe
-
3. Asia Pacific
- 3.1. China
- 3.2. Japan
- 3.3. India
- 3.4. Australia
- 3.5. South Korea
- 3.6. Rest of Asia Pacific
-
4. Middle East and Africa
- 4.1. GCC
- 4.2. South Africa
- 4.3. Rest of Middle East and Africa
-
5. South America
- 5.1. Brazil
- 5.2. Argentina
- 5.3. Rest of South America
Oncology Market REPORT HIGHLIGHTS
| Aspects | Details |
|---|---|
| Study Period | 2019-2033 |
| Base Year | 2024 |
| Estimated Year | 2025 |
| Forecast Period | 2025-2033 |
| Historical Period | 2019-2024 |
| Growth Rate | CAGR of 5.40% from 2019-2033 |
| Segmentation |
|
Table of Contents
- 1. Introduction
- 1.1. Research Scope
- 1.2. Market Segmentation
- 1.3. Research Methodology
- 1.4. Definitions and Assumptions
- 2. Executive Summary
- 2.1. Introduction
- 3. Market Dynamics
- 3.1. Introduction
- 3.2. Market Drivers
- 3.2.1. Growing Burden of Cancer Worldwide; Increasing Role of Precision and Personalized Medicine for Cancer Treatment
- 3.3. Market Restrains
- 3.3.1. Stringent Regulations for Patient Enrollment
- 3.4. Market Trends
- 3.4.1. Lung Cancer Segment is Expected to Hold Significant Market Growth Over the Forecast Period
- 4. Market Factor Analysis
- 4.1. Porters Five Forces
- 4.2. Supply/Value Chain
- 4.3. PESTEL analysis
- 4.4. Market Entropy
- 4.5. Patent/Trademark Analysis
- 5. Global Oncology Market Analysis, Insights and Forecast, 2019-2031
- 5.1. Market Analysis, Insights and Forecast - by Phase
- 5.1.1. Phase I
- 5.1.2. Phase II
- 5.1.3. Phase III
- 5.1.4. Phase IV
- 5.2. Market Analysis, Insights and Forecast - by Design
- 5.2.1. Treatment Studies
- 5.2.2. Observational Studies
- 5.3. Market Analysis, Insights and Forecast - by Cancer Type
- 5.3.1. Lung Cancer
- 5.3.2. Breast Cancer
- 5.3.3. Leukemia
- 5.3.4. Prostate Cancer
- 5.3.5. Other Cancer Types
- 5.4. Market Analysis, Insights and Forecast - by Region
- 5.4.1. North America
- 5.4.2. Europe
- 5.4.3. Asia Pacific
- 5.4.4. Middle East and Africa
- 5.4.5. South America
- 5.1. Market Analysis, Insights and Forecast - by Phase
- 6. North America Oncology Market Analysis, Insights and Forecast, 2019-2031
- 6.1. Market Analysis, Insights and Forecast - by Phase
- 6.1.1. Phase I
- 6.1.2. Phase II
- 6.1.3. Phase III
- 6.1.4. Phase IV
- 6.2. Market Analysis, Insights and Forecast - by Design
- 6.2.1. Treatment Studies
- 6.2.2. Observational Studies
- 6.3. Market Analysis, Insights and Forecast - by Cancer Type
- 6.3.1. Lung Cancer
- 6.3.2. Breast Cancer
- 6.3.3. Leukemia
- 6.3.4. Prostate Cancer
- 6.3.5. Other Cancer Types
- 6.1. Market Analysis, Insights and Forecast - by Phase
- 7. Europe Oncology Market Analysis, Insights and Forecast, 2019-2031
- 7.1. Market Analysis, Insights and Forecast - by Phase
- 7.1.1. Phase I
- 7.1.2. Phase II
- 7.1.3. Phase III
- 7.1.4. Phase IV
- 7.2. Market Analysis, Insights and Forecast - by Design
- 7.2.1. Treatment Studies
- 7.2.2. Observational Studies
- 7.3. Market Analysis, Insights and Forecast - by Cancer Type
- 7.3.1. Lung Cancer
- 7.3.2. Breast Cancer
- 7.3.3. Leukemia
- 7.3.4. Prostate Cancer
- 7.3.5. Other Cancer Types
- 7.1. Market Analysis, Insights and Forecast - by Phase
- 8. Asia Pacific Oncology Market Analysis, Insights and Forecast, 2019-2031
- 8.1. Market Analysis, Insights and Forecast - by Phase
- 8.1.1. Phase I
- 8.1.2. Phase II
- 8.1.3. Phase III
- 8.1.4. Phase IV
- 8.2. Market Analysis, Insights and Forecast - by Design
- 8.2.1. Treatment Studies
- 8.2.2. Observational Studies
- 8.3. Market Analysis, Insights and Forecast - by Cancer Type
- 8.3.1. Lung Cancer
- 8.3.2. Breast Cancer
- 8.3.3. Leukemia
- 8.3.4. Prostate Cancer
- 8.3.5. Other Cancer Types
- 8.1. Market Analysis, Insights and Forecast - by Phase
- 9. Middle East and Africa Oncology Market Analysis, Insights and Forecast, 2019-2031
- 9.1. Market Analysis, Insights and Forecast - by Phase
- 9.1.1. Phase I
- 9.1.2. Phase II
- 9.1.3. Phase III
- 9.1.4. Phase IV
- 9.2. Market Analysis, Insights and Forecast - by Design
- 9.2.1. Treatment Studies
- 9.2.2. Observational Studies
- 9.3. Market Analysis, Insights and Forecast - by Cancer Type
- 9.3.1. Lung Cancer
- 9.3.2. Breast Cancer
- 9.3.3. Leukemia
- 9.3.4. Prostate Cancer
- 9.3.5. Other Cancer Types
- 9.1. Market Analysis, Insights and Forecast - by Phase
- 10. South America Oncology Market Analysis, Insights and Forecast, 2019-2031
- 10.1. Market Analysis, Insights and Forecast - by Phase
- 10.1.1. Phase I
- 10.1.2. Phase II
- 10.1.3. Phase III
- 10.1.4. Phase IV
- 10.2. Market Analysis, Insights and Forecast - by Design
- 10.2.1. Treatment Studies
- 10.2.2. Observational Studies
- 10.3. Market Analysis, Insights and Forecast - by Cancer Type
- 10.3.1. Lung Cancer
- 10.3.2. Breast Cancer
- 10.3.3. Leukemia
- 10.3.4. Prostate Cancer
- 10.3.5. Other Cancer Types
- 10.1. Market Analysis, Insights and Forecast - by Phase
- 11. North America Oncology Market Analysis, Insights and Forecast, 2019-2031
- 11.1. Market Analysis, Insights and Forecast - By Country/Sub-region
- 11.1.1 United States
- 11.1.2 Canada
- 11.1.3 Mexico
- 12. Europe Oncology Market Analysis, Insights and Forecast, 2019-2031
- 12.1. Market Analysis, Insights and Forecast - By Country/Sub-region
- 12.1.1 Germany
- 12.1.2 United Kingdom
- 12.1.3 France
- 12.1.4 Italy
- 12.1.5 Spain
- 12.1.6 Rest of Europe
- 13. Asia Pacific Oncology Market Analysis, Insights and Forecast, 2019-2031
- 13.1. Market Analysis, Insights and Forecast - By Country/Sub-region
- 13.1.1 China
- 13.1.2 Japan
- 13.1.3 India
- 13.1.4 Australia
- 13.1.5 South Korea
- 13.1.6 Rest of Asia Pacific
- 14. Middle East and Africa Oncology Market Analysis, Insights and Forecast, 2019-2031
- 14.1. Market Analysis, Insights and Forecast - By Country/Sub-region
- 14.1.1 GCC
- 14.1.2 South Africa
- 14.1.3 Rest of Middle East and Africa
- 15. South America Oncology Market Analysis, Insights and Forecast, 2019-2031
- 15.1. Market Analysis, Insights and Forecast - By Country/Sub-region
- 15.1.1 Brazil
- 15.1.2 Argentina
- 15.1.3 Rest of South America
- 16. Competitive Analysis
- 16.1. Global Market Share Analysis 2024
- 16.2. Company Profiles
- 16.2.1 Bristol Myers Squibb company
- 16.2.1.1. Overview
- 16.2.1.2. Products
- 16.2.1.3. SWOT Analysis
- 16.2.1.4. Recent Developments
- 16.2.1.5. Financials (Based on Availability)
- 16.2.2 Boehringer Ingelheim GmbH
- 16.2.2.1. Overview
- 16.2.2.2. Products
- 16.2.2.3. SWOT Analysis
- 16.2.2.4. Recent Developments
- 16.2.2.5. Financials (Based on Availability)
- 16.2.3 Sanofi
- 16.2.3.1. Overview
- 16.2.3.2. Products
- 16.2.3.3. SWOT Analysis
- 16.2.3.4. Recent Developments
- 16.2.3.5. Financials (Based on Availability)
- 16.2.4 Astellas Pharma Inc
- 16.2.4.1. Overview
- 16.2.4.2. Products
- 16.2.4.3. SWOT Analysis
- 16.2.4.4. Recent Developments
- 16.2.4.5. Financials (Based on Availability)
- 16.2.5 Novartis AG
- 16.2.5.1. Overview
- 16.2.5.2. Products
- 16.2.5.3. SWOT Analysis
- 16.2.5.4. Recent Developments
- 16.2.5.5. Financials (Based on Availability)
- 16.2.6 Merck & Co Inc
- 16.2.6.1. Overview
- 16.2.6.2. Products
- 16.2.6.3. SWOT Analysis
- 16.2.6.4. Recent Developments
- 16.2.6.5. Financials (Based on Availability)
- 16.2.7 AstraZeneca PLC
- 16.2.7.1. Overview
- 16.2.7.2. Products
- 16.2.7.3. SWOT Analysis
- 16.2.7.4. Recent Developments
- 16.2.7.5. Financials (Based on Availability)
- 16.2.8 Eli Lilly and Company
- 16.2.8.1. Overview
- 16.2.8.2. Products
- 16.2.8.3. SWOT Analysis
- 16.2.8.4. Recent Developments
- 16.2.8.5. Financials (Based on Availability)
- 16.2.9 F Hoffmann-La Roche Ltd
- 16.2.9.1. Overview
- 16.2.9.2. Products
- 16.2.9.3. SWOT Analysis
- 16.2.9.4. Recent Developments
- 16.2.9.5. Financials (Based on Availability)
- 16.2.10 AbbVie Inc
- 16.2.10.1. Overview
- 16.2.10.2. Products
- 16.2.10.3. SWOT Analysis
- 16.2.10.4. Recent Developments
- 16.2.10.5. Financials (Based on Availability)
- 16.2.11 Johnson & Johnson
- 16.2.11.1. Overview
- 16.2.11.2. Products
- 16.2.11.3. SWOT Analysis
- 16.2.11.4. Recent Developments
- 16.2.11.5. Financials (Based on Availability)
- 16.2.12 Takeda Pharmaceutical Company Limited*List Not Exhaustive
- 16.2.12.1. Overview
- 16.2.12.2. Products
- 16.2.12.3. SWOT Analysis
- 16.2.12.4. Recent Developments
- 16.2.12.5. Financials (Based on Availability)
- 16.2.13 GlaxoSmithKline PLC
- 16.2.13.1. Overview
- 16.2.13.2. Products
- 16.2.13.3. SWOT Analysis
- 16.2.13.4. Recent Developments
- 16.2.13.5. Financials (Based on Availability)
- 16.2.14 Pfizer Inc
- 16.2.14.1. Overview
- 16.2.14.2. Products
- 16.2.14.3. SWOT Analysis
- 16.2.14.4. Recent Developments
- 16.2.14.5. Financials (Based on Availability)
- 16.2.1 Bristol Myers Squibb company
List of Figures
- Figure 1: Global Oncology Market Revenue Breakdown (Million, %) by Region 2024 & 2032
- Figure 2: North America Oncology Market Revenue (Million), by Country 2024 & 2032
- Figure 3: North America Oncology Market Revenue Share (%), by Country 2024 & 2032
- Figure 4: Europe Oncology Market Revenue (Million), by Country 2024 & 2032
- Figure 5: Europe Oncology Market Revenue Share (%), by Country 2024 & 2032
- Figure 6: Asia Pacific Oncology Market Revenue (Million), by Country 2024 & 2032
- Figure 7: Asia Pacific Oncology Market Revenue Share (%), by Country 2024 & 2032
- Figure 8: Middle East and Africa Oncology Market Revenue (Million), by Country 2024 & 2032
- Figure 9: Middle East and Africa Oncology Market Revenue Share (%), by Country 2024 & 2032
- Figure 10: South America Oncology Market Revenue (Million), by Country 2024 & 2032
- Figure 11: South America Oncology Market Revenue Share (%), by Country 2024 & 2032
- Figure 12: North America Oncology Market Revenue (Million), by Phase 2024 & 2032
- Figure 13: North America Oncology Market Revenue Share (%), by Phase 2024 & 2032
- Figure 14: North America Oncology Market Revenue (Million), by Design 2024 & 2032
- Figure 15: North America Oncology Market Revenue Share (%), by Design 2024 & 2032
- Figure 16: North America Oncology Market Revenue (Million), by Cancer Type 2024 & 2032
- Figure 17: North America Oncology Market Revenue Share (%), by Cancer Type 2024 & 2032
- Figure 18: North America Oncology Market Revenue (Million), by Country 2024 & 2032
- Figure 19: North America Oncology Market Revenue Share (%), by Country 2024 & 2032
- Figure 20: Europe Oncology Market Revenue (Million), by Phase 2024 & 2032
- Figure 21: Europe Oncology Market Revenue Share (%), by Phase 2024 & 2032
- Figure 22: Europe Oncology Market Revenue (Million), by Design 2024 & 2032
- Figure 23: Europe Oncology Market Revenue Share (%), by Design 2024 & 2032
- Figure 24: Europe Oncology Market Revenue (Million), by Cancer Type 2024 & 2032
- Figure 25: Europe Oncology Market Revenue Share (%), by Cancer Type 2024 & 2032
- Figure 26: Europe Oncology Market Revenue (Million), by Country 2024 & 2032
- Figure 27: Europe Oncology Market Revenue Share (%), by Country 2024 & 2032
- Figure 28: Asia Pacific Oncology Market Revenue (Million), by Phase 2024 & 2032
- Figure 29: Asia Pacific Oncology Market Revenue Share (%), by Phase 2024 & 2032
- Figure 30: Asia Pacific Oncology Market Revenue (Million), by Design 2024 & 2032
- Figure 31: Asia Pacific Oncology Market Revenue Share (%), by Design 2024 & 2032
- Figure 32: Asia Pacific Oncology Market Revenue (Million), by Cancer Type 2024 & 2032
- Figure 33: Asia Pacific Oncology Market Revenue Share (%), by Cancer Type 2024 & 2032
- Figure 34: Asia Pacific Oncology Market Revenue (Million), by Country 2024 & 2032
- Figure 35: Asia Pacific Oncology Market Revenue Share (%), by Country 2024 & 2032
- Figure 36: Middle East and Africa Oncology Market Revenue (Million), by Phase 2024 & 2032
- Figure 37: Middle East and Africa Oncology Market Revenue Share (%), by Phase 2024 & 2032
- Figure 38: Middle East and Africa Oncology Market Revenue (Million), by Design 2024 & 2032
- Figure 39: Middle East and Africa Oncology Market Revenue Share (%), by Design 2024 & 2032
- Figure 40: Middle East and Africa Oncology Market Revenue (Million), by Cancer Type 2024 & 2032
- Figure 41: Middle East and Africa Oncology Market Revenue Share (%), by Cancer Type 2024 & 2032
- Figure 42: Middle East and Africa Oncology Market Revenue (Million), by Country 2024 & 2032
- Figure 43: Middle East and Africa Oncology Market Revenue Share (%), by Country 2024 & 2032
- Figure 44: South America Oncology Market Revenue (Million), by Phase 2024 & 2032
- Figure 45: South America Oncology Market Revenue Share (%), by Phase 2024 & 2032
- Figure 46: South America Oncology Market Revenue (Million), by Design 2024 & 2032
- Figure 47: South America Oncology Market Revenue Share (%), by Design 2024 & 2032
- Figure 48: South America Oncology Market Revenue (Million), by Cancer Type 2024 & 2032
- Figure 49: South America Oncology Market Revenue Share (%), by Cancer Type 2024 & 2032
- Figure 50: South America Oncology Market Revenue (Million), by Country 2024 & 2032
- Figure 51: South America Oncology Market Revenue Share (%), by Country 2024 & 2032
List of Tables
- Table 1: Global Oncology Market Revenue Million Forecast, by Region 2019 & 2032
- Table 2: Global Oncology Market Revenue Million Forecast, by Phase 2019 & 2032
- Table 3: Global Oncology Market Revenue Million Forecast, by Design 2019 & 2032
- Table 4: Global Oncology Market Revenue Million Forecast, by Cancer Type 2019 & 2032
- Table 5: Global Oncology Market Revenue Million Forecast, by Region 2019 & 2032
- Table 6: Global Oncology Market Revenue Million Forecast, by Country 2019 & 2032
- Table 7: United States Oncology Market Revenue (Million) Forecast, by Application 2019 & 2032
- Table 8: Canada Oncology Market Revenue (Million) Forecast, by Application 2019 & 2032
- Table 9: Mexico Oncology Market Revenue (Million) Forecast, by Application 2019 & 2032
- Table 10: Global Oncology Market Revenue Million Forecast, by Country 2019 & 2032
- Table 11: Germany Oncology Market Revenue (Million) Forecast, by Application 2019 & 2032
- Table 12: United Kingdom Oncology Market Revenue (Million) Forecast, by Application 2019 & 2032
- Table 13: France Oncology Market Revenue (Million) Forecast, by Application 2019 & 2032
- Table 14: Italy Oncology Market Revenue (Million) Forecast, by Application 2019 & 2032
- Table 15: Spain Oncology Market Revenue (Million) Forecast, by Application 2019 & 2032
- Table 16: Rest of Europe Oncology Market Revenue (Million) Forecast, by Application 2019 & 2032
- Table 17: Global Oncology Market Revenue Million Forecast, by Country 2019 & 2032
- Table 18: China Oncology Market Revenue (Million) Forecast, by Application 2019 & 2032
- Table 19: Japan Oncology Market Revenue (Million) Forecast, by Application 2019 & 2032
- Table 20: India Oncology Market Revenue (Million) Forecast, by Application 2019 & 2032
- Table 21: Australia Oncology Market Revenue (Million) Forecast, by Application 2019 & 2032
- Table 22: South Korea Oncology Market Revenue (Million) Forecast, by Application 2019 & 2032
- Table 23: Rest of Asia Pacific Oncology Market Revenue (Million) Forecast, by Application 2019 & 2032
- Table 24: Global Oncology Market Revenue Million Forecast, by Country 2019 & 2032
- Table 25: GCC Oncology Market Revenue (Million) Forecast, by Application 2019 & 2032
- Table 26: South Africa Oncology Market Revenue (Million) Forecast, by Application 2019 & 2032
- Table 27: Rest of Middle East and Africa Oncology Market Revenue (Million) Forecast, by Application 2019 & 2032
- Table 28: Global Oncology Market Revenue Million Forecast, by Country 2019 & 2032
- Table 29: Brazil Oncology Market Revenue (Million) Forecast, by Application 2019 & 2032
- Table 30: Argentina Oncology Market Revenue (Million) Forecast, by Application 2019 & 2032
- Table 31: Rest of South America Oncology Market Revenue (Million) Forecast, by Application 2019 & 2032
- Table 32: Global Oncology Market Revenue Million Forecast, by Phase 2019 & 2032
- Table 33: Global Oncology Market Revenue Million Forecast, by Design 2019 & 2032
- Table 34: Global Oncology Market Revenue Million Forecast, by Cancer Type 2019 & 2032
- Table 35: Global Oncology Market Revenue Million Forecast, by Country 2019 & 2032
- Table 36: United States Oncology Market Revenue (Million) Forecast, by Application 2019 & 2032
- Table 37: Canada Oncology Market Revenue (Million) Forecast, by Application 2019 & 2032
- Table 38: Mexico Oncology Market Revenue (Million) Forecast, by Application 2019 & 2032
- Table 39: Global Oncology Market Revenue Million Forecast, by Phase 2019 & 2032
- Table 40: Global Oncology Market Revenue Million Forecast, by Design 2019 & 2032
- Table 41: Global Oncology Market Revenue Million Forecast, by Cancer Type 2019 & 2032
- Table 42: Global Oncology Market Revenue Million Forecast, by Country 2019 & 2032
- Table 43: Germany Oncology Market Revenue (Million) Forecast, by Application 2019 & 2032
- Table 44: United Kingdom Oncology Market Revenue (Million) Forecast, by Application 2019 & 2032
- Table 45: France Oncology Market Revenue (Million) Forecast, by Application 2019 & 2032
- Table 46: Italy Oncology Market Revenue (Million) Forecast, by Application 2019 & 2032
- Table 47: Spain Oncology Market Revenue (Million) Forecast, by Application 2019 & 2032
- Table 48: Rest of Europe Oncology Market Revenue (Million) Forecast, by Application 2019 & 2032
- Table 49: Global Oncology Market Revenue Million Forecast, by Phase 2019 & 2032
- Table 50: Global Oncology Market Revenue Million Forecast, by Design 2019 & 2032
- Table 51: Global Oncology Market Revenue Million Forecast, by Cancer Type 2019 & 2032
- Table 52: Global Oncology Market Revenue Million Forecast, by Country 2019 & 2032
- Table 53: China Oncology Market Revenue (Million) Forecast, by Application 2019 & 2032
- Table 54: Japan Oncology Market Revenue (Million) Forecast, by Application 2019 & 2032
- Table 55: India Oncology Market Revenue (Million) Forecast, by Application 2019 & 2032
- Table 56: Australia Oncology Market Revenue (Million) Forecast, by Application 2019 & 2032
- Table 57: South Korea Oncology Market Revenue (Million) Forecast, by Application 2019 & 2032
- Table 58: Rest of Asia Pacific Oncology Market Revenue (Million) Forecast, by Application 2019 & 2032
- Table 59: Global Oncology Market Revenue Million Forecast, by Phase 2019 & 2032
- Table 60: Global Oncology Market Revenue Million Forecast, by Design 2019 & 2032
- Table 61: Global Oncology Market Revenue Million Forecast, by Cancer Type 2019 & 2032
- Table 62: Global Oncology Market Revenue Million Forecast, by Country 2019 & 2032
- Table 63: GCC Oncology Market Revenue (Million) Forecast, by Application 2019 & 2032
- Table 64: South Africa Oncology Market Revenue (Million) Forecast, by Application 2019 & 2032
- Table 65: Rest of Middle East and Africa Oncology Market Revenue (Million) Forecast, by Application 2019 & 2032
- Table 66: Global Oncology Market Revenue Million Forecast, by Phase 2019 & 2032
- Table 67: Global Oncology Market Revenue Million Forecast, by Design 2019 & 2032
- Table 68: Global Oncology Market Revenue Million Forecast, by Cancer Type 2019 & 2032
- Table 69: Global Oncology Market Revenue Million Forecast, by Country 2019 & 2032
- Table 70: Brazil Oncology Market Revenue (Million) Forecast, by Application 2019 & 2032
- Table 71: Argentina Oncology Market Revenue (Million) Forecast, by Application 2019 & 2032
- Table 72: Rest of South America Oncology Market Revenue (Million) Forecast, by Application 2019 & 2032
Frequently Asked Questions
1. What is the projected Compound Annual Growth Rate (CAGR) of the Oncology Market?
The projected CAGR is approximately 5.40%.
2. Which companies are prominent players in the Oncology Market?
Key companies in the market include Bristol Myers Squibb company, Boehringer Ingelheim GmbH, Sanofi, Astellas Pharma Inc, Novartis AG, Merck & Co Inc, AstraZeneca PLC, Eli Lilly and Company, F Hoffmann-La Roche Ltd, AbbVie Inc, Johnson & Johnson, Takeda Pharmaceutical Company Limited*List Not Exhaustive, GlaxoSmithKline PLC, Pfizer Inc.
3. What are the main segments of the Oncology Market?
The market segments include Phase, Design, Cancer Type.
4. Can you provide details about the market size?
The market size is estimated to be USD XX Million as of 2022.
5. What are some drivers contributing to market growth?
Growing Burden of Cancer Worldwide; Increasing Role of Precision and Personalized Medicine for Cancer Treatment.
6. What are the notable trends driving market growth?
Lung Cancer Segment is Expected to Hold Significant Market Growth Over the Forecast Period.
7. Are there any restraints impacting market growth?
Stringent Regulations for Patient Enrollment.
8. Can you provide examples of recent developments in the market?
In June 2022, Novartis announced results from the Phase III RATIONALE 306 trial showing tislelizumab plus chemotherapy significantly improved overall survival (OS) as a first-line treatment for adult patients with unresectable, locally advanced, or metastatic esophageal squamous cell carcinoma (ESCC), regardless of PD-L1 status.
9. What pricing options are available for accessing the report?
Pricing options include single-user, multi-user, and enterprise licenses priced at USD 4750, USD 5250, and USD 8750 respectively.
10. Is the market size provided in terms of value or volume?
The market size is provided in terms of value, measured in Million.
11. Are there any specific market keywords associated with the report?
Yes, the market keyword associated with the report is "Oncology Market," which aids in identifying and referencing the specific market segment covered.
12. How do I determine which pricing option suits my needs best?
The pricing options vary based on user requirements and access needs. Individual users may opt for single-user licenses, while businesses requiring broader access may choose multi-user or enterprise licenses for cost-effective access to the report.
13. Are there any additional resources or data provided in the Oncology Market report?
While the report offers comprehensive insights, it's advisable to review the specific contents or supplementary materials provided to ascertain if additional resources or data are available.
14. How can I stay updated on further developments or reports in the Oncology Market?
To stay informed about further developments, trends, and reports in the Oncology Market, consider subscribing to industry newsletters, following relevant companies and organizations, or regularly checking reputable industry news sources and publications.
Methodology
Step 1 - Identification of Relevant Samples Size from Population Database


Step 2 - Approaches for Defining Global Market Size (Value, Volume* & Price*)

Note*: In applicable scenarios
Step 3 - Data Sources
Primary Research
- Web Analytics
- Survey Reports
- Research Institute
- Latest Research Reports
- Opinion Leaders
Secondary Research
- Annual Reports
- White Paper
- Latest Press Release
- Industry Association
- Paid Database
- Investor Presentations

Step 4 - Data Triangulation
Involves using different sources of information in order to increase the validity of a study
These sources are likely to be stakeholders in a program - participants, other researchers, program staff, other community members, and so on.
Then we put all data in single framework & apply various statistical tools to find out the dynamic on the market.
During the analysis stage, feedback from the stakeholder groups would be compared to determine areas of agreement as well as areas of divergence


