


Key Insights
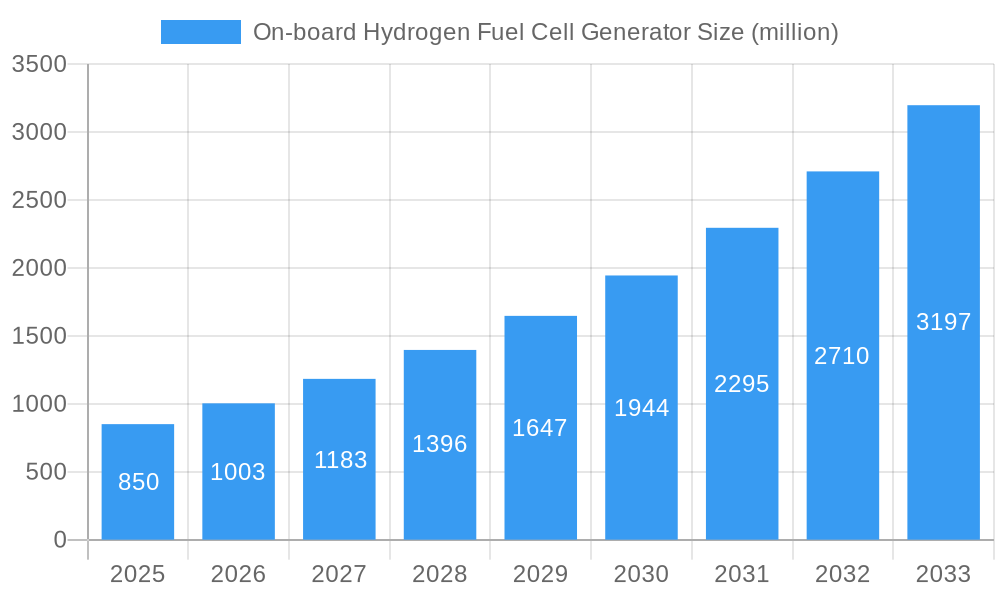
The global On-board Hydrogen Fuel Cell Generator market is projected for substantial growth, driven by escalating demand for sustainable and efficient power solutions in maritime and specialized transport. With an estimated market size of 10.64 billion in 2025, the sector is anticipated to expand at a Compound Annual Growth Rate (CAGR) of 25.9% by 2033. This significant expansion is propelled by the imperative to reduce carbon emissions across industries historically dependent on fossil fuels. The yachting segment is a key influencer, as discerning consumers and commercial operators increasingly favor eco-friendly onboard power alternatives offering quiet operation and extended range. Furthermore, the rise of shuttle services, particularly in environmentally conscious urban centers and tourist hubs, is adopting hydrogen fuel cells for their zero-emission benefits and competitive operational costs. The "Others" segment, which includes emergency backup power for critical infrastructure, mobile power for events, and specialized industrial equipment, also presents considerable growth prospects as the technology's maturity and versatility become more evident.

On-board Hydrogen Fuel Cell Generator Market Size (In Billion)

Technological advancements in hydrogen fuel cell efficiency and storage, supported by favorable government regulations and green energy incentives, are strengthening market confidence and investment. The market features a trend towards high-capacity generators, with segments from 100-200kW and above 200kW expected to experience the most rapid adoption, aligning with the needs of larger vessels and commercial operations. Leading industry players such as Toshiba, H2X Global, Toyota, GAUSSIN, and BOC HYMERA are actively driving innovation, introducing advanced solutions, and scaling production. While initial high costs of fuel cell systems and the requirement for extensive hydrogen refueling infrastructure present challenges, these are being progressively mitigated through economies of scale and strategic alliances. Nevertheless, the overarching global drive towards decarbonization and the inherent advantages of hydrogen fuel cells, including high energy density and zero tailpipe emissions, position this market for sustained and transformative development.
On-board Hydrogen Fuel Cell Generator Company Market Share
On-board Hydrogen Fuel Cell Generator Market Dynamics & Structure Report
This comprehensive report delves into the intricate dynamics and structure of the global On-board Hydrogen Fuel Cell Generator market. Spanning from 2019 to 2033, with a base year of 2025, it provides an in-depth analysis of market concentration, technological innovation drivers, and the evolving regulatory frameworks shaping adoption. We examine competitive product substitutes, such as battery-electric systems and traditional generators, and their impact on the hydrogen fuel cell segment. End-user demographics are scrutinized to understand adoption patterns and future demand across various applications. The report also analyzes Mergers & Acquisitions (M&A) trends, identifying key strategic consolidations and investments that are reshaping the competitive landscape. Insights include an estimated XX% market share consolidation by the top 5 players in the forecast period and a XX million unit volume in M&A deals observed during the historical period, reflecting the growing strategic interest in this nascent but rapidly advancing sector.
- Market Concentration: Characterized by a mix of established industrial players and agile startups, with a gradual increase in consolidation expected.
- Technological Innovation Drivers: Driven by advancements in fuel cell efficiency, hydrogen storage solutions, and system integration for diverse applications.
- Regulatory Frameworks: Growing governmental support for hydrogen as a clean energy source, influencing emissions standards and incentives.
- Competitive Product Substitutes: Battery-electric systems and advanced diesel generators pose significant competition, necessitating cost-effectiveness and performance parity.
- End-User Demographics: Shifting towards environmentally conscious industries like maritime and specialized transport seeking zero-emission solutions.
- M&A Trends: An increasing number of strategic partnerships and acquisitions aimed at accelerating market entry and technology integration.
On-board Hydrogen Fuel Cell Generator Growth Trends & Insights
The On-board Hydrogen Fuel Cell Generator market is poised for significant expansion, projected to reach approximately $XXX million by 2033. This growth is fueled by a confluence of increasing environmental consciousness, stringent emission regulations, and continuous technological advancements in hydrogen fuel cell technology. Adoption rates are projected to accelerate from XX% in 2025 to an estimated XX% by 2033, demonstrating a clear upward trajectory. Technological disruptions, particularly in enhancing power density, reducing system costs, and improving hydrogen storage efficiency, are key enablers. Consumer behavior is shifting towards sustainable and emissions-free power solutions, especially in sectors with high operational demands and significant carbon footprints. The CAGR for the forecast period is estimated at XX%, reflecting a robust growth trajectory. Market penetration is expected to rise from an initial XX% in niche applications to a broader adoption across various vehicle types and industrial uses. The parent market, encompassing the broader stationary and mobile power generation, provides a substantial foundation for the on-board segment's growth. The child market, focusing on specific applications like yachting and shuttles, showcases targeted innovation and early adoption. We project the market size to evolve from approximately $XXX million in 2019 to an estimated $XXX million in 2025, and subsequently to $XXX million by the end of the forecast period in 2033. This evolution is driven by a persistent demand for cleaner energy alternatives and the increasing feasibility of hydrogen infrastructure. The integration of advanced materials and intelligent control systems will further enhance the performance and reliability of these generators, making them a more attractive proposition for a wider array of applications. The increasing global commitment to decarbonization targets acts as a powerful tailwind for this market.
Dominant Regions, Countries, or Segments in On-board Hydrogen Fuel Cell Generator
The Europe region is emerging as the dominant force in the On-board Hydrogen Fuel Cell Generator market, driven by strong governmental initiatives, advanced research and development capabilities, and a proactive approach to achieving ambitious climate targets. The increasing adoption in Yachting applications within this region underscores the demand for silent, emissions-free power solutions in luxury and commercial maritime sectors. Within Europe, Germany and Norway are leading the charge, establishing comprehensive hydrogen strategies and supporting infrastructure development. The >200kW segment is experiencing significant growth, catering to the power demands of larger vessels and specialized transport, aligning with the increasing trend towards electrification of heavy-duty applications. This dominance is further propelled by favorable regulatory frameworks, such as the EU's Green Deal, which incentivizes the deployment of zero-emission technologies.
- Leading Region: Europe. Extensive research funding, supportive policies, and a strong drive towards decarbonization.
- Dominant Country: Germany. A leader in automotive R&D and hydrogen infrastructure development, with significant investments in fuel cell technology.
- Leading Application Segment: Yachting. High demand for silent, zero-emission power generation, driven by environmental regulations and luxury market trends.
- Leading Type Segment: >200kW. Essential for powering larger vessels, heavy-duty transport, and specialized industrial applications requiring substantial power output.
- Key Drivers:
- Economic Policies: Subsidies, tax incentives, and grants promoting hydrogen fuel cell adoption.
- Infrastructure Development: Growing investment in hydrogen refueling stations and production facilities.
- Environmental Regulations: Stringent emissions standards for maritime and transportation sectors.
- Technological Advancement: Continuous improvements in fuel cell efficiency and durability.
- Consumer Preference: Increasing demand for sustainable and eco-friendly power solutions.
The market share for on-board hydrogen fuel cell generators in the yachting segment is projected to reach XX% of the total maritime application market by 2033. Similarly, the >200kW power output segment is expected to capture XX% of the overall on-board generator market share within the forecast period, highlighting its critical role in powering larger applications. The growth potential in these segments is substantial, driven by the ongoing transition away from fossil fuels in the maritime and heavy-duty transport industries.
On-board Hydrogen Fuel Cell Generator Product Landscape
The product landscape of On-board Hydrogen Fuel Cell Generators is characterized by rapid innovation, focusing on enhanced power density, improved efficiency, and extended operational lifespans. Companies are developing compact and lightweight systems tailored for specific applications, such as the <50kW units for auxiliary power on smaller vessels and specialized drones, and the >200kW units for primary propulsion and power generation on larger yachts and heavy-duty shuttles. Key advancements include the integration of advanced materials in fuel cell stacks to reduce cost and increase durability, alongside sophisticated thermal management systems for optimal performance in diverse environmental conditions. Unique selling propositions often revolve around zero-emission operation, reduced noise pollution, and higher energy efficiency compared to traditional generators.
Key Drivers, Barriers & Challenges in On-board Hydrogen Fuel Cell Generator
The On-board Hydrogen Fuel Cell Generator market is propelled by several key drivers, including the escalating global demand for clean energy solutions, stringent environmental regulations mandating reduced emissions, and significant advancements in fuel cell technology leading to improved efficiency and reduced costs. Government incentives and the growing commitment to decarbonization targets across various industries, particularly maritime and transportation, further accelerate adoption.
- Key Drivers:
- Environmental Regulations: Global push for zero-emission power sources.
- Technological Advancements: Improved fuel cell efficiency and cost reduction.
- Governmental Support: Subsidies, tax credits, and R&D funding.
- Demand for Silent Operation: Crucial for applications like yachting.
Conversely, the market faces significant barriers and challenges. The high initial cost of hydrogen fuel cell systems remains a primary restraint, hindering widespread adoption, particularly in cost-sensitive segments. The lack of widespread hydrogen refueling infrastructure, especially in remote areas and for mobile applications, poses a significant logistical hurdle. Supply chain complexities for critical components and the need for specialized maintenance expertise also contribute to these challenges.
- Key Barriers & Challenges:
- High Initial Cost: Compared to conventional generators.
- Limited Hydrogen Infrastructure: Availability of refueling stations.
- Supply Chain Issues: Sourcing of critical materials and components.
- Regulatory Uncertainty: Evolving standards and certifications.
- Public Perception & Awareness: Need for education on hydrogen safety and benefits.
Emerging Opportunities in On-board Hydrogen Fuel Cell Generator
Emerging opportunities in the On-board Hydrogen Fuel Cell Generator sector are abundant, driven by the increasing integration of hydrogen technology into various mobility and power solutions. The development of localized hydrogen production and refueling solutions for remote communities and specialized industrial sites presents a significant untapped market. Innovative applications in unmanned aerial vehicles (UAVs) and autonomous maritime vessels are creating new demand for lightweight and high-energy-density fuel cell systems. Evolving consumer preferences for sustainable and off-grid power solutions also present opportunities for smaller, modular fuel cell units in recreational vehicles and emergency backup power systems. Furthermore, strategic partnerships between fuel cell manufacturers and vehicle OEMs are paving the way for mass production and cost reduction, making these systems more accessible.
Growth Accelerators in the On-board Hydrogen Fuel Cell Generator Industry
Several growth accelerators are poised to propel the On-board Hydrogen Fuel Cell Generator industry forward. Technological breakthroughs in solid oxide fuel cells (SOFCs) and advanced proton-exchange membrane (PEM) fuel cells promise higher efficiency and greater durability, significantly reducing the total cost of ownership. Strategic partnerships between fuel cell developers, component suppliers, and end-user industries are crucial for de-risking investments and accelerating commercialization. For instance, collaborations in the maritime sector for retrofitting existing vessels with fuel cell systems are a prime example. Market expansion strategies focusing on specific, high-growth segments like zero-emission ferries and specialized industrial vehicles will further fuel demand. The development of robust hydrogen production and distribution networks is also a critical accelerator, ensuring the availability of the primary fuel source.
Key Players Shaping the On-board Hydrogen Fuel Cell Generator Market
- Toshiba
- H2X Global
- Toyota
- GenSure
- Denyo
- BOC HYMERA
- GAUSSIN
- H2SYS
- PowerUP Energy Technologies
- EODev
Notable Milestones in On-board Hydrogen Fuel Cell Generator Sector
- 2019: Launch of early-stage prototype fuel cell generators for niche maritime applications.
- 2020: Increased investment in R&D for solid-state hydrogen storage solutions, improving safety and density.
- 2021: First commercial deployment of >200kW fuel cell systems for ferry propulsion in Europe.
- 2022: Major automotive manufacturers announce strategic partnerships for hydrogen mobility solutions, including on-board generators.
- 2023: Significant advancements in PEM fuel cell stack technology, leading to reduced cost and increased power density.
- 2024: Establishment of pilot hydrogen refueling infrastructure for maritime vessels in key port cities.
- 2025 (Estimated): Anticipated growth in the adoption of <50kW fuel cell generators for auxiliary power on yachts and specialized vehicles.
- 2026-2030 (Forecast): Expected surge in the deployment of fuel cell powered shuttles and logistics vehicles, driven by urban emission regulations.
- 2031-2033 (Forecast): Maturation of the market, with increasing price parity with traditional generators and wider infrastructure support.
In-Depth On-board Hydrogen Fuel Cell Generator Market Outlook
The future market outlook for On-board Hydrogen Fuel Cell Generators is exceptionally promising, driven by a potent combination of technological innovation and an unwavering global commitment to sustainability. Growth accelerators such as breakthroughs in fuel cell efficiency, cost reduction through mass production, and the establishment of robust hydrogen infrastructure will be instrumental in unlocking the market's full potential. Strategic partnerships, particularly in the maritime and heavy-duty transport sectors, will foster rapid adoption and integration. The increasing demand for silent, zero-emission power in increasingly regulated environments like yachting and public transport ensures a sustained upward trajectory. Furthermore, the development of more compact and efficient fuel cell systems for a wider range of applications, including specialized industrial uses and recreational vehicles, will further diversify the market and create new revenue streams. The On-board Hydrogen Fuel Cell Generator market is not just poised for growth; it is set to redefine clean power generation for mobile and off-grid applications.
On-board Hydrogen Fuel Cell Generator Segmentation
-
1. Application
- 1.1. Yachting
- 1.2. Shuttles
- 1.3. Others
-
2. Types
- 2.1. <50kW
- 2.2. 50-100kW
- 2.3. 100-200kW
- 2.4. >200kW
On-board Hydrogen Fuel Cell Generator Segmentation By Geography
-
1. North America
- 1.1. United States
- 1.2. Canada
- 1.3. Mexico
-
2. South America
- 2.1. Brazil
- 2.2. Argentina
- 2.3. Rest of South America
-
3. Europe
- 3.1. United Kingdom
- 3.2. Germany
- 3.3. France
- 3.4. Italy
- 3.5. Spain
- 3.6. Russia
- 3.7. Benelux
- 3.8. Nordics
- 3.9. Rest of Europe
-
4. Middle East & Africa
- 4.1. Turkey
- 4.2. Israel
- 4.3. GCC
- 4.4. North Africa
- 4.5. South Africa
- 4.6. Rest of Middle East & Africa
-
5. Asia Pacific
- 5.1. China
- 5.2. India
- 5.3. Japan
- 5.4. South Korea
- 5.5. ASEAN
- 5.6. Oceania
- 5.7. Rest of Asia Pacific

On-board Hydrogen Fuel Cell Generator Regional Market Share
Geographic Coverage of On-board Hydrogen Fuel Cell Generator
On-board Hydrogen Fuel Cell Generator REPORT HIGHLIGHTS
| Aspects | Details |
|---|---|
| Study Period | 2020-2034 |
| Base Year | 2025 |
| Estimated Year | 2026 |
| Forecast Period | 2026-2034 |
| Historical Period | 2020-2025 |
| Growth Rate | CAGR of 25.9% from 2020-2034 |
| Segmentation |
|
Table of Contents
- 1. Introduction
- 1.1. Research Scope
- 1.2. Market Segmentation
- 1.3. Research Methodology
- 1.4. Definitions and Assumptions
- 2. Executive Summary
- 2.1. Introduction
- 3. Market Dynamics
- 3.1. Introduction
- 3.2. Market Drivers
- 3.3. Market Restrains
- 3.4. Market Trends
- 4. Market Factor Analysis
- 4.1. Porters Five Forces
- 4.2. Supply/Value Chain
- 4.3. PESTEL analysis
- 4.4. Market Entropy
- 4.5. Patent/Trademark Analysis
- 5. Global On-board Hydrogen Fuel Cell Generator Analysis, Insights and Forecast, 2020-2032
- 5.1. Market Analysis, Insights and Forecast - by Application
- 5.1.1. Yachting
- 5.1.2. Shuttles
- 5.1.3. Others
- 5.2. Market Analysis, Insights and Forecast - by Types
- 5.2.1. <50kW
- 5.2.2. 50-100kW
- 5.2.3. 100-200kW
- 5.2.4. >200kW
- 5.3. Market Analysis, Insights and Forecast - by Region
- 5.3.1. North America
- 5.3.2. South America
- 5.3.3. Europe
- 5.3.4. Middle East & Africa
- 5.3.5. Asia Pacific
- 5.1. Market Analysis, Insights and Forecast - by Application
- 6. North America On-board Hydrogen Fuel Cell Generator Analysis, Insights and Forecast, 2020-2032
- 6.1. Market Analysis, Insights and Forecast - by Application
- 6.1.1. Yachting
- 6.1.2. Shuttles
- 6.1.3. Others
- 6.2. Market Analysis, Insights and Forecast - by Types
- 6.2.1. <50kW
- 6.2.2. 50-100kW
- 6.2.3. 100-200kW
- 6.2.4. >200kW
- 6.1. Market Analysis, Insights and Forecast - by Application
- 7. South America On-board Hydrogen Fuel Cell Generator Analysis, Insights and Forecast, 2020-2032
- 7.1. Market Analysis, Insights and Forecast - by Application
- 7.1.1. Yachting
- 7.1.2. Shuttles
- 7.1.3. Others
- 7.2. Market Analysis, Insights and Forecast - by Types
- 7.2.1. <50kW
- 7.2.2. 50-100kW
- 7.2.3. 100-200kW
- 7.2.4. >200kW
- 7.1. Market Analysis, Insights and Forecast - by Application
- 8. Europe On-board Hydrogen Fuel Cell Generator Analysis, Insights and Forecast, 2020-2032
- 8.1. Market Analysis, Insights and Forecast - by Application
- 8.1.1. Yachting
- 8.1.2. Shuttles
- 8.1.3. Others
- 8.2. Market Analysis, Insights and Forecast - by Types
- 8.2.1. <50kW
- 8.2.2. 50-100kW
- 8.2.3. 100-200kW
- 8.2.4. >200kW
- 8.1. Market Analysis, Insights and Forecast - by Application
- 9. Middle East & Africa On-board Hydrogen Fuel Cell Generator Analysis, Insights and Forecast, 2020-2032
- 9.1. Market Analysis, Insights and Forecast - by Application
- 9.1.1. Yachting
- 9.1.2. Shuttles
- 9.1.3. Others
- 9.2. Market Analysis, Insights and Forecast - by Types
- 9.2.1. <50kW
- 9.2.2. 50-100kW
- 9.2.3. 100-200kW
- 9.2.4. >200kW
- 9.1. Market Analysis, Insights and Forecast - by Application
- 10. Asia Pacific On-board Hydrogen Fuel Cell Generator Analysis, Insights and Forecast, 2020-2032
- 10.1. Market Analysis, Insights and Forecast - by Application
- 10.1.1. Yachting
- 10.1.2. Shuttles
- 10.1.3. Others
- 10.2. Market Analysis, Insights and Forecast - by Types
- 10.2.1. <50kW
- 10.2.2. 50-100kW
- 10.2.3. 100-200kW
- 10.2.4. >200kW
- 10.1. Market Analysis, Insights and Forecast - by Application
- 11. Competitive Analysis
- 11.1. Global Market Share Analysis 2025
- 11.2. Company Profiles
- 11.2.1 Toshiba
- 11.2.1.1. Overview
- 11.2.1.2. Products
- 11.2.1.3. SWOT Analysis
- 11.2.1.4. Recent Developments
- 11.2.1.5. Financials (Based on Availability)
- 11.2.2 H2X Global
- 11.2.2.1. Overview
- 11.2.2.2. Products
- 11.2.2.3. SWOT Analysis
- 11.2.2.4. Recent Developments
- 11.2.2.5. Financials (Based on Availability)
- 11.2.3 Toyota
- 11.2.3.1. Overview
- 11.2.3.2. Products
- 11.2.3.3. SWOT Analysis
- 11.2.3.4. Recent Developments
- 11.2.3.5. Financials (Based on Availability)
- 11.2.4 GenSure
- 11.2.4.1. Overview
- 11.2.4.2. Products
- 11.2.4.3. SWOT Analysis
- 11.2.4.4. Recent Developments
- 11.2.4.5. Financials (Based on Availability)
- 11.2.5 Denyo
- 11.2.5.1. Overview
- 11.2.5.2. Products
- 11.2.5.3. SWOT Analysis
- 11.2.5.4. Recent Developments
- 11.2.5.5. Financials (Based on Availability)
- 11.2.6 BOC HYMERA
- 11.2.6.1. Overview
- 11.2.6.2. Products
- 11.2.6.3. SWOT Analysis
- 11.2.6.4. Recent Developments
- 11.2.6.5. Financials (Based on Availability)
- 11.2.7 GAUSSIN
- 11.2.7.1. Overview
- 11.2.7.2. Products
- 11.2.7.3. SWOT Analysis
- 11.2.7.4. Recent Developments
- 11.2.7.5. Financials (Based on Availability)
- 11.2.8 H2SYS
- 11.2.8.1. Overview
- 11.2.8.2. Products
- 11.2.8.3. SWOT Analysis
- 11.2.8.4. Recent Developments
- 11.2.8.5. Financials (Based on Availability)
- 11.2.9 PowerUP Energy Technologies
- 11.2.9.1. Overview
- 11.2.9.2. Products
- 11.2.9.3. SWOT Analysis
- 11.2.9.4. Recent Developments
- 11.2.9.5. Financials (Based on Availability)
- 11.2.10 EODev
- 11.2.10.1. Overview
- 11.2.10.2. Products
- 11.2.10.3. SWOT Analysis
- 11.2.10.4. Recent Developments
- 11.2.10.5. Financials (Based on Availability)
- 11.2.1 Toshiba
List of Figures
- Figure 1: Global On-board Hydrogen Fuel Cell Generator Revenue Breakdown (billion, %) by Region 2025 & 2033
- Figure 2: Global On-board Hydrogen Fuel Cell Generator Volume Breakdown (K, %) by Region 2025 & 2033
- Figure 3: North America On-board Hydrogen Fuel Cell Generator Revenue (billion), by Application 2025 & 2033
- Figure 4: North America On-board Hydrogen Fuel Cell Generator Volume (K), by Application 2025 & 2033
- Figure 5: North America On-board Hydrogen Fuel Cell Generator Revenue Share (%), by Application 2025 & 2033
- Figure 6: North America On-board Hydrogen Fuel Cell Generator Volume Share (%), by Application 2025 & 2033
- Figure 7: North America On-board Hydrogen Fuel Cell Generator Revenue (billion), by Types 2025 & 2033
- Figure 8: North America On-board Hydrogen Fuel Cell Generator Volume (K), by Types 2025 & 2033
- Figure 9: North America On-board Hydrogen Fuel Cell Generator Revenue Share (%), by Types 2025 & 2033
- Figure 10: North America On-board Hydrogen Fuel Cell Generator Volume Share (%), by Types 2025 & 2033
- Figure 11: North America On-board Hydrogen Fuel Cell Generator Revenue (billion), by Country 2025 & 2033
- Figure 12: North America On-board Hydrogen Fuel Cell Generator Volume (K), by Country 2025 & 2033
- Figure 13: North America On-board Hydrogen Fuel Cell Generator Revenue Share (%), by Country 2025 & 2033
- Figure 14: North America On-board Hydrogen Fuel Cell Generator Volume Share (%), by Country 2025 & 2033
- Figure 15: South America On-board Hydrogen Fuel Cell Generator Revenue (billion), by Application 2025 & 2033
- Figure 16: South America On-board Hydrogen Fuel Cell Generator Volume (K), by Application 2025 & 2033
- Figure 17: South America On-board Hydrogen Fuel Cell Generator Revenue Share (%), by Application 2025 & 2033
- Figure 18: South America On-board Hydrogen Fuel Cell Generator Volume Share (%), by Application 2025 & 2033
- Figure 19: South America On-board Hydrogen Fuel Cell Generator Revenue (billion), by Types 2025 & 2033
- Figure 20: South America On-board Hydrogen Fuel Cell Generator Volume (K), by Types 2025 & 2033
- Figure 21: South America On-board Hydrogen Fuel Cell Generator Revenue Share (%), by Types 2025 & 2033
- Figure 22: South America On-board Hydrogen Fuel Cell Generator Volume Share (%), by Types 2025 & 2033
- Figure 23: South America On-board Hydrogen Fuel Cell Generator Revenue (billion), by Country 2025 & 2033
- Figure 24: South America On-board Hydrogen Fuel Cell Generator Volume (K), by Country 2025 & 2033
- Figure 25: South America On-board Hydrogen Fuel Cell Generator Revenue Share (%), by Country 2025 & 2033
- Figure 26: South America On-board Hydrogen Fuel Cell Generator Volume Share (%), by Country 2025 & 2033
- Figure 27: Europe On-board Hydrogen Fuel Cell Generator Revenue (billion), by Application 2025 & 2033
- Figure 28: Europe On-board Hydrogen Fuel Cell Generator Volume (K), by Application 2025 & 2033
- Figure 29: Europe On-board Hydrogen Fuel Cell Generator Revenue Share (%), by Application 2025 & 2033
- Figure 30: Europe On-board Hydrogen Fuel Cell Generator Volume Share (%), by Application 2025 & 2033
- Figure 31: Europe On-board Hydrogen Fuel Cell Generator Revenue (billion), by Types 2025 & 2033
- Figure 32: Europe On-board Hydrogen Fuel Cell Generator Volume (K), by Types 2025 & 2033
- Figure 33: Europe On-board Hydrogen Fuel Cell Generator Revenue Share (%), by Types 2025 & 2033
- Figure 34: Europe On-board Hydrogen Fuel Cell Generator Volume Share (%), by Types 2025 & 2033
- Figure 35: Europe On-board Hydrogen Fuel Cell Generator Revenue (billion), by Country 2025 & 2033
- Figure 36: Europe On-board Hydrogen Fuel Cell Generator Volume (K), by Country 2025 & 2033
- Figure 37: Europe On-board Hydrogen Fuel Cell Generator Revenue Share (%), by Country 2025 & 2033
- Figure 38: Europe On-board Hydrogen Fuel Cell Generator Volume Share (%), by Country 2025 & 2033
- Figure 39: Middle East & Africa On-board Hydrogen Fuel Cell Generator Revenue (billion), by Application 2025 & 2033
- Figure 40: Middle East & Africa On-board Hydrogen Fuel Cell Generator Volume (K), by Application 2025 & 2033
- Figure 41: Middle East & Africa On-board Hydrogen Fuel Cell Generator Revenue Share (%), by Application 2025 & 2033
- Figure 42: Middle East & Africa On-board Hydrogen Fuel Cell Generator Volume Share (%), by Application 2025 & 2033
- Figure 43: Middle East & Africa On-board Hydrogen Fuel Cell Generator Revenue (billion), by Types 2025 & 2033
- Figure 44: Middle East & Africa On-board Hydrogen Fuel Cell Generator Volume (K), by Types 2025 & 2033
- Figure 45: Middle East & Africa On-board Hydrogen Fuel Cell Generator Revenue Share (%), by Types 2025 & 2033
- Figure 46: Middle East & Africa On-board Hydrogen Fuel Cell Generator Volume Share (%), by Types 2025 & 2033
- Figure 47: Middle East & Africa On-board Hydrogen Fuel Cell Generator Revenue (billion), by Country 2025 & 2033
- Figure 48: Middle East & Africa On-board Hydrogen Fuel Cell Generator Volume (K), by Country 2025 & 2033
- Figure 49: Middle East & Africa On-board Hydrogen Fuel Cell Generator Revenue Share (%), by Country 2025 & 2033
- Figure 50: Middle East & Africa On-board Hydrogen Fuel Cell Generator Volume Share (%), by Country 2025 & 2033
- Figure 51: Asia Pacific On-board Hydrogen Fuel Cell Generator Revenue (billion), by Application 2025 & 2033
- Figure 52: Asia Pacific On-board Hydrogen Fuel Cell Generator Volume (K), by Application 2025 & 2033
- Figure 53: Asia Pacific On-board Hydrogen Fuel Cell Generator Revenue Share (%), by Application 2025 & 2033
- Figure 54: Asia Pacific On-board Hydrogen Fuel Cell Generator Volume Share (%), by Application 2025 & 2033
- Figure 55: Asia Pacific On-board Hydrogen Fuel Cell Generator Revenue (billion), by Types 2025 & 2033
- Figure 56: Asia Pacific On-board Hydrogen Fuel Cell Generator Volume (K), by Types 2025 & 2033
- Figure 57: Asia Pacific On-board Hydrogen Fuel Cell Generator Revenue Share (%), by Types 2025 & 2033
- Figure 58: Asia Pacific On-board Hydrogen Fuel Cell Generator Volume Share (%), by Types 2025 & 2033
- Figure 59: Asia Pacific On-board Hydrogen Fuel Cell Generator Revenue (billion), by Country 2025 & 2033
- Figure 60: Asia Pacific On-board Hydrogen Fuel Cell Generator Volume (K), by Country 2025 & 2033
- Figure 61: Asia Pacific On-board Hydrogen Fuel Cell Generator Revenue Share (%), by Country 2025 & 2033
- Figure 62: Asia Pacific On-board Hydrogen Fuel Cell Generator Volume Share (%), by Country 2025 & 2033
List of Tables
- Table 1: Global On-board Hydrogen Fuel Cell Generator Revenue billion Forecast, by Application 2020 & 2033
- Table 2: Global On-board Hydrogen Fuel Cell Generator Volume K Forecast, by Application 2020 & 2033
- Table 3: Global On-board Hydrogen Fuel Cell Generator Revenue billion Forecast, by Types 2020 & 2033
- Table 4: Global On-board Hydrogen Fuel Cell Generator Volume K Forecast, by Types 2020 & 2033
- Table 5: Global On-board Hydrogen Fuel Cell Generator Revenue billion Forecast, by Region 2020 & 2033
- Table 6: Global On-board Hydrogen Fuel Cell Generator Volume K Forecast, by Region 2020 & 2033
- Table 7: Global On-board Hydrogen Fuel Cell Generator Revenue billion Forecast, by Application 2020 & 2033
- Table 8: Global On-board Hydrogen Fuel Cell Generator Volume K Forecast, by Application 2020 & 2033
- Table 9: Global On-board Hydrogen Fuel Cell Generator Revenue billion Forecast, by Types 2020 & 2033
- Table 10: Global On-board Hydrogen Fuel Cell Generator Volume K Forecast, by Types 2020 & 2033
- Table 11: Global On-board Hydrogen Fuel Cell Generator Revenue billion Forecast, by Country 2020 & 2033
- Table 12: Global On-board Hydrogen Fuel Cell Generator Volume K Forecast, by Country 2020 & 2033
- Table 13: United States On-board Hydrogen Fuel Cell Generator Revenue (billion) Forecast, by Application 2020 & 2033
- Table 14: United States On-board Hydrogen Fuel Cell Generator Volume (K) Forecast, by Application 2020 & 2033
- Table 15: Canada On-board Hydrogen Fuel Cell Generator Revenue (billion) Forecast, by Application 2020 & 2033
- Table 16: Canada On-board Hydrogen Fuel Cell Generator Volume (K) Forecast, by Application 2020 & 2033
- Table 17: Mexico On-board Hydrogen Fuel Cell Generator Revenue (billion) Forecast, by Application 2020 & 2033
- Table 18: Mexico On-board Hydrogen Fuel Cell Generator Volume (K) Forecast, by Application 2020 & 2033
- Table 19: Global On-board Hydrogen Fuel Cell Generator Revenue billion Forecast, by Application 2020 & 2033
- Table 20: Global On-board Hydrogen Fuel Cell Generator Volume K Forecast, by Application 2020 & 2033
- Table 21: Global On-board Hydrogen Fuel Cell Generator Revenue billion Forecast, by Types 2020 & 2033
- Table 22: Global On-board Hydrogen Fuel Cell Generator Volume K Forecast, by Types 2020 & 2033
- Table 23: Global On-board Hydrogen Fuel Cell Generator Revenue billion Forecast, by Country 2020 & 2033
- Table 24: Global On-board Hydrogen Fuel Cell Generator Volume K Forecast, by Country 2020 & 2033
- Table 25: Brazil On-board Hydrogen Fuel Cell Generator Revenue (billion) Forecast, by Application 2020 & 2033
- Table 26: Brazil On-board Hydrogen Fuel Cell Generator Volume (K) Forecast, by Application 2020 & 2033
- Table 27: Argentina On-board Hydrogen Fuel Cell Generator Revenue (billion) Forecast, by Application 2020 & 2033
- Table 28: Argentina On-board Hydrogen Fuel Cell Generator Volume (K) Forecast, by Application 2020 & 2033
- Table 29: Rest of South America On-board Hydrogen Fuel Cell Generator Revenue (billion) Forecast, by Application 2020 & 2033
- Table 30: Rest of South America On-board Hydrogen Fuel Cell Generator Volume (K) Forecast, by Application 2020 & 2033
- Table 31: Global On-board Hydrogen Fuel Cell Generator Revenue billion Forecast, by Application 2020 & 2033
- Table 32: Global On-board Hydrogen Fuel Cell Generator Volume K Forecast, by Application 2020 & 2033
- Table 33: Global On-board Hydrogen Fuel Cell Generator Revenue billion Forecast, by Types 2020 & 2033
- Table 34: Global On-board Hydrogen Fuel Cell Generator Volume K Forecast, by Types 2020 & 2033
- Table 35: Global On-board Hydrogen Fuel Cell Generator Revenue billion Forecast, by Country 2020 & 2033
- Table 36: Global On-board Hydrogen Fuel Cell Generator Volume K Forecast, by Country 2020 & 2033
- Table 37: United Kingdom On-board Hydrogen Fuel Cell Generator Revenue (billion) Forecast, by Application 2020 & 2033
- Table 38: United Kingdom On-board Hydrogen Fuel Cell Generator Volume (K) Forecast, by Application 2020 & 2033
- Table 39: Germany On-board Hydrogen Fuel Cell Generator Revenue (billion) Forecast, by Application 2020 & 2033
- Table 40: Germany On-board Hydrogen Fuel Cell Generator Volume (K) Forecast, by Application 2020 & 2033
- Table 41: France On-board Hydrogen Fuel Cell Generator Revenue (billion) Forecast, by Application 2020 & 2033
- Table 42: France On-board Hydrogen Fuel Cell Generator Volume (K) Forecast, by Application 2020 & 2033
- Table 43: Italy On-board Hydrogen Fuel Cell Generator Revenue (billion) Forecast, by Application 2020 & 2033
- Table 44: Italy On-board Hydrogen Fuel Cell Generator Volume (K) Forecast, by Application 2020 & 2033
- Table 45: Spain On-board Hydrogen Fuel Cell Generator Revenue (billion) Forecast, by Application 2020 & 2033
- Table 46: Spain On-board Hydrogen Fuel Cell Generator Volume (K) Forecast, by Application 2020 & 2033
- Table 47: Russia On-board Hydrogen Fuel Cell Generator Revenue (billion) Forecast, by Application 2020 & 2033
- Table 48: Russia On-board Hydrogen Fuel Cell Generator Volume (K) Forecast, by Application 2020 & 2033
- Table 49: Benelux On-board Hydrogen Fuel Cell Generator Revenue (billion) Forecast, by Application 2020 & 2033
- Table 50: Benelux On-board Hydrogen Fuel Cell Generator Volume (K) Forecast, by Application 2020 & 2033
- Table 51: Nordics On-board Hydrogen Fuel Cell Generator Revenue (billion) Forecast, by Application 2020 & 2033
- Table 52: Nordics On-board Hydrogen Fuel Cell Generator Volume (K) Forecast, by Application 2020 & 2033
- Table 53: Rest of Europe On-board Hydrogen Fuel Cell Generator Revenue (billion) Forecast, by Application 2020 & 2033
- Table 54: Rest of Europe On-board Hydrogen Fuel Cell Generator Volume (K) Forecast, by Application 2020 & 2033
- Table 55: Global On-board Hydrogen Fuel Cell Generator Revenue billion Forecast, by Application 2020 & 2033
- Table 56: Global On-board Hydrogen Fuel Cell Generator Volume K Forecast, by Application 2020 & 2033
- Table 57: Global On-board Hydrogen Fuel Cell Generator Revenue billion Forecast, by Types 2020 & 2033
- Table 58: Global On-board Hydrogen Fuel Cell Generator Volume K Forecast, by Types 2020 & 2033
- Table 59: Global On-board Hydrogen Fuel Cell Generator Revenue billion Forecast, by Country 2020 & 2033
- Table 60: Global On-board Hydrogen Fuel Cell Generator Volume K Forecast, by Country 2020 & 2033
- Table 61: Turkey On-board Hydrogen Fuel Cell Generator Revenue (billion) Forecast, by Application 2020 & 2033
- Table 62: Turkey On-board Hydrogen Fuel Cell Generator Volume (K) Forecast, by Application 2020 & 2033
- Table 63: Israel On-board Hydrogen Fuel Cell Generator Revenue (billion) Forecast, by Application 2020 & 2033
- Table 64: Israel On-board Hydrogen Fuel Cell Generator Volume (K) Forecast, by Application 2020 & 2033
- Table 65: GCC On-board Hydrogen Fuel Cell Generator Revenue (billion) Forecast, by Application 2020 & 2033
- Table 66: GCC On-board Hydrogen Fuel Cell Generator Volume (K) Forecast, by Application 2020 & 2033
- Table 67: North Africa On-board Hydrogen Fuel Cell Generator Revenue (billion) Forecast, by Application 2020 & 2033
- Table 68: North Africa On-board Hydrogen Fuel Cell Generator Volume (K) Forecast, by Application 2020 & 2033
- Table 69: South Africa On-board Hydrogen Fuel Cell Generator Revenue (billion) Forecast, by Application 2020 & 2033
- Table 70: South Africa On-board Hydrogen Fuel Cell Generator Volume (K) Forecast, by Application 2020 & 2033
- Table 71: Rest of Middle East & Africa On-board Hydrogen Fuel Cell Generator Revenue (billion) Forecast, by Application 2020 & 2033
- Table 72: Rest of Middle East & Africa On-board Hydrogen Fuel Cell Generator Volume (K) Forecast, by Application 2020 & 2033
- Table 73: Global On-board Hydrogen Fuel Cell Generator Revenue billion Forecast, by Application 2020 & 2033
- Table 74: Global On-board Hydrogen Fuel Cell Generator Volume K Forecast, by Application 2020 & 2033
- Table 75: Global On-board Hydrogen Fuel Cell Generator Revenue billion Forecast, by Types 2020 & 2033
- Table 76: Global On-board Hydrogen Fuel Cell Generator Volume K Forecast, by Types 2020 & 2033
- Table 77: Global On-board Hydrogen Fuel Cell Generator Revenue billion Forecast, by Country 2020 & 2033
- Table 78: Global On-board Hydrogen Fuel Cell Generator Volume K Forecast, by Country 2020 & 2033
- Table 79: China On-board Hydrogen Fuel Cell Generator Revenue (billion) Forecast, by Application 2020 & 2033
- Table 80: China On-board Hydrogen Fuel Cell Generator Volume (K) Forecast, by Application 2020 & 2033
- Table 81: India On-board Hydrogen Fuel Cell Generator Revenue (billion) Forecast, by Application 2020 & 2033
- Table 82: India On-board Hydrogen Fuel Cell Generator Volume (K) Forecast, by Application 2020 & 2033
- Table 83: Japan On-board Hydrogen Fuel Cell Generator Revenue (billion) Forecast, by Application 2020 & 2033
- Table 84: Japan On-board Hydrogen Fuel Cell Generator Volume (K) Forecast, by Application 2020 & 2033
- Table 85: South Korea On-board Hydrogen Fuel Cell Generator Revenue (billion) Forecast, by Application 2020 & 2033
- Table 86: South Korea On-board Hydrogen Fuel Cell Generator Volume (K) Forecast, by Application 2020 & 2033
- Table 87: ASEAN On-board Hydrogen Fuel Cell Generator Revenue (billion) Forecast, by Application 2020 & 2033
- Table 88: ASEAN On-board Hydrogen Fuel Cell Generator Volume (K) Forecast, by Application 2020 & 2033
- Table 89: Oceania On-board Hydrogen Fuel Cell Generator Revenue (billion) Forecast, by Application 2020 & 2033
- Table 90: Oceania On-board Hydrogen Fuel Cell Generator Volume (K) Forecast, by Application 2020 & 2033
- Table 91: Rest of Asia Pacific On-board Hydrogen Fuel Cell Generator Revenue (billion) Forecast, by Application 2020 & 2033
- Table 92: Rest of Asia Pacific On-board Hydrogen Fuel Cell Generator Volume (K) Forecast, by Application 2020 & 2033
Frequently Asked Questions
1. What is the projected Compound Annual Growth Rate (CAGR) of the On-board Hydrogen Fuel Cell Generator?
The projected CAGR is approximately 25.9%.
2. Which companies are prominent players in the On-board Hydrogen Fuel Cell Generator?
Key companies in the market include Toshiba, H2X Global, Toyota, GenSure, Denyo, BOC HYMERA, GAUSSIN, H2SYS, PowerUP Energy Technologies, EODev.
3. What are the main segments of the On-board Hydrogen Fuel Cell Generator?
The market segments include Application, Types.
4. Can you provide details about the market size?
The market size is estimated to be USD 10.64 billion as of 2022.
5. What are some drivers contributing to market growth?
N/A
6. What are the notable trends driving market growth?
N/A
7. Are there any restraints impacting market growth?
N/A
8. Can you provide examples of recent developments in the market?
N/A
9. What pricing options are available for accessing the report?
Pricing options include single-user, multi-user, and enterprise licenses priced at USD 3350.00, USD 5025.00, and USD 6700.00 respectively.
10. Is the market size provided in terms of value or volume?
The market size is provided in terms of value, measured in billion and volume, measured in K.
11. Are there any specific market keywords associated with the report?
Yes, the market keyword associated with the report is "On-board Hydrogen Fuel Cell Generator," which aids in identifying and referencing the specific market segment covered.
12. How do I determine which pricing option suits my needs best?
The pricing options vary based on user requirements and access needs. Individual users may opt for single-user licenses, while businesses requiring broader access may choose multi-user or enterprise licenses for cost-effective access to the report.
13. Are there any additional resources or data provided in the On-board Hydrogen Fuel Cell Generator report?
While the report offers comprehensive insights, it's advisable to review the specific contents or supplementary materials provided to ascertain if additional resources or data are available.
14. How can I stay updated on further developments or reports in the On-board Hydrogen Fuel Cell Generator?
To stay informed about further developments, trends, and reports in the On-board Hydrogen Fuel Cell Generator, consider subscribing to industry newsletters, following relevant companies and organizations, or regularly checking reputable industry news sources and publications.
Methodology
Step 1 - Identification of Relevant Samples Size from Population Database


Step 2 - Approaches for Defining Global Market Size (Value, Volume* & Price*)

Note*: In applicable scenarios
Step 3 - Data Sources
Primary Research
- Web Analytics
- Survey Reports
- Research Institute
- Latest Research Reports
- Opinion Leaders
Secondary Research
- Annual Reports
- White Paper
- Latest Press Release
- Industry Association
- Paid Database
- Investor Presentations

Step 4 - Data Triangulation
Involves using different sources of information in order to increase the validity of a study
These sources are likely to be stakeholders in a program - participants, other researchers, program staff, other community members, and so on.
Then we put all data in single framework & apply various statistical tools to find out the dynamic on the market.
During the analysis stage, feedback from the stakeholder groups would be compared to determine areas of agreement as well as areas of divergence