

Key Insights
The on-board connectivity market is experiencing robust growth, driven by the increasing demand for seamless communication and entertainment options across various transportation modes. A CAGR of 13.80% from 2019-2033 signifies a significant expansion, particularly within the transportation and railway sectors. The market's segmentation reveals a strong emphasis on both solution and service offerings, catering to diverse needs ranging from basic communication to advanced monitoring and entertainment systems. Key players like Nokia, AT&T, Honeywell, and Inmarsat are actively shaping the market landscape, leveraging their expertise in network infrastructure and satellite technology. The substantial investments in infrastructure improvements across North America, Europe, and the Asia-Pacific region are fueling market expansion. Specifically, the increasing adoption of smart technologies within transportation networks, including autonomous vehicles and advanced train control systems, is driving the need for high-bandwidth, reliable connectivity solutions. The market is also witnessing a rise in demand for enhanced security features and data analytics capabilities within on-board systems.
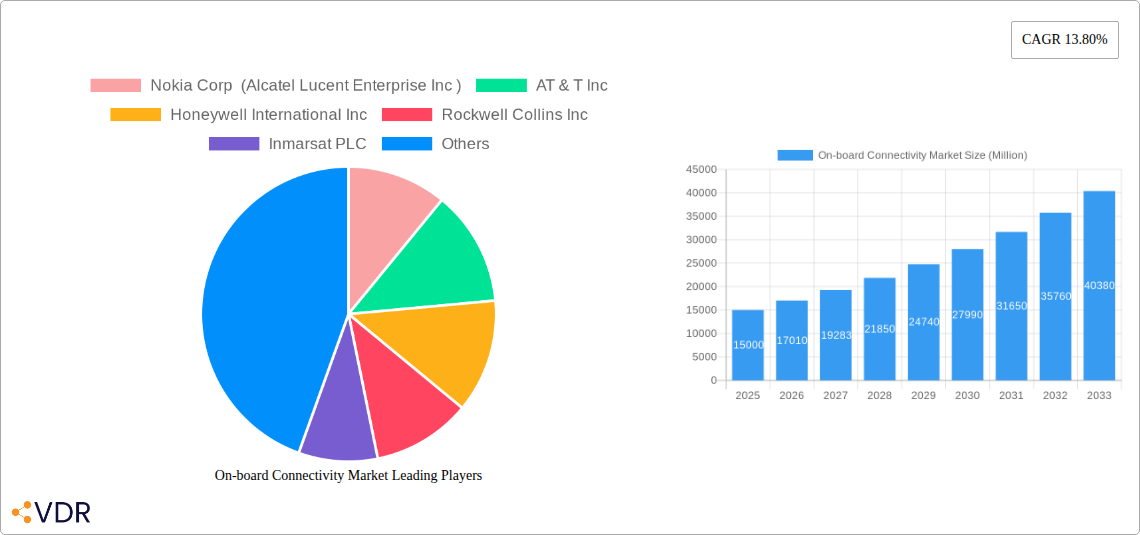
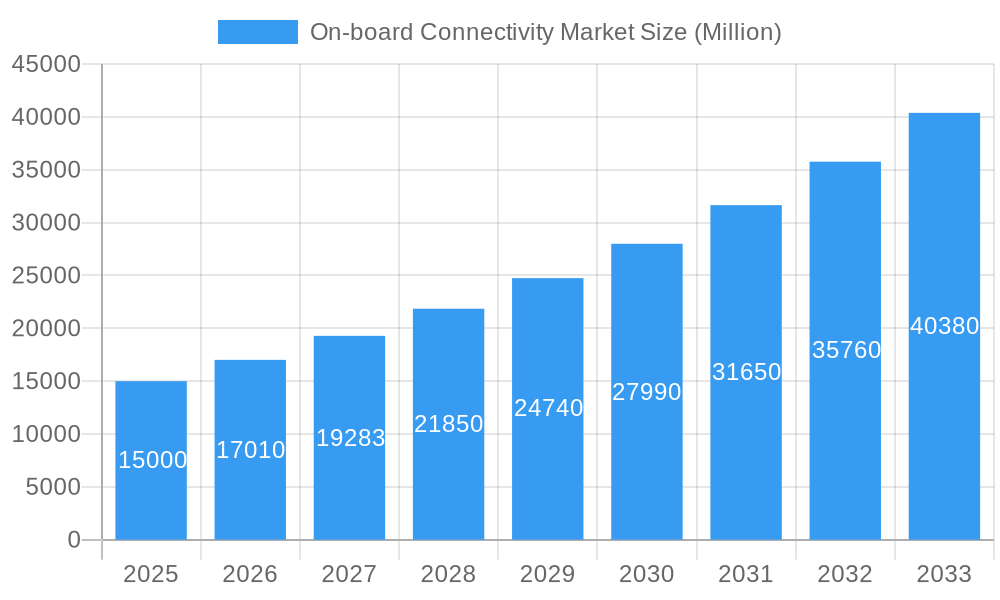
On-board Connectivity Market Market Size (In Billion)
Growth is further propelled by the rising passenger expectations for in-flight Wi-Fi and entertainment options, pushing airlines and railway companies to invest heavily in improving their on-board connectivity offerings. The competitive landscape features established telecommunication giants alongside specialized technology providers, leading to continuous innovation and the development of more advanced and cost-effective solutions. While challenges exist, such as regulatory hurdles and the need for reliable infrastructure in remote areas, the overall market outlook remains positive, indicating continued expansion and diversification in the coming years. The market size in 2025 is estimated at $15 billion based on the provided CAGR and growth trends. Future growth will be influenced by factors such as the proliferation of 5G technology, the adoption of IoT devices, and the continued growth of the global travel and transportation sectors.
On-board Connectivity Market Company Market Share
On-board Connectivity Market: A Comprehensive Report (2019-2033)
This comprehensive report provides an in-depth analysis of the On-board Connectivity Market, encompassing its parent market (Telecommunications/Aerospace depending on the focus) and child markets (Railway, Transportation, etc.). The study period spans 2019-2033, with 2025 as the base and estimated year, and a forecast period of 2025-2033. The market is segmented by Type (Solution, Service) and End-user Industry (Transportation, Railway – Entertainment, Monitoring, Communication). The report reveals significant growth opportunities driven by technological advancements and increasing demand for seamless connectivity across various transportation modes. The market is valued at xx Million units in 2025 and is projected to reach xx Million units by 2033, exhibiting a CAGR of xx%.
On-board Connectivity Market Dynamics & Structure
This section analyzes the market's competitive landscape, identifying key players and their market share. We delve into technological advancements driving innovation, regulatory frameworks influencing market growth, and the impact of competitive product substitutes. The analysis incorporates M&A activities and their effect on market consolidation. End-user demographics and their evolving connectivity needs are also considered.
- Market Concentration: The On-board Connectivity market is moderately concentrated, with key players holding significant market share. The top 5 players account for approximately xx% of the market in 2025.
- Technological Innovation Drivers: 5G deployment, satellite communication advancements, and IoT integration are primary drivers. Barriers include high implementation costs and standardization challenges.
- Regulatory Frameworks: Government regulations concerning data privacy, security, and spectrum allocation significantly impact market dynamics.
- Competitive Product Substitutes: Alternatives like terrestrial networks and local area networks compete for market share, depending on the specific application and location.
- End-User Demographics: The increasing adoption of connected devices by passengers and operators fuels market growth.
- M&A Trends: The number of M&A deals in the sector has increased in recent years, reflecting consolidation and expansion strategies. Approximately xx M&A deals were recorded between 2019 and 2024.
On-board Connectivity Market Growth Trends & Insights
This section details the market's historical growth trajectory and future projections. It examines adoption rates across various end-user industries, analyzing factors influencing market penetration. Technological disruptions and their impact on market evolution are meticulously investigated, alongside changes in consumer behavior and preferences related to on-board connectivity.
[Analysis of market size evolution (historical and projected), adoption rates, technological disruptions, and consumer behavior shifts will be included here. This will include specific metrics like CAGR and market penetration rates, supported by charts and graphs.]
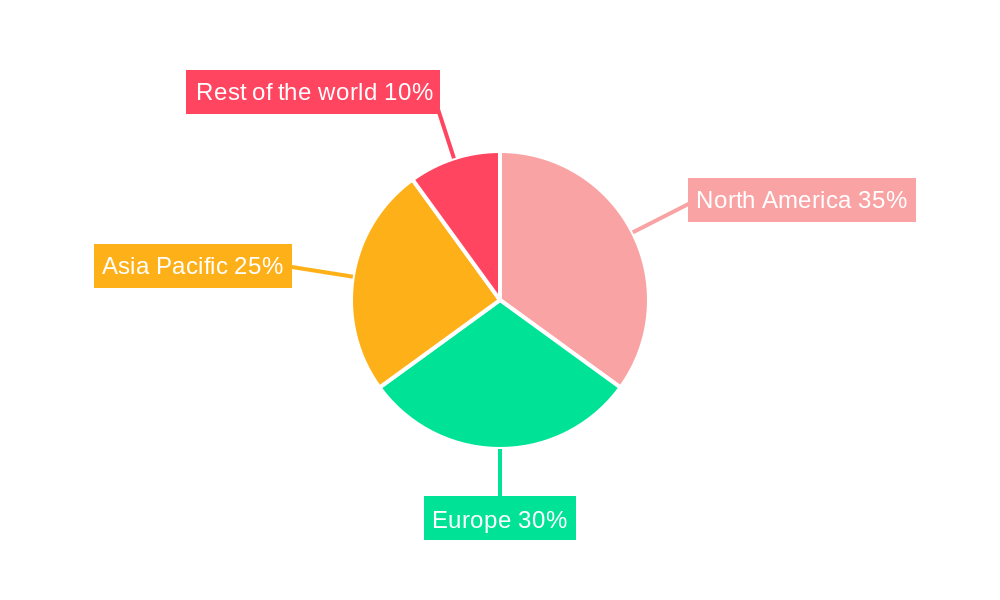
Dominant Regions, Countries, or Segments in On-board Connectivity Market
This section meticulously identifies the leading regions, countries, and market segments that are currently propelling the growth of the On-board Connectivity market. Our analysis delves into the critical factors that underpin this dominance, including supportive economic policies, robust infrastructure development initiatives, and evolving regulatory landscapes. We provide a focused examination of market share and the inherent growth potential within each of these dominant segments.
- Leading Region: North America is projected to retain its position as the largest market by share in 2025, followed closely by Europe and the dynamic Asia Pacific region.
- Leading Country: The United States is anticipated to spearhead growth, largely due to substantial investments in advanced infrastructure and its proactive adoption of cutting-edge technologies.
- Dominant Segments: The Transportation sector, with particular emphasis on aviation and maritime applications, alongside the Services segment, especially managed services and sophisticated network solutions, are expected to witness substantial expansion. This surge is fueled by the escalating demand for high-speed, reliable connectivity and proficient network management.
- Key Drivers of Dominance: Government initiatives championing the development of digital infrastructure, increasing disposable incomes empowering consumers, and the ever-growing passenger demand for immersive connected services are the pivotal forces driving market growth and regional dominance.
[Further detailed analysis of each segment and region, including specific market share data and growth forecasts, will be included here.]
On-board Connectivity Market Product Landscape
This section describes the technological advancements and innovative features within the On-board Connectivity market. It analyzes product applications and their corresponding performance metrics, focusing on unique selling propositions and technological innovations that differentiate offerings. New technologies like satellite-based broadband and 5G are revolutionizing the market landscape.
Key Drivers, Barriers & Challenges in On-board Connectivity Market
This section offers a comprehensive overview of the primary catalysts propelling market expansion and the significant obstacles that currently impede its unfettered growth.
Key Drivers:
- Technological Advancements: The rapid evolution and deployment of technologies like 5G and advanced satellite internet are fundamentally reshaping the possibilities of on-board connectivity.
- Growing Demand for In-Transit Connectivity: An increasing expectation for uninterrupted, high-speed internet access while traveling across all modes of transport is a major market impetus.
- Ubiquitous Adoption of Connected Devices: The proliferation of personal and professional connected devices necessitates robust connectivity solutions even when on the move.
- Supportive Regulatory Frameworks: Favorable government regulations and policies are actively encouraging investment and deployment of on-board connectivity infrastructure.
Key Barriers & Challenges:
- Substantial Initial Investment: The significant upfront capital required for the development and deployment of on-board connectivity infrastructure presents a notable barrier.
- Security and Data Privacy Concerns: Ensuring the robust security of data transmitted and received on-board, alongside safeguarding user privacy, remains a critical challenge.
- Spectrum Allocation Limitations: The availability and allocation of suitable radio spectrum can pose constraints on network capacity and performance.
- Competitive Landscape: Competition from established terrestrial networks, where available, can influence the adoption and pricing of on-board solutions.
- Interoperability Issues: Achieving seamless interoperability across diverse systems, hardware, and service providers within the on-board ecosystem is a persistent challenge.
[Quantifiable impacts of these challenges on market growth and strategies to overcome them will be elaborated here.]
Emerging Opportunities in On-board Connectivity Market
This section actively explores the nascent and future prospects within the On-board Connectivity market. It specifically highlights untapped market potential, innovative application development, and the evolving landscape of consumer preferences, identifying key areas for future investment and strategic focus.
- Expansion into Developing Economies: Significant opportunities lie in extending sophisticated on-board connectivity solutions to emerging markets with growing travel infrastructure and consumer demand.
- Synergistic Integration with Advanced Technologies: The convergence of on-board connectivity with Artificial Intelligence (AI), the Internet of Things (IoT), and other emerging technologies promises to unlock new functionalities and value propositions.
- Development of Novel Services and Applications: The creation of new, value-added services and applications, such as enhanced in-flight entertainment, real-time data analytics for transportation management, and personalized passenger experiences, presents a fertile ground for growth.
- Enhanced Focus on Cybersecurity and Data Protection: As connectivity becomes more pervasive, the demand for advanced cybersecurity solutions and robust data privacy measures will escalate, creating dedicated market opportunities.
Growth Accelerators in the On-board Connectivity Market Industry
This section identifies and elaborates on the key accelerators poised to drive the long-term growth trajectory of the On-board Connectivity market. These include groundbreaking technological breakthroughs, the formation of strategic partnerships, and the successful expansion into new and underserved geographical markets. Specific, actionable examples will be provided to illustrate these growth drivers.
Key Players Shaping the On-board Connectivity Market Market
- Nokia Corp (Alcatel Lucent Enterprise Inc )
- AT & T Inc
- Honeywell International Inc
- Rockwell Collins Inc
- Inmarsat PLC
- Huawei Technologies Co Ltd
- ZTE Corporation
- Viasat Inc
- Bombardier Aerospace Inc
- Panasonic Corporation
Notable Milestones in On-board Connectivity Market Sector
[This section will list notable developments (e.g., product launches, mergers, and significant partnerships) with their respective dates and a brief description of their impact on the market.]
In-Depth On-board Connectivity Market Market Outlook
The on-board connectivity market exhibits significant potential for future growth, driven by continuous technological advancements and increasing demand for seamless connectivity across various transportation modes. Strategic partnerships and expansion into new markets present lucrative opportunities for players. The market is poised for substantial expansion, offering promising prospects for both established and emerging companies in the coming years.
On-board Connectivity Market Segmentation
- 1. Production Analysis
- 2. Consumption Analysis
- 3. Import Market Analysis (Value & Volume)
- 4. Export Market Analysis (Value & Volume)
- 5. Price Trend Analysis
On-board Connectivity Market Segmentation By Geography
-
1. North America
- 1.1. United States
- 1.2. Canada
- 1.3. Mexico
-
2. South America
- 2.1. Brazil
- 2.2. Argentina
- 2.3. Rest of South America
-
3. Europe
- 3.1. United Kingdom
- 3.2. Germany
- 3.3. France
- 3.4. Italy
- 3.5. Spain
- 3.6. Russia
- 3.7. Benelux
- 3.8. Nordics
- 3.9. Rest of Europe
-
4. Middle East & Africa
- 4.1. Turkey
- 4.2. Israel
- 4.3. GCC
- 4.4. North Africa
- 4.5. South Africa
- 4.6. Rest of Middle East & Africa
-
5. Asia Pacific
- 5.1. China
- 5.2. India
- 5.3. Japan
- 5.4. South Korea
- 5.5. ASEAN
- 5.6. Oceania
- 5.7. Rest of Asia Pacific
On-board Connectivity Market Regional Market Share
Geographic Coverage of On-board Connectivity Market
On-board Connectivity Market REPORT HIGHLIGHTS
| Aspects | Details |
|---|---|
| Study Period | 2020-2034 |
| Base Year | 2025 |
| Estimated Year | 2026 |
| Forecast Period | 2026-2034 |
| Historical Period | 2020-2025 |
| Growth Rate | CAGR of 13.5% from 2020-2034 |
| Segmentation |
|
Table of Contents
- 1. Introduction
- 1.1. Research Scope
- 1.2. Market Segmentation
- 1.3. Research Objective
- 1.4. Definitions and Assumptions
- 2. Executive Summary
- 2.1. Market Snapshot
- 3. Market Dynamics
- 3.1. Market Drivers
- 3.2. Market Restrains
- 3.3. Market Trends
- 3.4. Market Opportunities
- 4. Market Factor Analysis
- 4.1. Porters Five Forces
- 4.1.1. Bargaining Power of Suppliers
- 4.1.2. Bargaining Power of Buyers
- 4.1.3. Threat of New Entrants
- 4.1.4. Threat of Substitutes
- 4.1.5. Competitive Rivalry
- 4.2. PESTEL analysis
- 4.3. BCG Analysis
- 4.3.1. Stars (High Growth, High Market Share)
- 4.3.2. Cash Cows (Low Growth, High Market Share)
- 4.3.3. Question Mark (High Growth, Low Market Share)
- 4.3.4. Dogs (Low Growth, Low Market Share)
- 4.4. Ansoff Matrix Analysis
- 4.5. Supply Chain Analysis
- 4.6. Regulatory Landscape
- 4.7. Current Market Potential and Opportunity Assessment (TAM–SAM–SOM Framework)
- 4.8. VDR Analyst Note
- 4.1. Porters Five Forces
- 5. Market Analysis, Insights and Forecast 2021-2033
- 5.1. Market Analysis, Insights and Forecast - by Production Analysis
- 5.2. Market Analysis, Insights and Forecast - by Consumption Analysis
- 5.3. Market Analysis, Insights and Forecast - by Import Market Analysis (Value & Volume)
- 5.4. Market Analysis, Insights and Forecast - by Export Market Analysis (Value & Volume)
- 5.5. Market Analysis, Insights and Forecast - by Price Trend Analysis
- 5.6. Market Analysis, Insights and Forecast - by Region
- 5.6.1. North America
- 5.6.2. South America
- 5.6.3. Europe
- 5.6.4. Middle East & Africa
- 5.6.5. Asia Pacific
- 6. Global On-board Connectivity Market Analysis, Insights and Forecast, 2021-2033
- 6.1. Market Analysis, Insights and Forecast - by Production Analysis
- 6.2. Market Analysis, Insights and Forecast - by Consumption Analysis
- 6.3. Market Analysis, Insights and Forecast - by Import Market Analysis (Value & Volume)
- 6.4. Market Analysis, Insights and Forecast - by Export Market Analysis (Value & Volume)
- 6.5. Market Analysis, Insights and Forecast - by Price Trend Analysis
- 7. North America On-board Connectivity Market Analysis, Insights and Forecast, 2021-2033
- 7.1. Market Analysis, Insights and Forecast - by Production Analysis
- 7.2. Market Analysis, Insights and Forecast - by Consumption Analysis
- 7.3. Market Analysis, Insights and Forecast - by Import Market Analysis (Value & Volume)
- 7.4. Market Analysis, Insights and Forecast - by Export Market Analysis (Value & Volume)
- 7.5. Market Analysis, Insights and Forecast - by Price Trend Analysis
- 8. South America On-board Connectivity Market Analysis, Insights and Forecast, 2021-2033
- 8.1. Market Analysis, Insights and Forecast - by Production Analysis
- 8.2. Market Analysis, Insights and Forecast - by Consumption Analysis
- 8.3. Market Analysis, Insights and Forecast - by Import Market Analysis (Value & Volume)
- 8.4. Market Analysis, Insights and Forecast - by Export Market Analysis (Value & Volume)
- 8.5. Market Analysis, Insights and Forecast - by Price Trend Analysis
- 9. Europe On-board Connectivity Market Analysis, Insights and Forecast, 2021-2033
- 9.1. Market Analysis, Insights and Forecast - by Production Analysis
- 9.2. Market Analysis, Insights and Forecast - by Consumption Analysis
- 9.3. Market Analysis, Insights and Forecast - by Import Market Analysis (Value & Volume)
- 9.4. Market Analysis, Insights and Forecast - by Export Market Analysis (Value & Volume)
- 9.5. Market Analysis, Insights and Forecast - by Price Trend Analysis
- 10. Middle East & Africa On-board Connectivity Market Analysis, Insights and Forecast, 2021-2033
- 10.1. Market Analysis, Insights and Forecast - by Production Analysis
- 10.2. Market Analysis, Insights and Forecast - by Consumption Analysis
- 10.3. Market Analysis, Insights and Forecast - by Import Market Analysis (Value & Volume)
- 10.4. Market Analysis, Insights and Forecast - by Export Market Analysis (Value & Volume)
- 10.5. Market Analysis, Insights and Forecast - by Price Trend Analysis
- 11. Asia Pacific On-board Connectivity Market Analysis, Insights and Forecast, 2021-2033
- 11.1. Market Analysis, Insights and Forecast - by Production Analysis
- 11.2. Market Analysis, Insights and Forecast - by Consumption Analysis
- 11.3. Market Analysis, Insights and Forecast - by Import Market Analysis (Value & Volume)
- 11.4. Market Analysis, Insights and Forecast - by Export Market Analysis (Value & Volume)
- 11.5. Market Analysis, Insights and Forecast - by Price Trend Analysis
- 12. Competitive Analysis
- 12.1. Company Profiles
- 12.1.1 Nokia Corp (Alcatel Lucent Enterprise Inc )
- 12.1.1.1. Company Overview
- 12.1.1.2. Products
- 12.1.1.3. Company Financials
- 12.1.1.4. SWOT Analysis
- 12.1.2 AT & T Inc
- 12.1.2.1. Company Overview
- 12.1.2.2. Products
- 12.1.2.3. Company Financials
- 12.1.2.4. SWOT Analysis
- 12.1.3 Honeywell International Inc
- 12.1.3.1. Company Overview
- 12.1.3.2. Products
- 12.1.3.3. Company Financials
- 12.1.3.4. SWOT Analysis
- 12.1.4 Rockwell Collins Inc
- 12.1.4.1. Company Overview
- 12.1.4.2. Products
- 12.1.4.3. Company Financials
- 12.1.4.4. SWOT Analysis
- 12.1.5 Inmarsat PLC
- 12.1.5.1. Company Overview
- 12.1.5.2. Products
- 12.1.5.3. Company Financials
- 12.1.5.4. SWOT Analysis
- 12.1.6 Huawei Technologies Co Ltd
- 12.1.6.1. Company Overview
- 12.1.6.2. Products
- 12.1.6.3. Company Financials
- 12.1.6.4. SWOT Analysis
- 12.1.7 ZTE Corporation
- 12.1.7.1. Company Overview
- 12.1.7.2. Products
- 12.1.7.3. Company Financials
- 12.1.7.4. SWOT Analysis
- 12.1.8 Viasat Inc *List Not Exhaustive
- 12.1.8.1. Company Overview
- 12.1.8.2. Products
- 12.1.8.3. Company Financials
- 12.1.8.4. SWOT Analysis
- 12.1.9 Bombardier Aerospace Inc
- 12.1.9.1. Company Overview
- 12.1.9.2. Products
- 12.1.9.3. Company Financials
- 12.1.9.4. SWOT Analysis
- 12.1.10 Panasonic Corporation
- 12.1.10.1. Company Overview
- 12.1.10.2. Products
- 12.1.10.3. Company Financials
- 12.1.10.4. SWOT Analysis
- 12.1.1 Nokia Corp (Alcatel Lucent Enterprise Inc )
- 12.2. Market Entropy
- 12.2.1 Company's Key Areas Served
- 12.2.2 Recent Developments
- 12.3. Company Market Share Analysis 2025
- 12.3.1 Top 5 Companies Market Share Analysis
- 12.3.2 Top 3 Companies Market Share Analysis
- 12.4. List of Potential Customers
- 13. Research Methodology
List of Figures
- Figure 1: Global On-board Connectivity Market Revenue Breakdown (billion, %) by Region 2025 & 2033
- Figure 2: North America On-board Connectivity Market Revenue (billion), by Production Analysis 2025 & 2033
- Figure 3: North America On-board Connectivity Market Revenue Share (%), by Production Analysis 2025 & 2033
- Figure 4: North America On-board Connectivity Market Revenue (billion), by Consumption Analysis 2025 & 2033
- Figure 5: North America On-board Connectivity Market Revenue Share (%), by Consumption Analysis 2025 & 2033
- Figure 6: North America On-board Connectivity Market Revenue (billion), by Import Market Analysis (Value & Volume) 2025 & 2033
- Figure 7: North America On-board Connectivity Market Revenue Share (%), by Import Market Analysis (Value & Volume) 2025 & 2033
- Figure 8: North America On-board Connectivity Market Revenue (billion), by Export Market Analysis (Value & Volume) 2025 & 2033
- Figure 9: North America On-board Connectivity Market Revenue Share (%), by Export Market Analysis (Value & Volume) 2025 & 2033
- Figure 10: North America On-board Connectivity Market Revenue (billion), by Price Trend Analysis 2025 & 2033
- Figure 11: North America On-board Connectivity Market Revenue Share (%), by Price Trend Analysis 2025 & 2033
- Figure 12: North America On-board Connectivity Market Revenue (billion), by Country 2025 & 2033
- Figure 13: North America On-board Connectivity Market Revenue Share (%), by Country 2025 & 2033
- Figure 14: South America On-board Connectivity Market Revenue (billion), by Production Analysis 2025 & 2033
- Figure 15: South America On-board Connectivity Market Revenue Share (%), by Production Analysis 2025 & 2033
- Figure 16: South America On-board Connectivity Market Revenue (billion), by Consumption Analysis 2025 & 2033
- Figure 17: South America On-board Connectivity Market Revenue Share (%), by Consumption Analysis 2025 & 2033
- Figure 18: South America On-board Connectivity Market Revenue (billion), by Import Market Analysis (Value & Volume) 2025 & 2033
- Figure 19: South America On-board Connectivity Market Revenue Share (%), by Import Market Analysis (Value & Volume) 2025 & 2033
- Figure 20: South America On-board Connectivity Market Revenue (billion), by Export Market Analysis (Value & Volume) 2025 & 2033
- Figure 21: South America On-board Connectivity Market Revenue Share (%), by Export Market Analysis (Value & Volume) 2025 & 2033
- Figure 22: South America On-board Connectivity Market Revenue (billion), by Price Trend Analysis 2025 & 2033
- Figure 23: South America On-board Connectivity Market Revenue Share (%), by Price Trend Analysis 2025 & 2033
- Figure 24: South America On-board Connectivity Market Revenue (billion), by Country 2025 & 2033
- Figure 25: South America On-board Connectivity Market Revenue Share (%), by Country 2025 & 2033
- Figure 26: Europe On-board Connectivity Market Revenue (billion), by Production Analysis 2025 & 2033
- Figure 27: Europe On-board Connectivity Market Revenue Share (%), by Production Analysis 2025 & 2033
- Figure 28: Europe On-board Connectivity Market Revenue (billion), by Consumption Analysis 2025 & 2033
- Figure 29: Europe On-board Connectivity Market Revenue Share (%), by Consumption Analysis 2025 & 2033
- Figure 30: Europe On-board Connectivity Market Revenue (billion), by Import Market Analysis (Value & Volume) 2025 & 2033
- Figure 31: Europe On-board Connectivity Market Revenue Share (%), by Import Market Analysis (Value & Volume) 2025 & 2033
- Figure 32: Europe On-board Connectivity Market Revenue (billion), by Export Market Analysis (Value & Volume) 2025 & 2033
- Figure 33: Europe On-board Connectivity Market Revenue Share (%), by Export Market Analysis (Value & Volume) 2025 & 2033
- Figure 34: Europe On-board Connectivity Market Revenue (billion), by Price Trend Analysis 2025 & 2033
- Figure 35: Europe On-board Connectivity Market Revenue Share (%), by Price Trend Analysis 2025 & 2033
- Figure 36: Europe On-board Connectivity Market Revenue (billion), by Country 2025 & 2033
- Figure 37: Europe On-board Connectivity Market Revenue Share (%), by Country 2025 & 2033
- Figure 38: Middle East & Africa On-board Connectivity Market Revenue (billion), by Production Analysis 2025 & 2033
- Figure 39: Middle East & Africa On-board Connectivity Market Revenue Share (%), by Production Analysis 2025 & 2033
- Figure 40: Middle East & Africa On-board Connectivity Market Revenue (billion), by Consumption Analysis 2025 & 2033
- Figure 41: Middle East & Africa On-board Connectivity Market Revenue Share (%), by Consumption Analysis 2025 & 2033
- Figure 42: Middle East & Africa On-board Connectivity Market Revenue (billion), by Import Market Analysis (Value & Volume) 2025 & 2033
- Figure 43: Middle East & Africa On-board Connectivity Market Revenue Share (%), by Import Market Analysis (Value & Volume) 2025 & 2033
- Figure 44: Middle East & Africa On-board Connectivity Market Revenue (billion), by Export Market Analysis (Value & Volume) 2025 & 2033
- Figure 45: Middle East & Africa On-board Connectivity Market Revenue Share (%), by Export Market Analysis (Value & Volume) 2025 & 2033
- Figure 46: Middle East & Africa On-board Connectivity Market Revenue (billion), by Price Trend Analysis 2025 & 2033
- Figure 47: Middle East & Africa On-board Connectivity Market Revenue Share (%), by Price Trend Analysis 2025 & 2033
- Figure 48: Middle East & Africa On-board Connectivity Market Revenue (billion), by Country 2025 & 2033
- Figure 49: Middle East & Africa On-board Connectivity Market Revenue Share (%), by Country 2025 & 2033
- Figure 50: Asia Pacific On-board Connectivity Market Revenue (billion), by Production Analysis 2025 & 2033
- Figure 51: Asia Pacific On-board Connectivity Market Revenue Share (%), by Production Analysis 2025 & 2033
- Figure 52: Asia Pacific On-board Connectivity Market Revenue (billion), by Consumption Analysis 2025 & 2033
- Figure 53: Asia Pacific On-board Connectivity Market Revenue Share (%), by Consumption Analysis 2025 & 2033
- Figure 54: Asia Pacific On-board Connectivity Market Revenue (billion), by Import Market Analysis (Value & Volume) 2025 & 2033
- Figure 55: Asia Pacific On-board Connectivity Market Revenue Share (%), by Import Market Analysis (Value & Volume) 2025 & 2033
- Figure 56: Asia Pacific On-board Connectivity Market Revenue (billion), by Export Market Analysis (Value & Volume) 2025 & 2033
- Figure 57: Asia Pacific On-board Connectivity Market Revenue Share (%), by Export Market Analysis (Value & Volume) 2025 & 2033
- Figure 58: Asia Pacific On-board Connectivity Market Revenue (billion), by Price Trend Analysis 2025 & 2033
- Figure 59: Asia Pacific On-board Connectivity Market Revenue Share (%), by Price Trend Analysis 2025 & 2033
- Figure 60: Asia Pacific On-board Connectivity Market Revenue (billion), by Country 2025 & 2033
- Figure 61: Asia Pacific On-board Connectivity Market Revenue Share (%), by Country 2025 & 2033
List of Tables
- Table 1: Global On-board Connectivity Market Revenue billion Forecast, by Production Analysis 2020 & 2033
- Table 2: Global On-board Connectivity Market Revenue billion Forecast, by Consumption Analysis 2020 & 2033
- Table 3: Global On-board Connectivity Market Revenue billion Forecast, by Import Market Analysis (Value & Volume) 2020 & 2033
- Table 4: Global On-board Connectivity Market Revenue billion Forecast, by Export Market Analysis (Value & Volume) 2020 & 2033
- Table 5: Global On-board Connectivity Market Revenue billion Forecast, by Price Trend Analysis 2020 & 2033
- Table 6: Global On-board Connectivity Market Revenue billion Forecast, by Region 2020 & 2033
- Table 7: Global On-board Connectivity Market Revenue billion Forecast, by Production Analysis 2020 & 2033
- Table 8: Global On-board Connectivity Market Revenue billion Forecast, by Consumption Analysis 2020 & 2033
- Table 9: Global On-board Connectivity Market Revenue billion Forecast, by Import Market Analysis (Value & Volume) 2020 & 2033
- Table 10: Global On-board Connectivity Market Revenue billion Forecast, by Export Market Analysis (Value & Volume) 2020 & 2033
- Table 11: Global On-board Connectivity Market Revenue billion Forecast, by Price Trend Analysis 2020 & 2033
- Table 12: Global On-board Connectivity Market Revenue billion Forecast, by Country 2020 & 2033
- Table 13: United States On-board Connectivity Market Revenue (billion) Forecast, by Application 2020 & 2033
- Table 14: Canada On-board Connectivity Market Revenue (billion) Forecast, by Application 2020 & 2033
- Table 15: Mexico On-board Connectivity Market Revenue (billion) Forecast, by Application 2020 & 2033
- Table 16: Global On-board Connectivity Market Revenue billion Forecast, by Production Analysis 2020 & 2033
- Table 17: Global On-board Connectivity Market Revenue billion Forecast, by Consumption Analysis 2020 & 2033
- Table 18: Global On-board Connectivity Market Revenue billion Forecast, by Import Market Analysis (Value & Volume) 2020 & 2033
- Table 19: Global On-board Connectivity Market Revenue billion Forecast, by Export Market Analysis (Value & Volume) 2020 & 2033
- Table 20: Global On-board Connectivity Market Revenue billion Forecast, by Price Trend Analysis 2020 & 2033
- Table 21: Global On-board Connectivity Market Revenue billion Forecast, by Country 2020 & 2033
- Table 22: Brazil On-board Connectivity Market Revenue (billion) Forecast, by Application 2020 & 2033
- Table 23: Argentina On-board Connectivity Market Revenue (billion) Forecast, by Application 2020 & 2033
- Table 24: Rest of South America On-board Connectivity Market Revenue (billion) Forecast, by Application 2020 & 2033
- Table 25: Global On-board Connectivity Market Revenue billion Forecast, by Production Analysis 2020 & 2033
- Table 26: Global On-board Connectivity Market Revenue billion Forecast, by Consumption Analysis 2020 & 2033
- Table 27: Global On-board Connectivity Market Revenue billion Forecast, by Import Market Analysis (Value & Volume) 2020 & 2033
- Table 28: Global On-board Connectivity Market Revenue billion Forecast, by Export Market Analysis (Value & Volume) 2020 & 2033
- Table 29: Global On-board Connectivity Market Revenue billion Forecast, by Price Trend Analysis 2020 & 2033
- Table 30: Global On-board Connectivity Market Revenue billion Forecast, by Country 2020 & 2033
- Table 31: United Kingdom On-board Connectivity Market Revenue (billion) Forecast, by Application 2020 & 2033
- Table 32: Germany On-board Connectivity Market Revenue (billion) Forecast, by Application 2020 & 2033
- Table 33: France On-board Connectivity Market Revenue (billion) Forecast, by Application 2020 & 2033
- Table 34: Italy On-board Connectivity Market Revenue (billion) Forecast, by Application 2020 & 2033
- Table 35: Spain On-board Connectivity Market Revenue (billion) Forecast, by Application 2020 & 2033
- Table 36: Russia On-board Connectivity Market Revenue (billion) Forecast, by Application 2020 & 2033
- Table 37: Benelux On-board Connectivity Market Revenue (billion) Forecast, by Application 2020 & 2033
- Table 38: Nordics On-board Connectivity Market Revenue (billion) Forecast, by Application 2020 & 2033
- Table 39: Rest of Europe On-board Connectivity Market Revenue (billion) Forecast, by Application 2020 & 2033
- Table 40: Global On-board Connectivity Market Revenue billion Forecast, by Production Analysis 2020 & 2033
- Table 41: Global On-board Connectivity Market Revenue billion Forecast, by Consumption Analysis 2020 & 2033
- Table 42: Global On-board Connectivity Market Revenue billion Forecast, by Import Market Analysis (Value & Volume) 2020 & 2033
- Table 43: Global On-board Connectivity Market Revenue billion Forecast, by Export Market Analysis (Value & Volume) 2020 & 2033
- Table 44: Global On-board Connectivity Market Revenue billion Forecast, by Price Trend Analysis 2020 & 2033
- Table 45: Global On-board Connectivity Market Revenue billion Forecast, by Country 2020 & 2033
- Table 46: Turkey On-board Connectivity Market Revenue (billion) Forecast, by Application 2020 & 2033
- Table 47: Israel On-board Connectivity Market Revenue (billion) Forecast, by Application 2020 & 2033
- Table 48: GCC On-board Connectivity Market Revenue (billion) Forecast, by Application 2020 & 2033
- Table 49: North Africa On-board Connectivity Market Revenue (billion) Forecast, by Application 2020 & 2033
- Table 50: South Africa On-board Connectivity Market Revenue (billion) Forecast, by Application 2020 & 2033
- Table 51: Rest of Middle East & Africa On-board Connectivity Market Revenue (billion) Forecast, by Application 2020 & 2033
- Table 52: Global On-board Connectivity Market Revenue billion Forecast, by Production Analysis 2020 & 2033
- Table 53: Global On-board Connectivity Market Revenue billion Forecast, by Consumption Analysis 2020 & 2033
- Table 54: Global On-board Connectivity Market Revenue billion Forecast, by Import Market Analysis (Value & Volume) 2020 & 2033
- Table 55: Global On-board Connectivity Market Revenue billion Forecast, by Export Market Analysis (Value & Volume) 2020 & 2033
- Table 56: Global On-board Connectivity Market Revenue billion Forecast, by Price Trend Analysis 2020 & 2033
- Table 57: Global On-board Connectivity Market Revenue billion Forecast, by Country 2020 & 2033
- Table 58: China On-board Connectivity Market Revenue (billion) Forecast, by Application 2020 & 2033
- Table 59: India On-board Connectivity Market Revenue (billion) Forecast, by Application 2020 & 2033
- Table 60: Japan On-board Connectivity Market Revenue (billion) Forecast, by Application 2020 & 2033
- Table 61: South Korea On-board Connectivity Market Revenue (billion) Forecast, by Application 2020 & 2033
- Table 62: ASEAN On-board Connectivity Market Revenue (billion) Forecast, by Application 2020 & 2033
- Table 63: Oceania On-board Connectivity Market Revenue (billion) Forecast, by Application 2020 & 2033
- Table 64: Rest of Asia Pacific On-board Connectivity Market Revenue (billion) Forecast, by Application 2020 & 2033
Frequently Asked Questions
1. What is the projected Compound Annual Growth Rate (CAGR) of the On-board Connectivity Market?
The projected CAGR is approximately 13.5%.
2. Which companies are prominent players in the On-board Connectivity Market?
Key companies in the market include Nokia Corp (Alcatel Lucent Enterprise Inc ), AT & T Inc, Honeywell International Inc, Rockwell Collins Inc, Inmarsat PLC, Huawei Technologies Co Ltd, ZTE Corporation, Viasat Inc *List Not Exhaustive, Bombardier Aerospace Inc, Panasonic Corporation.
3. What are the main segments of the On-board Connectivity Market?
The market segments include Production Analysis, Consumption Analysis, Import Market Analysis (Value & Volume), Export Market Analysis (Value & Volume), Price Trend Analysis.
4. Can you provide details about the market size?
The market size is estimated to be USD 10.4 billion as of 2022.
5. What are some drivers contributing to market growth?
; Increasing Number Of Air Passengers; Use Of Portable Electronic Devices.
6. What are the notable trends driving market growth?
Aviation Industry Expected to Witness Significant Growth.
7. Are there any restraints impacting market growth?
; High Cost Of Connectivity Equipments.
8. Can you provide examples of recent developments in the market?
N/A
9. What pricing options are available for accessing the report?
Pricing options include single-user, multi-user, and enterprise licenses priced at USD 4750, USD 5250, and USD 8750 respectively.
10. Is the market size provided in terms of value or volume?
The market size is provided in terms of value, measured in billion.
11. Are there any specific market keywords associated with the report?
Yes, the market keyword associated with the report is "On-board Connectivity Market," which aids in identifying and referencing the specific market segment covered.
12. How do I determine which pricing option suits my needs best?
The pricing options vary based on user requirements and access needs. Individual users may opt for single-user licenses, while businesses requiring broader access may choose multi-user or enterprise licenses for cost-effective access to the report.
13. Are there any additional resources or data provided in the On-board Connectivity Market report?
While the report offers comprehensive insights, it's advisable to review the specific contents or supplementary materials provided to ascertain if additional resources or data are available.
14. How can I stay updated on further developments or reports in the On-board Connectivity Market?
To stay informed about further developments, trends, and reports in the On-board Connectivity Market, consider subscribing to industry newsletters, following relevant companies and organizations, or regularly checking reputable industry news sources and publications.
Methodology
Step 1 - Identification of Relevant Samples Size from Population Database


Step 2 - Approaches for Defining Global Market Size (Value, Volume* & Price*)

Note*: In applicable scenarios
Step 3 - Data Sources
Primary Research
- Web Analytics
- Survey Reports
- Research Institute
- Latest Research Reports
- Opinion Leaders
Secondary Research
- Annual Reports
- White Paper
- Latest Press Release
- Industry Association
- Paid Database
- Investor Presentations

Step 4 - Data Triangulation
Involves using different sources of information in order to increase the validity of a study
These sources are likely to be stakeholders in a program - participants, other researchers, program staff, other community members, and so on.
Then we put all data in single framework & apply various statistical tools to find out the dynamic on the market.
During the analysis stage, feedback from the stakeholder groups would be compared to determine areas of agreement as well as areas of divergence